
Trade The World
Dow Jones Industrial Average churns chart paper as markets await inflation data
作者 Joshua Gibson
发布日期: 9 Sep 2025 | 修改日期: 9 Sep 2025


POPULAR ARTICLES

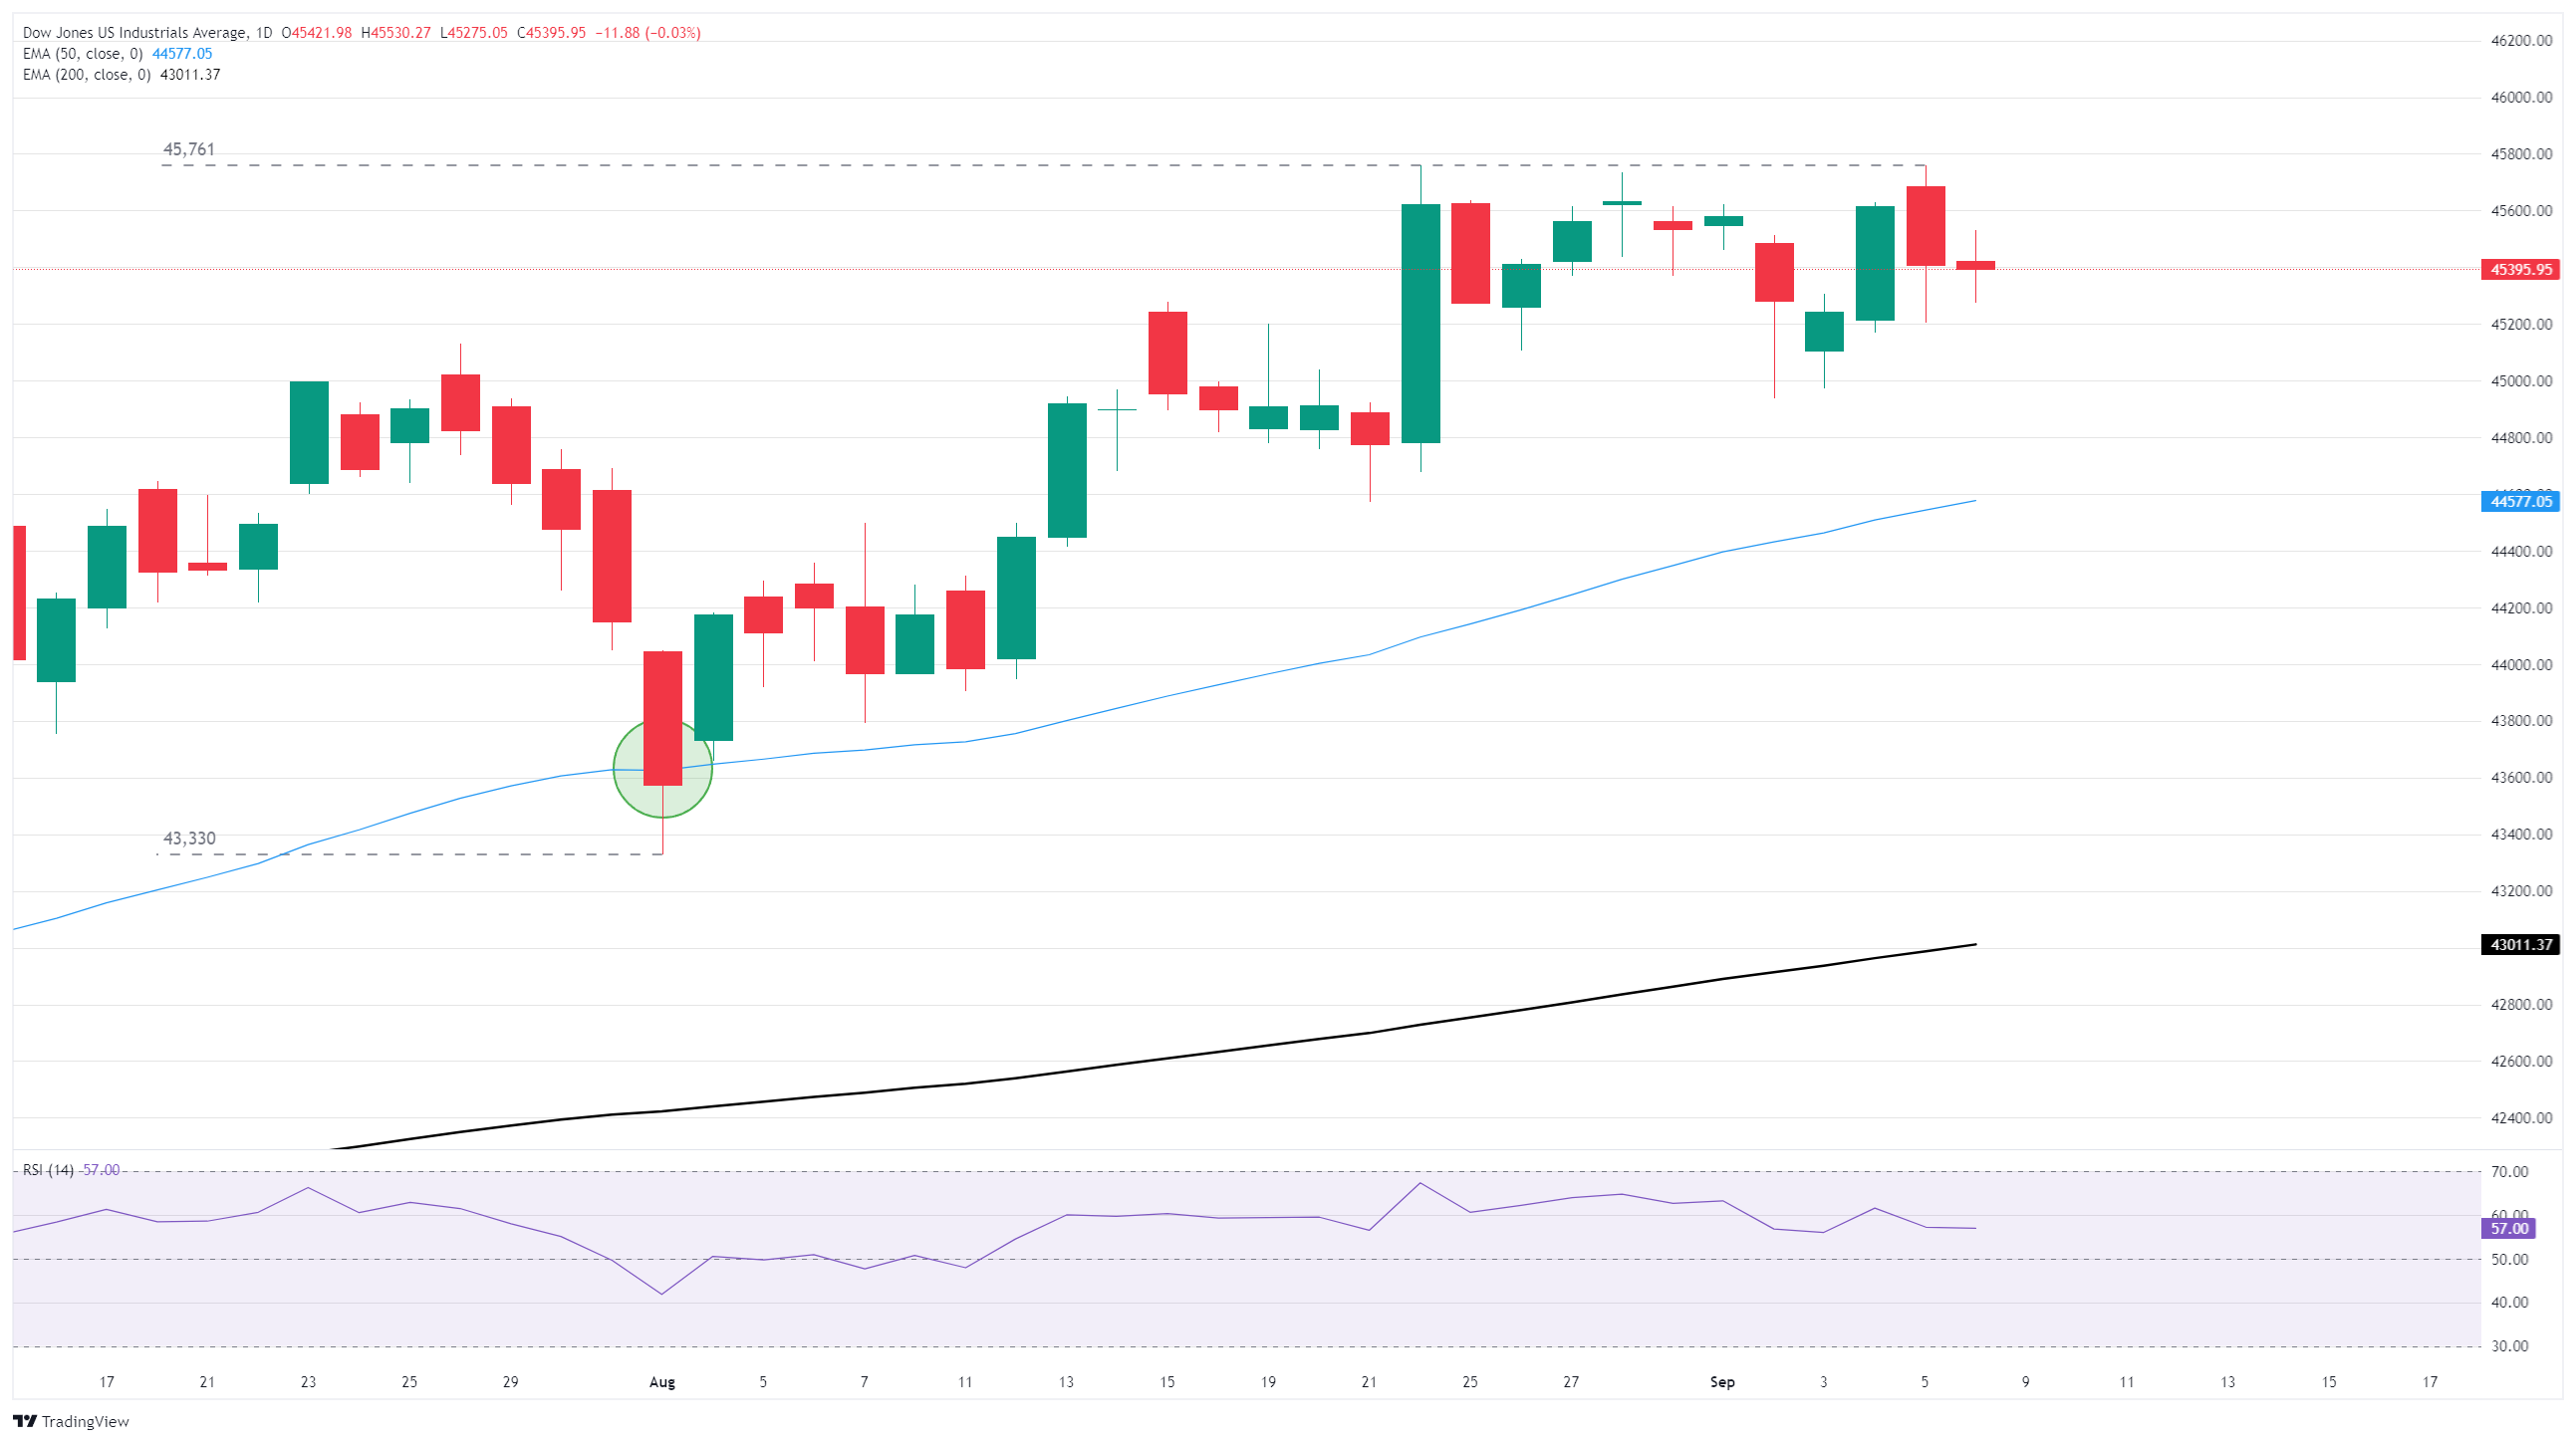
The Dow Jones Industrial Average (DJIA) churned chart paper on Monday, finding a near-term floor at the 45,400 level. Investors continue to lean into bets that the Federal Reserve (Fed) will deliver an interest rate cut on September 17.
- The Dow Jones stuck close to 45,500 on Monday as investors take a pause.
- Markets are still banking heavily on a Fed rate cut next week.
- CPI inflation expected to accelerate again this Thursday.
The Dow Jones Industrial Average (DJIA) churned chart paper on Monday, finding a near-term floor at the 45,400 level. Investors continue to lean into bets that the Federal Reserve (Fed) will deliver an interest rate cut on September 17.
Other major indexes with larger exposure to tech rally components left the Dow behind on Monday. The Dow Jones held near flat to kick off the new trading week, while the tech-focused Nasdaq climbed into a fresh record high. The Dow is holding steady near record highs above 45,761, but investors are awaiting a fresh turn of the macro data page before stepping back into firmer bids.
Markets maintain bets for upcoming rate cut
Last week’s worse-than-expected Nonfarm Payrolls (NFP) jobs report cemented investor expectations that the Fed will trim interest rates next week. However, this week’s upcoming Consumer Price Index (CPI) inflation print remains a key barrier. Inflation data has remained stubbornly above the Fed’s 2% top-line target, with functionally no progress on defeating inflation for most of the year.
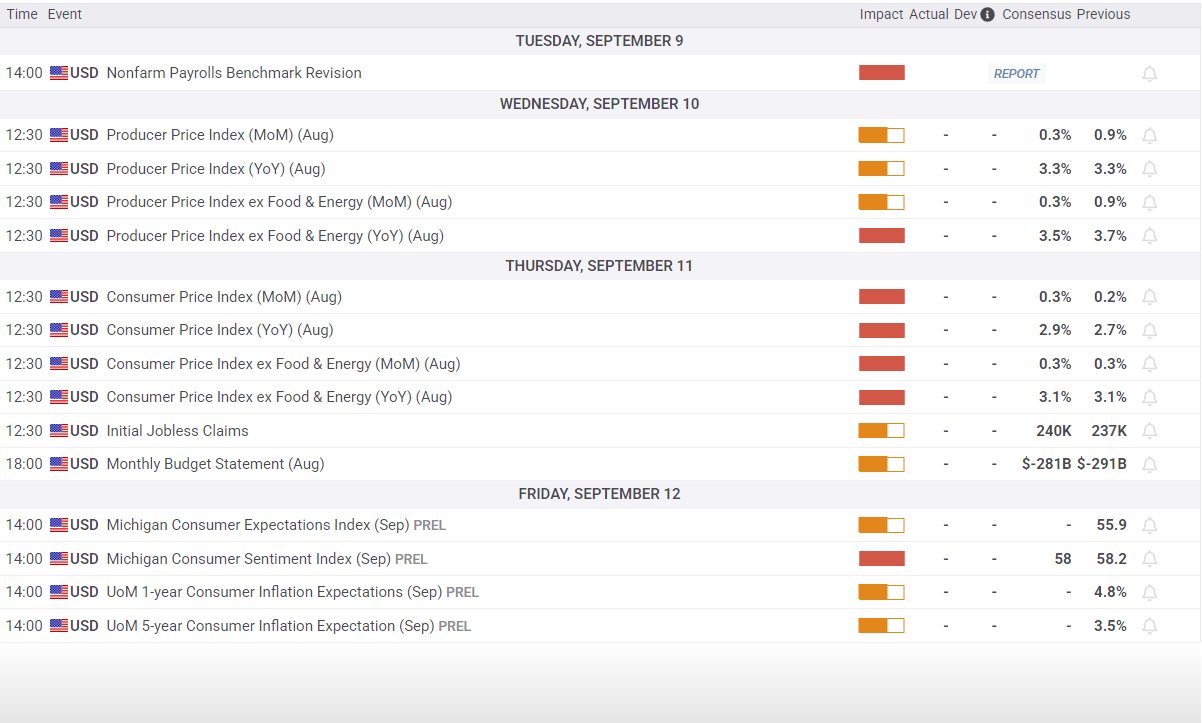
The Bureau of Labor Statistics’ (BLS) annual benchmark revision for current employment statistics data is also due this week. Over the past decade, benchmark revisions have averaged 0.1% adjustments to final employment numbers, but the Trump administration's ongoing politicization of both the Fed and the BLS will put any adjustments to figures under a microscope.
BLS benchmark adjustments are slated for Tuesday, with CPI inflation figures due on Thursday.
Read more stock news: Robinhood stock flies higher on addition to S&P 500
Dow Jones daily chart
Dow Jones FAQs
The Dow Jones Industrial Average, one of the oldest stock market indices in the world, is compiled of the 30 most traded stocks in the US. The index is price-weighted rather than weighted by capitalization. It is calculated by summing the prices of the constituent stocks and dividing them by a factor, currently 0.152. The index was founded by Charles Dow, who also founded the Wall Street Journal. In later years it has been criticized for not being broadly representative enough because it only tracks 30 conglomerates, unlike broader indices such as the S&P 500.
Many different factors drive the Dow Jones Industrial Average (DJIA). The aggregate performance of the component companies revealed in quarterly company earnings reports is the main one. US and global macroeconomic data also contributes as it impacts on investor sentiment. The level of interest rates, set by the Federal Reserve (Fed), also influences the DJIA as it affects the cost of credit, on which many corporations are heavily reliant. Therefore, inflation can be a major driver as well as other metrics which impact the Fed decisions.
Dow Theory is a method for identifying the primary trend of the stock market developed by Charles Dow. A key step is to compare the direction of the Dow Jones Industrial Average (DJIA) and the Dow Jones Transportation Average (DJTA) and only follow trends where both are moving in the same direction. Volume is a confirmatory criteria. The theory uses elements of peak and trough analysis. Dow’s theory posits three trend phases: accumulation, when smart money starts buying or selling; public participation, when the wider public joins in; and distribution, when the smart money exits.
There are a number of ways to trade the DJIA. One is to use ETFs which allow investors to trade the DJIA as a single security, rather than having to buy shares in all 30 constituent companies. A leading example is the SPDR Dow Jones Industrial Average ETF (DIA). DJIA futures contracts enable traders to speculate on the future value of the index and Options provide the right, but not the obligation, to buy or sell the index at a predetermined price in the future. Mutual funds enable investors to buy a share of a diversified portfolio of DJIA stocks thus providing exposure to the overall index.

FXStreet
超过一百万用户依赖 FXStreet 获取实时市场数据、图表工具、专家洞见和外汇新闻。其全面的经济日历和教育网络研讨会帮助交易者保持信息领先、做出审慎决策。FXStreet 拥有约 60 人的团队,分布在巴塞罗那总部及全球各地区。
Read More


