
Trade The World
Ethereum Classic Price Forecast: ETC breaks out of falling wedge pattern, eyes bullish continuation
作者 Manish Chhetri
发布日期: 10 Oct 2025 | 修改日期: 10 Oct 2025


POPULAR ARTICLES

Ethereum Classic (ETC) price trades in green above $20 at the time of writing on Friday, breaking above the falling wedge pattern, signalling a potential bullish move ahead.
- Ethereum Classic price is breaking above the falling wedge pattern, signaling a bullish move ahead.
- On-chain and derivatives data show rising trading volume, increasing bullish bets, and higher Open Interest.
- The technical outlook suggests further gains if ETC confirms a successful breakout from the falling wedge pattern.
Ethereum Classic (ETC) price trades in green above $20 at the time of writing on Friday, breaking above the falling wedge pattern, signalling a potential bullish move ahead. The positive move is further supported by rising trading volume, increasing bullish bets, and higher Open Interest (OI), which induces growing investor interest in ETC. Adding to this, the technical analysis suggests further gains if ETC confirms a successful breakout from the falling wedge pattern.
On-chain and derivatives data show bullish bias
Ethereum Classic ecosystem’s trading volume (the aggregate trading volume generated by all exchange applications on the chain) rose from 78.39 million on Saturday to 228.72 million on Friday, the highest volume since mid-September, according to Santiment data. This volume rise indicates a surge in traders’ interest and liquidity in the ETC chain, boosting its bullish outlook.
 [10-1760082161747-1760082161748.02.40, 10 Oct, 2025].png)
ETC trading volume chart. Source: Santiment
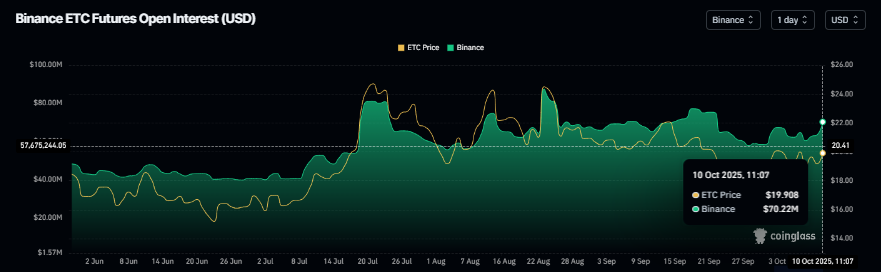
On the derivatives side, Futures’ Open Interest (OI) in Ethereum Classic at exchanges currently reads $70.22 million, as of Friday, and has been consistently rising since early October. Rising OI represents new or additional money entering the market and new buying, which could fuel the current ETC price rally.
CoinGlass’s ETC long-to-short ratio stands at 1.04 on Friday, the highest level over a month. This ratio, above one, reflects bullish sentiment in the markets, as more traders are betting on the asset price to rise.
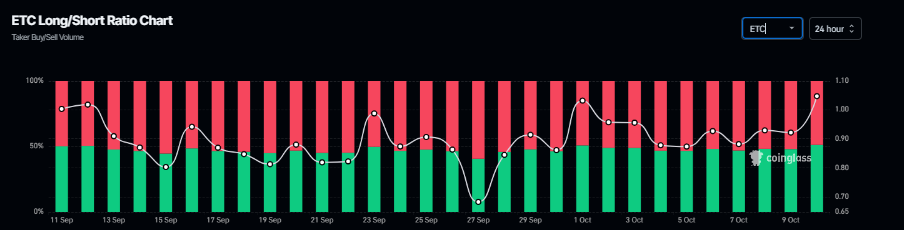
ETC long-to-short ratio chart. Source: Coinglass
Ethereum Classic Price Forecast: ETC breaking above the falling wedge pattern
Ethereum Classic price is breaking above the falling wedge pattern (drawn by joining multiple highs and lows since early August) on Friday, trading above $20. A successful breakout of this formation favors the bulls.
If ETC breaks above this pattern and closes above the 200-day Exponential Moving Average (EMA) at $20.03, could extend the rally toward the daily resistance level at $21.38. A successful close above the latter would extend gains toward the September 13 high of $22.52.
The Relative Strength Index (RSI) read 54 on the daily chart, moving above the neutral level of 50, indicating bullish momentum gaining traction. The Moving Average Convergence Divergence (MACD) indicators also showed a bullish crossover last week, which remains in effect, supporting the bullish view.
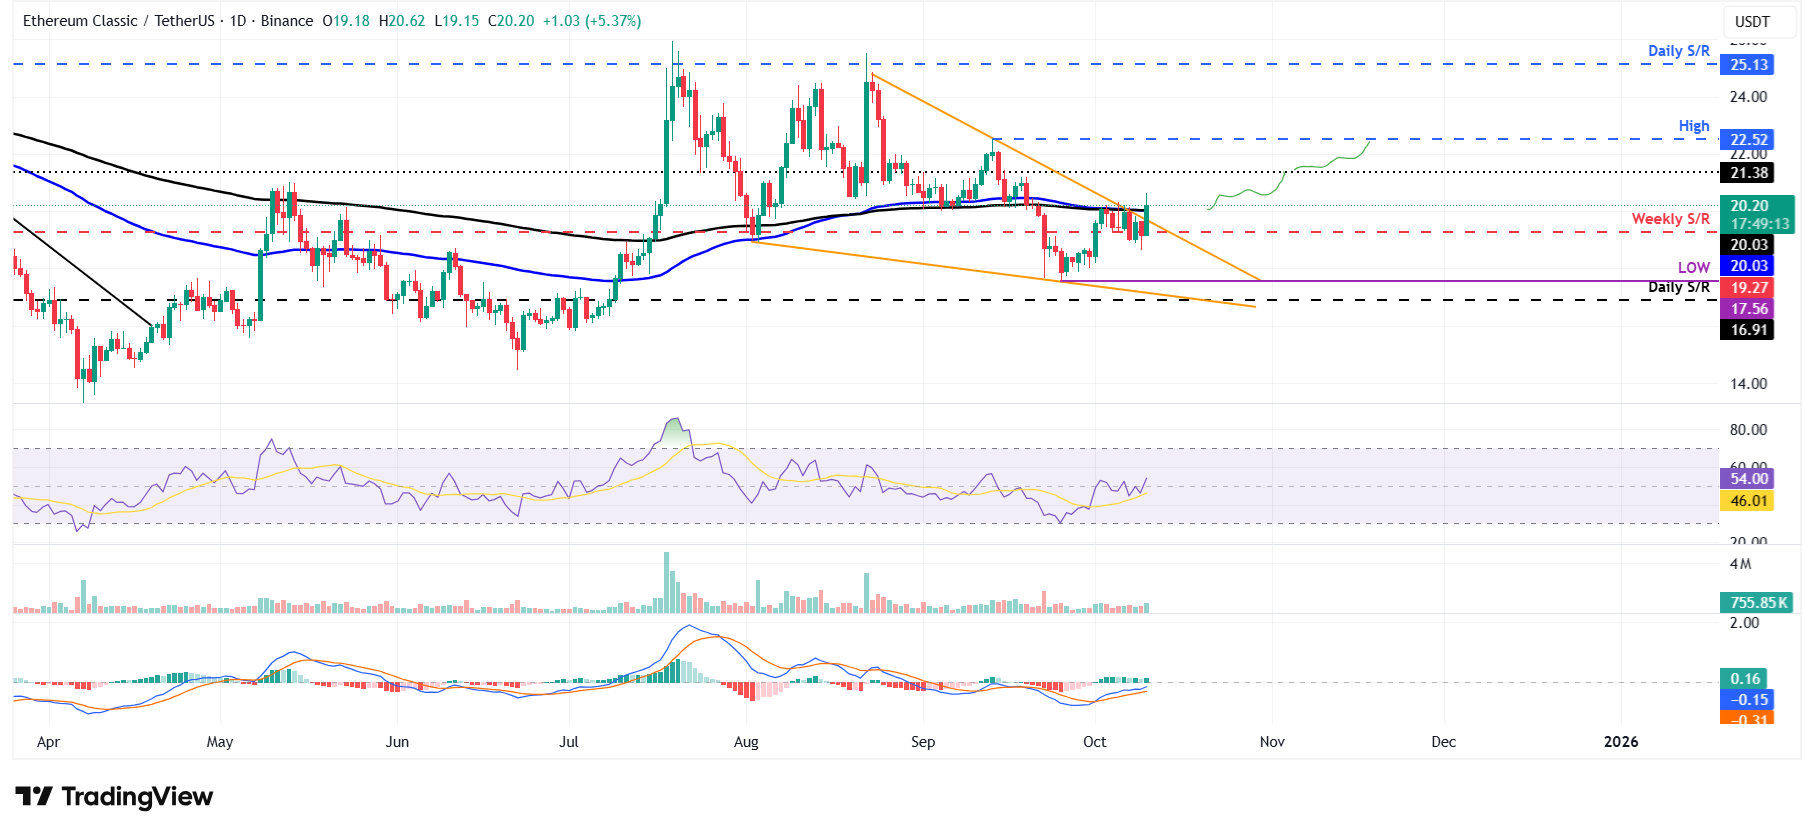
ETC/USDT daily chart
However, if ETC fails to break above the upper trendline boundary of the falling wedge pattern and corrects, it could extend the decline toward the September 25 low of $17.56.

FXStreet
超过一百万用户依赖 FXStreet 获取实时市场数据、图表工具、专家洞见和外汇新闻。其全面的经济日历和教育网络研讨会帮助交易者保持信息领先、做出审慎决策。FXStreet 拥有约 60 人的团队,分布在巴塞罗那总部及全球各地区。
Read More


