
Trade The World
EUR/JPY Price Forecast: Reaches record highs above 178.50 as bullish bias persists
作者 Akhtar Faruqui
发布日期: 30 Oct 2025 | 修改日期: 30 Oct 2025


POPULAR ARTICLES

EUR/JPY gains ground after remaining flat in the previous session, trading around 178.50, near record highs, during the European hours on Thursday.
- EUR/JPY reached the all-time high of 178.71 on Thursday.
- The 14-day Relative Strength Index (RSI) has rebounded toward the 70 level, reinforcing the bullish bias.
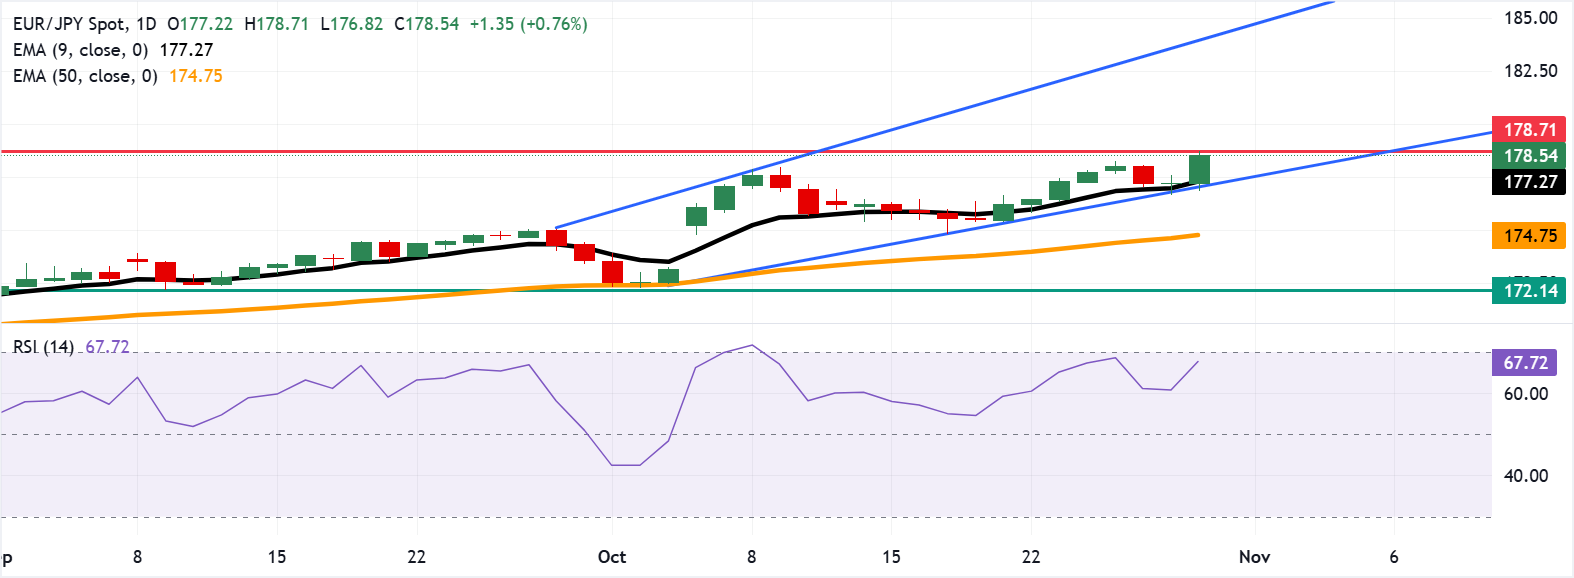
- The currency pair may look to test the confluence support area near the nine-day EMA at 177.27.
EUR/JPY gains ground after remaining flat in the previous session, trading around 178.50, near record highs, during the European hours on Thursday. The technical analysis of the daily chart suggests strengthening of a bullish bias as the currency cross has rebounded from the confluence support zone around the nine-day Exponential Moving Average (EMA) and lower boundary of the ascending channel pattern.
The short-term price momentum is stronger as the EUR/JPY cross remains above the nine-day EMA. The 14-day Relative Strength Index (RSI) has rebounded toward the 70 mark, strengthening the bullish bias. Further advances would lead the currency cross to reach overbought territory.
The EUR/JPY cross reached the all-time high at 178.71, reached on October 30. Further advances would support the currency cross to explore the region around the upper boundary of the ascending channel around 184.00.
On the downside, the EUR/JPY cross may again target the confluence support zone around the nine-day EMA of 177.27 and the ascending channel’s lower boundary around 177.00. A break below the channel would undermine the short-term bullish momentum, potentially putting downward pressure on the currency pair toward the 50-day EMA region near 174.75, followed by the seven-week low of 172.14, which was recorded on September 9.
EUR/JPY: Daily Chart
Euro Price Today
The table below shows the percentage change of Euro (EUR) against listed major currencies today. Euro was the strongest against the Japanese Yen.
| USD | EUR | GBP | JPY | CAD | AUD | NZD | CHF | |
|---|---|---|---|---|---|---|---|---|
| USD | -0.13% | -0.05% | 0.66% | 0.03% | -0.04% | -0.14% | -0.12% | |
| EUR | 0.13% | 0.08% | 0.80% | 0.17% | 0.09% | -0.00% | 0.01% | |
| GBP | 0.05% | -0.08% | 0.73% | 0.08% | 0.02% | -0.09% | -0.07% | |
| JPY | -0.66% | -0.80% | -0.73% | -0.65% | -0.70% | -0.82% | -0.82% | |
| CAD | -0.03% | -0.17% | -0.08% | 0.65% | -0.06% | -0.17% | -0.16% | |
| AUD | 0.04% | -0.09% | -0.02% | 0.70% | 0.06% | -0.10% | -0.09% | |
| NZD | 0.14% | 0.00% | 0.09% | 0.82% | 0.17% | 0.10% | 0.04% | |
| CHF | 0.12% | -0.01% | 0.07% | 0.82% | 0.16% | 0.09% | -0.04% |
The heat map shows percentage changes of major currencies against each other. The base currency is picked from the left column, while the quote currency is picked from the top row. For example, if you pick the Euro from the left column and move along the horizontal line to the US Dollar, the percentage change displayed in the box will represent EUR (base)/USD (quote).

FXStreet
超过一百万用户依赖 FXStreet 获取实时市场数据、图表工具、专家洞见和外汇新闻。其全面的经济日历和教育网络研讨会帮助交易者保持信息领先、做出审慎决策。FXStreet 拥有约 60 人的团队,分布在巴塞罗那总部及全球各地区。
Read More


