
Trade The World
GBP/JPY Price Forecast: Rebounds above 201.00 but upside limited
作者 Christian Borjon Valencia
发布日期: 6 Nov 2025 | 修改日期: 6 Nov 2025


POPULAR ARTICLES

The GBP/JPY shows signs of recovery on Wednesday, trades above the 50-day Simple Moving Average (SMA) of 200.97, after hitting a daily low of 199.61 earlier in the session. At the time of writing, the pair trades at 201.10, up 0.53%.
- GBP/JPY rises 0.53% as buyers defend key support, holding near recent highs.
- RSI below 50 signals fading bullish momentum and growing downside risk.
- Break below support exposes 199.60–197.50 zone; recovery above 202.00 needed to retest resistance area.
The GBP/JPY shows signs of recovery on Wednesday, trades above the 50-day Simple Moving Average (SMA) of 200.97, after hitting a daily low of 199.61 earlier in the session. At the time of writing, the pair trades at 201.10, up 0.53%.
GBP/JPY Price Forecast: Technical outlook
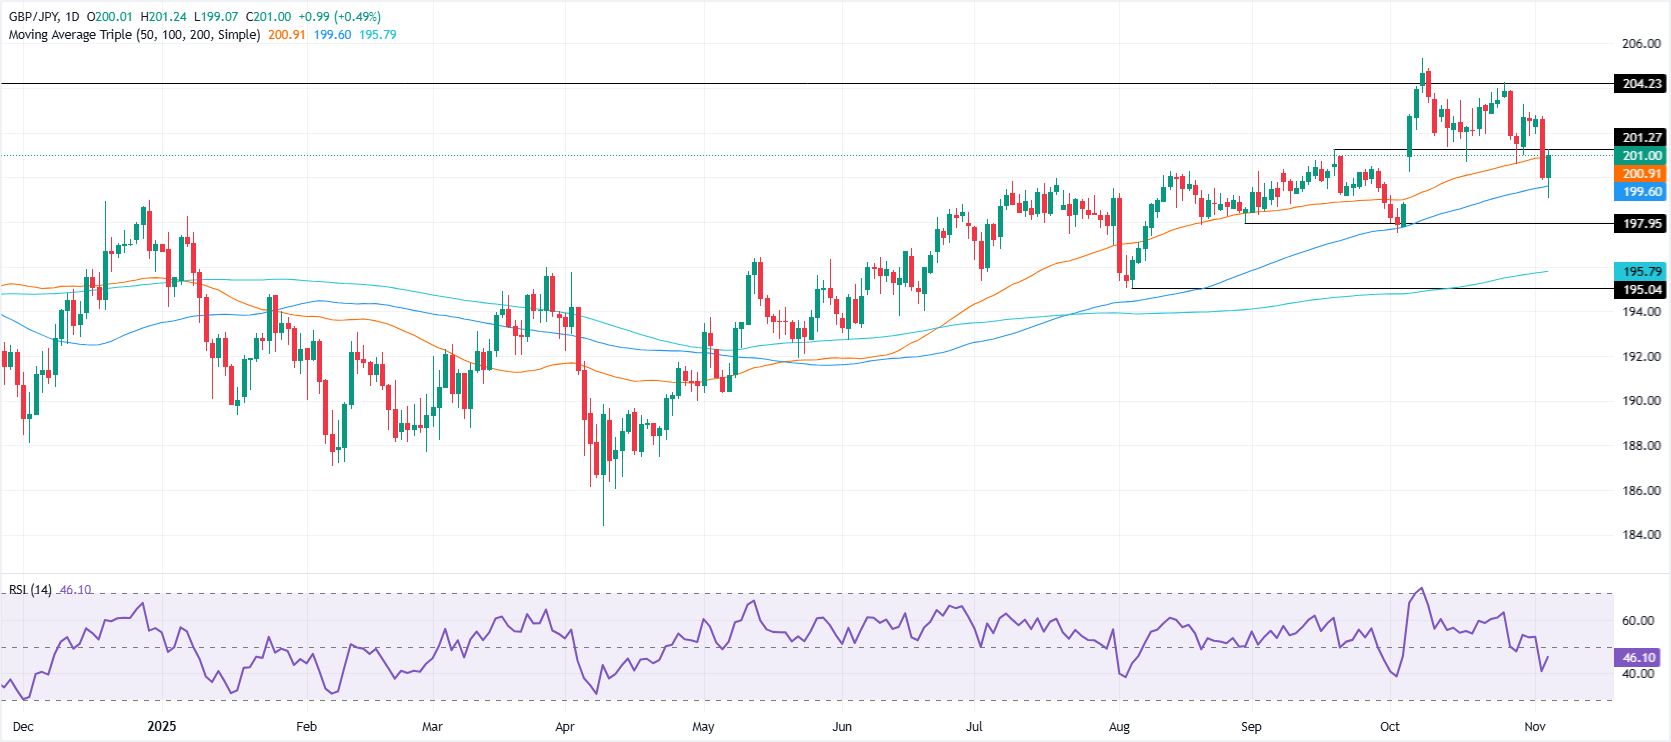
The GBP/JPY seems poised to consolidate further below 202.00 unless buyers gain momentum, which seem far from happening as shown by the Relative Strength Index (RSI).
The RSI is edging further below its 50 neutral level an indication that bears are stepping in.
If GBP/JPY tumbles below 201.00 the next support would be 199.61 ahead of the October 2 low of 197.49. Once surpassed, the next stop would be the 200-day SMA at 195.85.
Conversely if GBP/JPY recovers above 202.00, the next resistance will be the 20-day SMA At 202.32. A breach of the latter will expose 203.00, followed by the 204.00 milestone.
GBP/JPY Price Chart – Daily
Pound Sterling Price This week
The table below shows the percentage change of British Pound (GBP) against listed major currencies this week. British Pound was the strongest against the New Zealand Dollar.
| USD | EUR | GBP | JPY | CAD | AUD | NZD | CHF | |
|---|---|---|---|---|---|---|---|---|
| USD | 0.34% | 0.67% | 0.00% | 0.66% | 0.65% | 1.17% | 0.71% | |
| EUR | -0.34% | 0.32% | -0.25% | 0.32% | 0.30% | 0.83% | 0.37% | |
| GBP | -0.67% | -0.32% | -0.74% | -0.01% | -0.04% | 0.50% | 0.04% | |
| JPY | 0.00% | 0.25% | 0.74% | 0.64% | 0.62% | 1.15% | 0.83% | |
| CAD | -0.66% | -0.32% | 0.01% | -0.64% | -0.07% | 0.48% | 0.05% | |
| AUD | -0.65% | -0.30% | 0.04% | -0.62% | 0.07% | 0.54% | 0.08% | |
| NZD | -1.17% | -0.83% | -0.50% | -1.15% | -0.48% | -0.54% | -0.45% | |
| CHF | -0.71% | -0.37% | -0.04% | -0.83% | -0.05% | -0.08% | 0.45% |
The heat map shows percentage changes of major currencies against each other. The base currency is picked from the left column, while the quote currency is picked from the top row. For example, if you pick the British Pound from the left column and move along the horizontal line to the US Dollar, the percentage change displayed in the box will represent GBP (base)/USD (quote).

FXStreet
超过一百万用户依赖 FXStreet 获取实时市场数据、图表工具、专家洞见和外汇新闻。其全面的经济日历和教育网络研讨会帮助交易者保持信息领先、做出审慎决策。FXStreet 拥有约 60 人的团队,分布在巴塞罗那总部及全球各地区。
Read More


