
Trade The World
Gold Price Forecast: XAU/USD consolidates around $3,550 ahead of US NFP data for August
作者 Sagar Dua
发布日期: 5 Sep 2025 | 修改日期: 5 Sep 2025


POPULAR ARTICLES

Gold price (XAU/USD) trades in a tight range around $3,350 during the European trading session on Friday. The precious metal consolidates as investors await the United States (US) Nonfarm Payrolls (NFP) data for August, which will be published at 12:30 GMT.
- Gold price trades sideways around $3,550 as investors await key US NFP data for August.
- The US Dollar trades lower ahead of key US labor market data.
- Economists expect the US economy to have added 75K fresh workers in August.
Gold price (XAU/USD) trades in a tight range around $3,350 during the European trading session on Friday. The precious metal consolidates as investors await the United States (US) Nonfarm Payrolls (NFP) data for August, which will be published at 12:30 GMT.
Investors will pay close attention to the US official labor market data as it will influence market expectations for the interest rate outlook. Fed dovish expectations intensified in early August after the July’s NFP report showed a significant revision in employed figures of May and June on the downside.
Lower interest rates by the Fed improves demand for non-yielding assets, such as Gold.
Economists expect US employers to have hired 75K fresh workers, almost in line with the July’s reading of 73K. The Unemployment Rate is expected to have accelerated to 4.3% from the former release of 4.2%.
Meanwhile, Average Hourly Earnings, a key measure of wage growth, is expected to have grown at a moderate pace of 3.7%, against 3.9% in July, with monthly figures rising steadily by 0.3%.
Ahead of the US NFP data, the US Dollar Index (DXY), which tracks the Greenback’s value against six major currencies, trades 0.25% lower to near 98.00. Technically, lower US Dollar (USD) makes the Gold price an attractive bet for investors.
Gold technical analysis
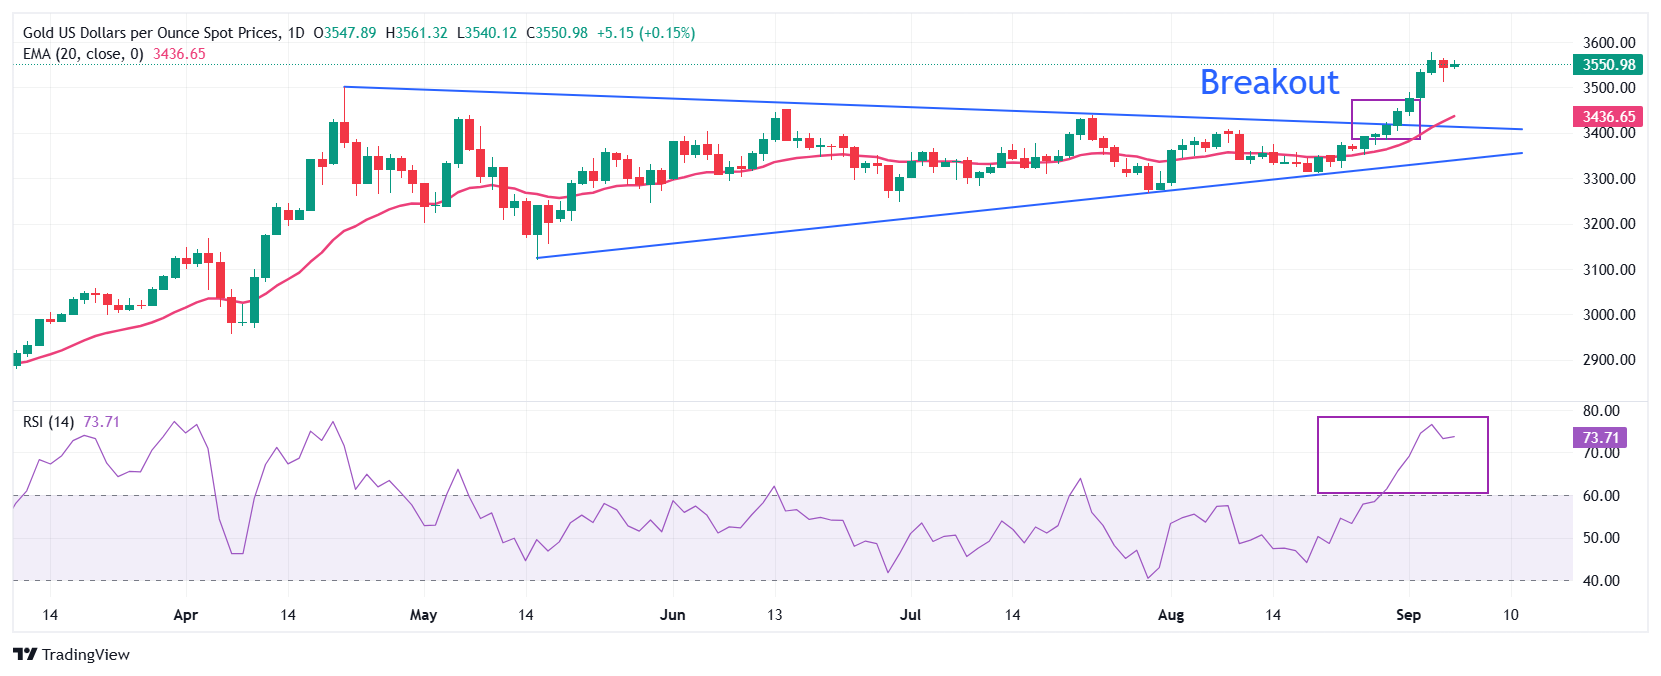
Gold price’s rally hit pause after posting a fresh all-time high near $3,580 on Wednesday. The yellow metal strengthened after a breakout of the Symmetrical Triangle chart pattern formed on a daily timeframe.
The near-term trend of the Gold price is bullish as the 20-day Exponential Moving Average (EMA) slops higher around $3,436.70.
The 14-day Relative Strength Index (RSI) jumps to near 75.00. A corrective move in the Gold price looks likely as the momentum oscillator turns overbought.
Looking down, the 20-day will act as key support for the major. On the upside, the round figure of $3,600 would be the key hurdle for the pair.
Gold daily chart

FXStreet
超过一百万用户依赖 FXStreet 获取实时市场数据、图表工具、专家洞见和外汇新闻。其全面的经济日历和教育网络研讨会帮助交易者保持信息领先、做出审慎决策。FXStreet 拥有约 60 人的团队,分布在巴塞罗那总部及全球各地区。
Read More


