
Trade The World
Gold Price Forecast: XAU/USD extends losing streak amid easing global trade fears
作者 Sagar Dua
发布日期: 25 Jul 2025 | 修改日期: 25 Jul 2025


POPULAR ARTICLES

Gold price (XAU/USD) extends its losing streak for the third trading day on Friday.
- Gold price slides to near $3,340 as tensions surrounding the global trade flow have eased.
- The US and the EU are expected to strike a tariff deal soon.
- Investors expect the Fed to leave interest rates steady next week.
Gold price (XAU/USD) extends its losing streak for the third trading day on Friday. The precious metal faces a sharp selling pressure as fears of disruption in the global trade flow have diminished, with the United States (US) remaining on a path to close a number of bilateral deals with its trading partners ahead of the August 1 tariff deal.
This week, Washington reached a trade agreement with Japan, which is one of its key trading partners, and a report from the Financial Times (FT) has shown that it will also finalize a tariff pact with the European Union (EU).
The scenario of the US striking trade agreements with its key trading partners suggests that the impact of the tariff policy introduced by President Donald Trump is not as unfavorable for the economy as it appeared earlier.
Theoretically, easing global trade tensions diminishes demand for safe-haven assets, such as Gold.
Meanwhile, a further recovery move in the US Dollar (USD) has also weighed on the Gold price. The US Dollar Index (DXY), which tracks the Greenback’s value against six major currencies, jumps to near 97.70. Technically, a higher US Dollar makes the Gold an expensive bet for investors.
Going forward, investors will focus on the Federal Reserve’s (Fed) interest rate decision, which will be announced on Wednesday. According to the CME FedWatch tool, the Fed is certain to leave interest rates in the current range of 4.25%-4.50%.
The scenario of the Fed holding interest rates at higher levels bodes poorly for non-yielding assets, such as Gold.
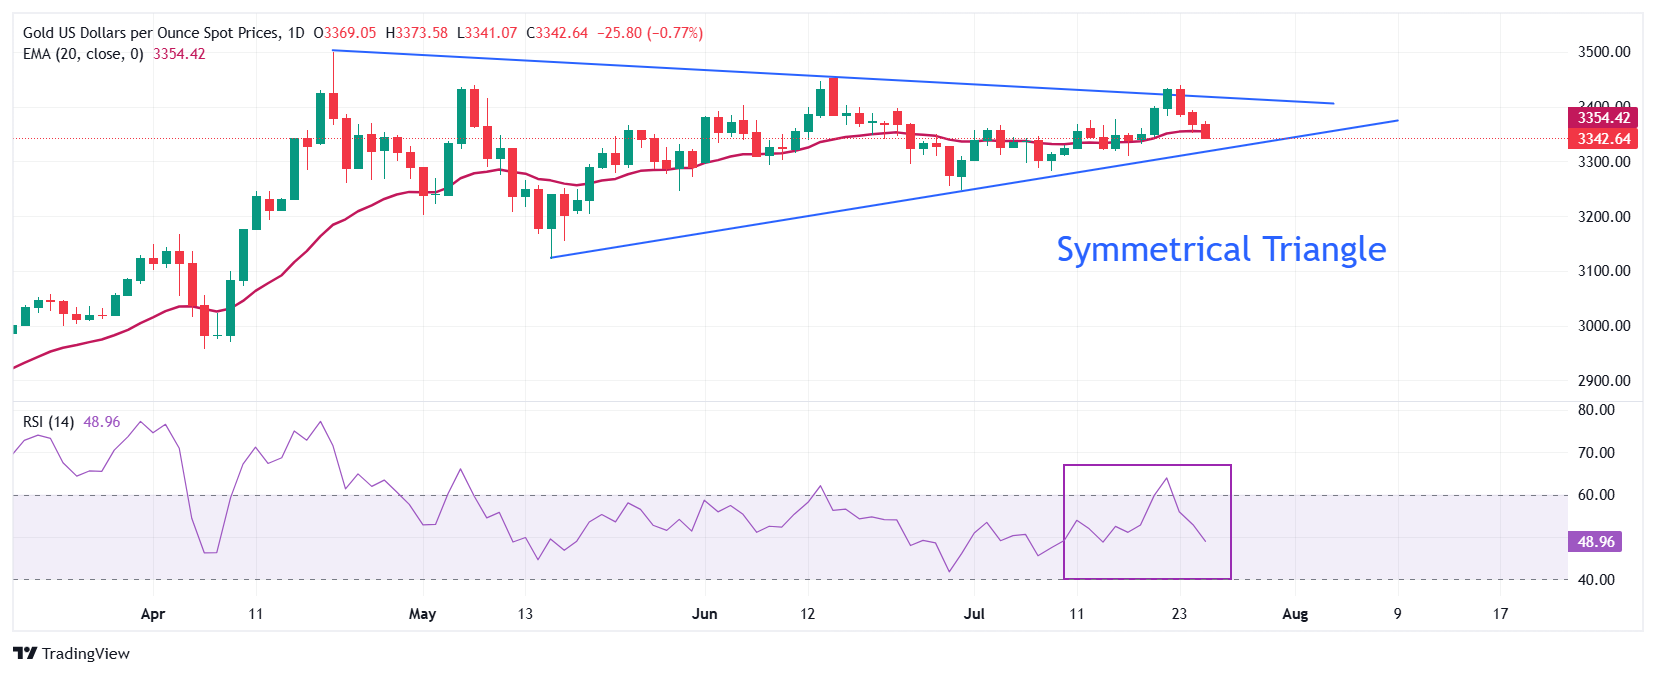
Gold technical analysis
Gold price faces selling pressure after failing to break the Symmetrical Triangle formation on the upside – a move that often leads to volatility expansion. The upward-sloping border of the above-mentioned chart pattern is placed from the May 15 low of $3,120.83, while its downward-sloping border is plotted from the April 22 high around $3,500
The precious metal slides to near the 20-day Exponential Moving Average (EMA), which trades around $3,355. A downside move by the Gold price below the same will turn the near-term trend to bearish.
The 14-day Relative Strength Index (RSI) falls inside the 40.00-60.00 range, suggesting selling pressure at higher levels.
The Gold price would fall towards the round-level support of $3,200 and the May 15 low at $3,121, if it breaks below the May 29 low of $3,245.
Looking up, the Gold price will enter uncharted territory if it breaks above the psychological level of $3,500 decisively. Potential resistances would be $3,550 and $3,600.
Gold daily chart
Gold FAQs
Gold has played a key role in human’s history as it has been widely used as a store of value and medium of exchange. Currently, apart from its shine and usage for jewelry, the precious metal is widely seen as a safe-haven asset, meaning that it is considered a good investment during turbulent times. Gold is also widely seen as a hedge against inflation and against depreciating currencies as it doesn’t rely on any specific issuer or government.
Central banks are the biggest Gold holders. In their aim to support their currencies in turbulent times, central banks tend to diversify their reserves and buy Gold to improve the perceived strength of the economy and the currency. High Gold reserves can be a source of trust for a country’s solvency. Central banks added 1,136 tonnes of Gold worth around $70 billion to their reserves in 2022, according to data from the World Gold Council. This is the highest yearly purchase since records began. Central banks from emerging economies such as China, India and Turkey are quickly increasing their Gold reserves.
Gold has an inverse correlation with the US Dollar and US Treasuries, which are both major reserve and safe-haven assets. When the Dollar depreciates, Gold tends to rise, enabling investors and central banks to diversify their assets in turbulent times. Gold is also inversely correlated with risk assets. A rally in the stock market tends to weaken Gold price, while sell-offs in riskier markets tend to favor the precious metal.
The price can move due to a wide range of factors. Geopolitical instability or fears of a deep recession can quickly make Gold price escalate due to its safe-haven status. As a yield-less asset, Gold tends to rise with lower interest rates, while higher cost of money usually weighs down on the yellow metal. Still, most moves depend on how the US Dollar (USD) behaves as the asset is priced in dollars (XAU/USD). A strong Dollar tends to keep the price of Gold controlled, whereas a weaker Dollar is likely to push Gold prices up.

FXStreet
超过一百万用户依赖 FXStreet 获取实时市场数据、图表工具、专家洞见和外汇新闻。其全面的经济日历和教育网络研讨会帮助交易者保持信息领先、做出审慎决策。FXStreet 拥有约 60 人的团队,分布在巴塞罗那总部及全球各地区。
Read More


