
Trade The World
Gold Price Forecast: XAU/USD trades firmly around $3,370 as Fed’s Powell guides dovish outlook
作者 Sagar Dua
发布日期: 25 Aug 2025 | 修改日期: 25 Aug 2025


POPULAR ARTICLES

Gold price (XAU/USD) holds onto gains near Friday’s high around $3,370.00 during the European trading session on Monday.
- Gold price clings to gains near $3,370.00, driven by dovish remarks from Fed Chair Powell.
- Fed’s Powell warns of labor market risks at Jackson Hole Symposium.
- Gold price remained sticky to the 20-day EMA.
Gold price (XAU/USD) holds onto gains near Friday’s high around $3,370.00 during the European trading session on Monday. The precious metal trades firmly as Federal Reserve (Fed) Chair Jerome Powell has signaled that he is open to unwinding monetary policy restrictiveness in his speech at the Jackson Hole (JH) Symposium on Friday.
The adaptation of a dovish stance by Fed Chair Powell on the interest rate outlook surprised global markets as experts anticipated him to reiterate a “wait and see” approach on interest rates.
"Nonetheless, with policy in restrictive territory, the baseline outlook and the shifting balance of risks may warrant adjusting our policy stance," Powell said. He further added that the Fed could start reducing interest rates quickly if downside labor market risks start materializing.
Jerome Powell didn’t explicitly call for interest rate cuts in the September meeting, but traders are confident that the Fed will reduce interest rates in the policy meeting next month, according to the CME FedWatch tool.
Lower interest rates by the Fed bode well for non-yielding assets, such as Gold.
Fed Powell’s surprisingly dovish remarks have dampened yields on interest-bearing assets. 10-year US Treasury yields trade near Friday’s low around 4.27%. Meanwhile, the US Dollar Index (DXY), which tracks the Greenback’s value against six major currencies, rises to near 98.00. Still, the DXY is close to its almost four-week low, which is around 97.70.
Gold technical analysis
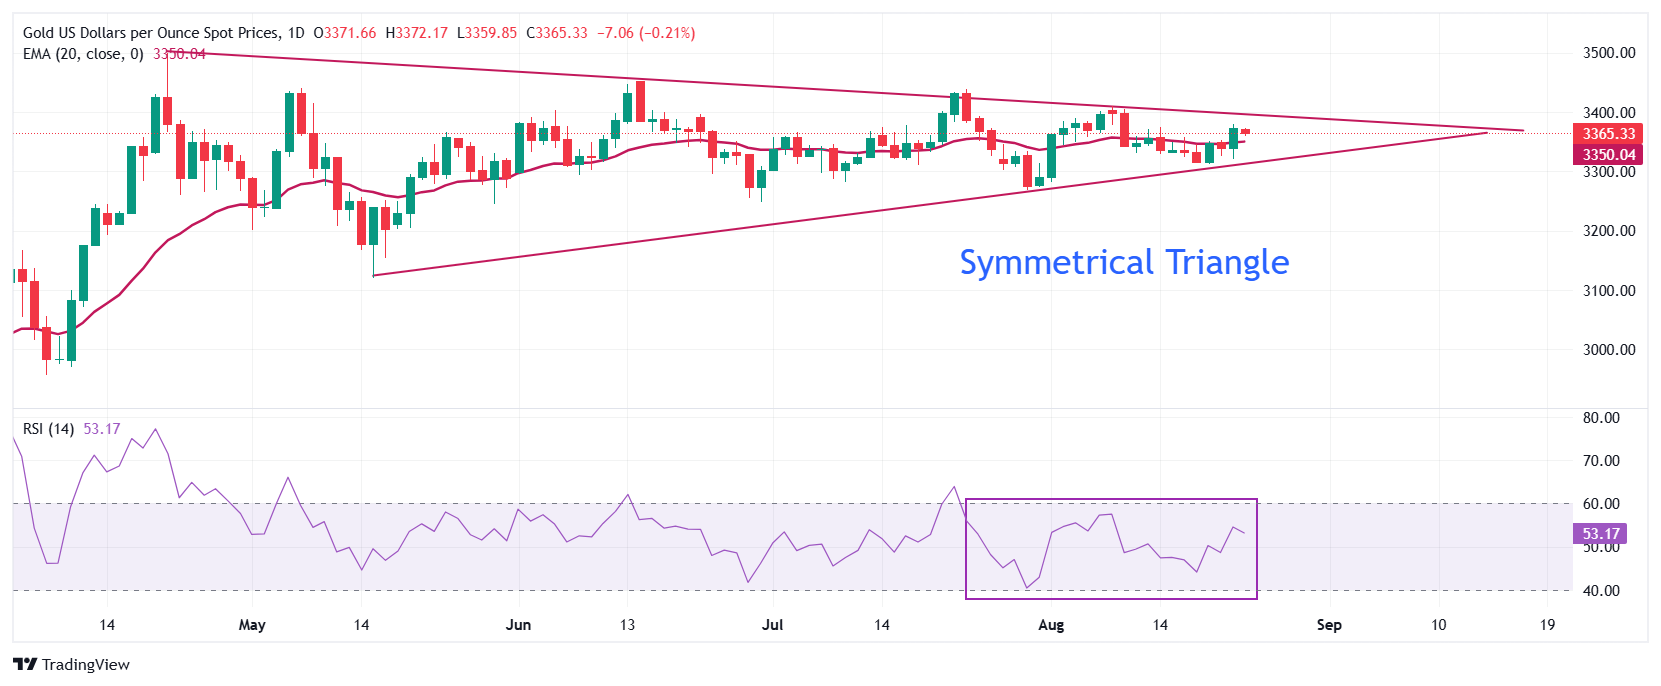
Gold price trades in a Symmetrical Triangle, which indicates a sharp volatility contraction. The upper border of the above-mentioned chart pattern is plotted from the April 22 high around $3,500, while the downward border is placed from the May 15 low near $3,180.86.
The yellow metal wobbles near the 20-day Exponential Moving Average (EMA) around $3,350.00, indicating a sideways trend.
The 14-day Relative Strength Index (RSI) oscillates inside the 40.00-60.00 range, suggesting indecisiveness among market participants.
Looking down, the Gold price would fall towards the round-level support of $3,200 and the May 15 low at $3,121, if it breaks below the May 29 low of $3,245.
Alternatively, the Gold price will enter an uncharted territory if it breaks above the psychological level of $3,500 decisively. Potential resistances would be $3,550 and $3,600.
Gold daily chart
Gold FAQs
Gold has played a key role in human’s history as it has been widely used as a store of value and medium of exchange. Currently, apart from its shine and usage for jewelry, the precious metal is widely seen as a safe-haven asset, meaning that it is considered a good investment during turbulent times. Gold is also widely seen as a hedge against inflation and against depreciating currencies as it doesn’t rely on any specific issuer or government.
Central banks are the biggest Gold holders. In their aim to support their currencies in turbulent times, central banks tend to diversify their reserves and buy Gold to improve the perceived strength of the economy and the currency. High Gold reserves can be a source of trust for a country’s solvency. Central banks added 1,136 tonnes of Gold worth around $70 billion to their reserves in 2022, according to data from the World Gold Council. This is the highest yearly purchase since records began. Central banks from emerging economies such as China, India and Turkey are quickly increasing their Gold reserves.
Gold has an inverse correlation with the US Dollar and US Treasuries, which are both major reserve and safe-haven assets. When the Dollar depreciates, Gold tends to rise, enabling investors and central banks to diversify their assets in turbulent times. Gold is also inversely correlated with risk assets. A rally in the stock market tends to weaken Gold price, while sell-offs in riskier markets tend to favor the precious metal.
The price can move due to a wide range of factors. Geopolitical instability or fears of a deep recession can quickly make Gold price escalate due to its safe-haven status. As a yield-less asset, Gold tends to rise with lower interest rates, while higher cost of money usually weighs down on the yellow metal. Still, most moves depend on how the US Dollar (USD) behaves as the asset is priced in dollars (XAU/USD). A strong Dollar tends to keep the price of Gold controlled, whereas a weaker Dollar is likely to push Gold prices up.

FXStreet
超过一百万用户依赖 FXStreet 获取实时市场数据、图表工具、专家洞见和外汇新闻。其全面的经济日历和教育网络研讨会帮助交易者保持信息领先、做出审慎决策。FXStreet 拥有约 60 人的团队,分布在巴塞罗那总部及全球各地区。
Read More


