
Hyperliquid Price Forecast: Bulls aim breakout as RSI and MACD flash buy signal
作者 Vishal Dixit
发布日期: 4 Dec 2025 | 修改日期: 4 Dec 2025


热门文章

Hyperliquid (HYPE) struggles to surface above $35 as a local resistance trendline caps the two-day recovery run. Hyperliquid Strategies Inc. (PURR) transfered 12 million HYPE tokens to Hypercore and staked 425,000 tokens, which reflects confidence.
- Hyperliquid faces opposition above $35 from a key resistance trendline, with bulls aiming for a breakout rally.
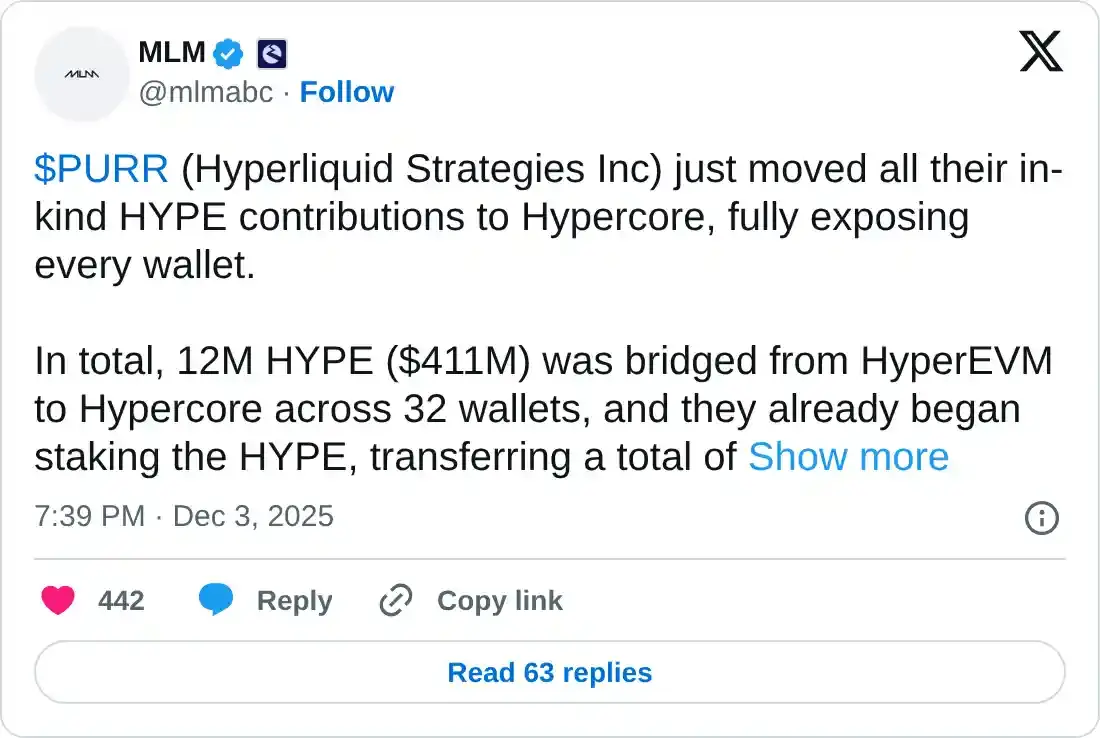
- Hyperliquid Strategies Inc. transfers 12 million HYPE tokens to Hypercore from HyperEVM, initiating staking.
- The technical outlook indicates a bullish bias as momentum indicators flash a buy signal.
Hyperliquid (HYPE) struggles to surface above $35 as a local resistance trendline caps the two-day recovery run. Hyperliquid Strategies Inc. (PURR) transfered 12 million HYPE tokens to Hypercore and staked 425,000 tokens, which reflects confidence. The technical outlook for HYPE is optimistic as momentum indicators flash a buy signal and a bias towards the trendline breakout.
Hyperliquid Strategies Inc. begins the HYPE staking process
Hyperliquid Strategies Inc. (PURR), a Nasdaq-listed company formed by the merger of Sonnet BioTherapeutics Holdings, Inc. and Rorschach I LLC on Tuesday, holds 12 million HYPE tokens (1.20% of the total supply) and $300 million in cash. According to MLM on-chain, these 12 million HYPE tokens were transferred to Hypercore from HyperEVM across 32 wallets on Wednesday, exposing their entire holdings.
PURR staked 425,000 HYPE tokens on the Anchorage node by Figment, which reflects the growing confidence in the perpetuals exchange token.
Hyperliquid targets $35 breakout amid buy signals
Hyperliquid trades at $34.65 by press time on Thursday, retracing from the high of $36.17 earlier on the day. The HYPE token faces opposition from the local resistance trendline formed by connecting the highs of October 30 and November 18, near the $35.51 mark.
Corroborating the bullish thesis, the Relative Strength Index (RSI) at 46 remains largely neutral but flashes a divergence between November 22 and December 1 lows on the daily chart. This divergence reflects an underlying increase in bullish pressure that could bolster momentum.
Additionally, the Moving Average Convergence Divergence (MACD) extends upward after a crossover above the signal line on Wednesday, which triggered a fresh wave of green histogram bars above the zero line. This indicates an increase in fresh bullish momentum.
If HYPE holds a decisive daily close above $35.51, the uptrend could aim for the $40.00 round figure.
However, the prevailing declining trend risks a Death Cross pattern as the 50-day and 200-day Exponential Moving Averages (EMAs) converge. In case of a crossover, the EMAs would flash a sell signal as short-term bears tighten their grip on the long-term trend.
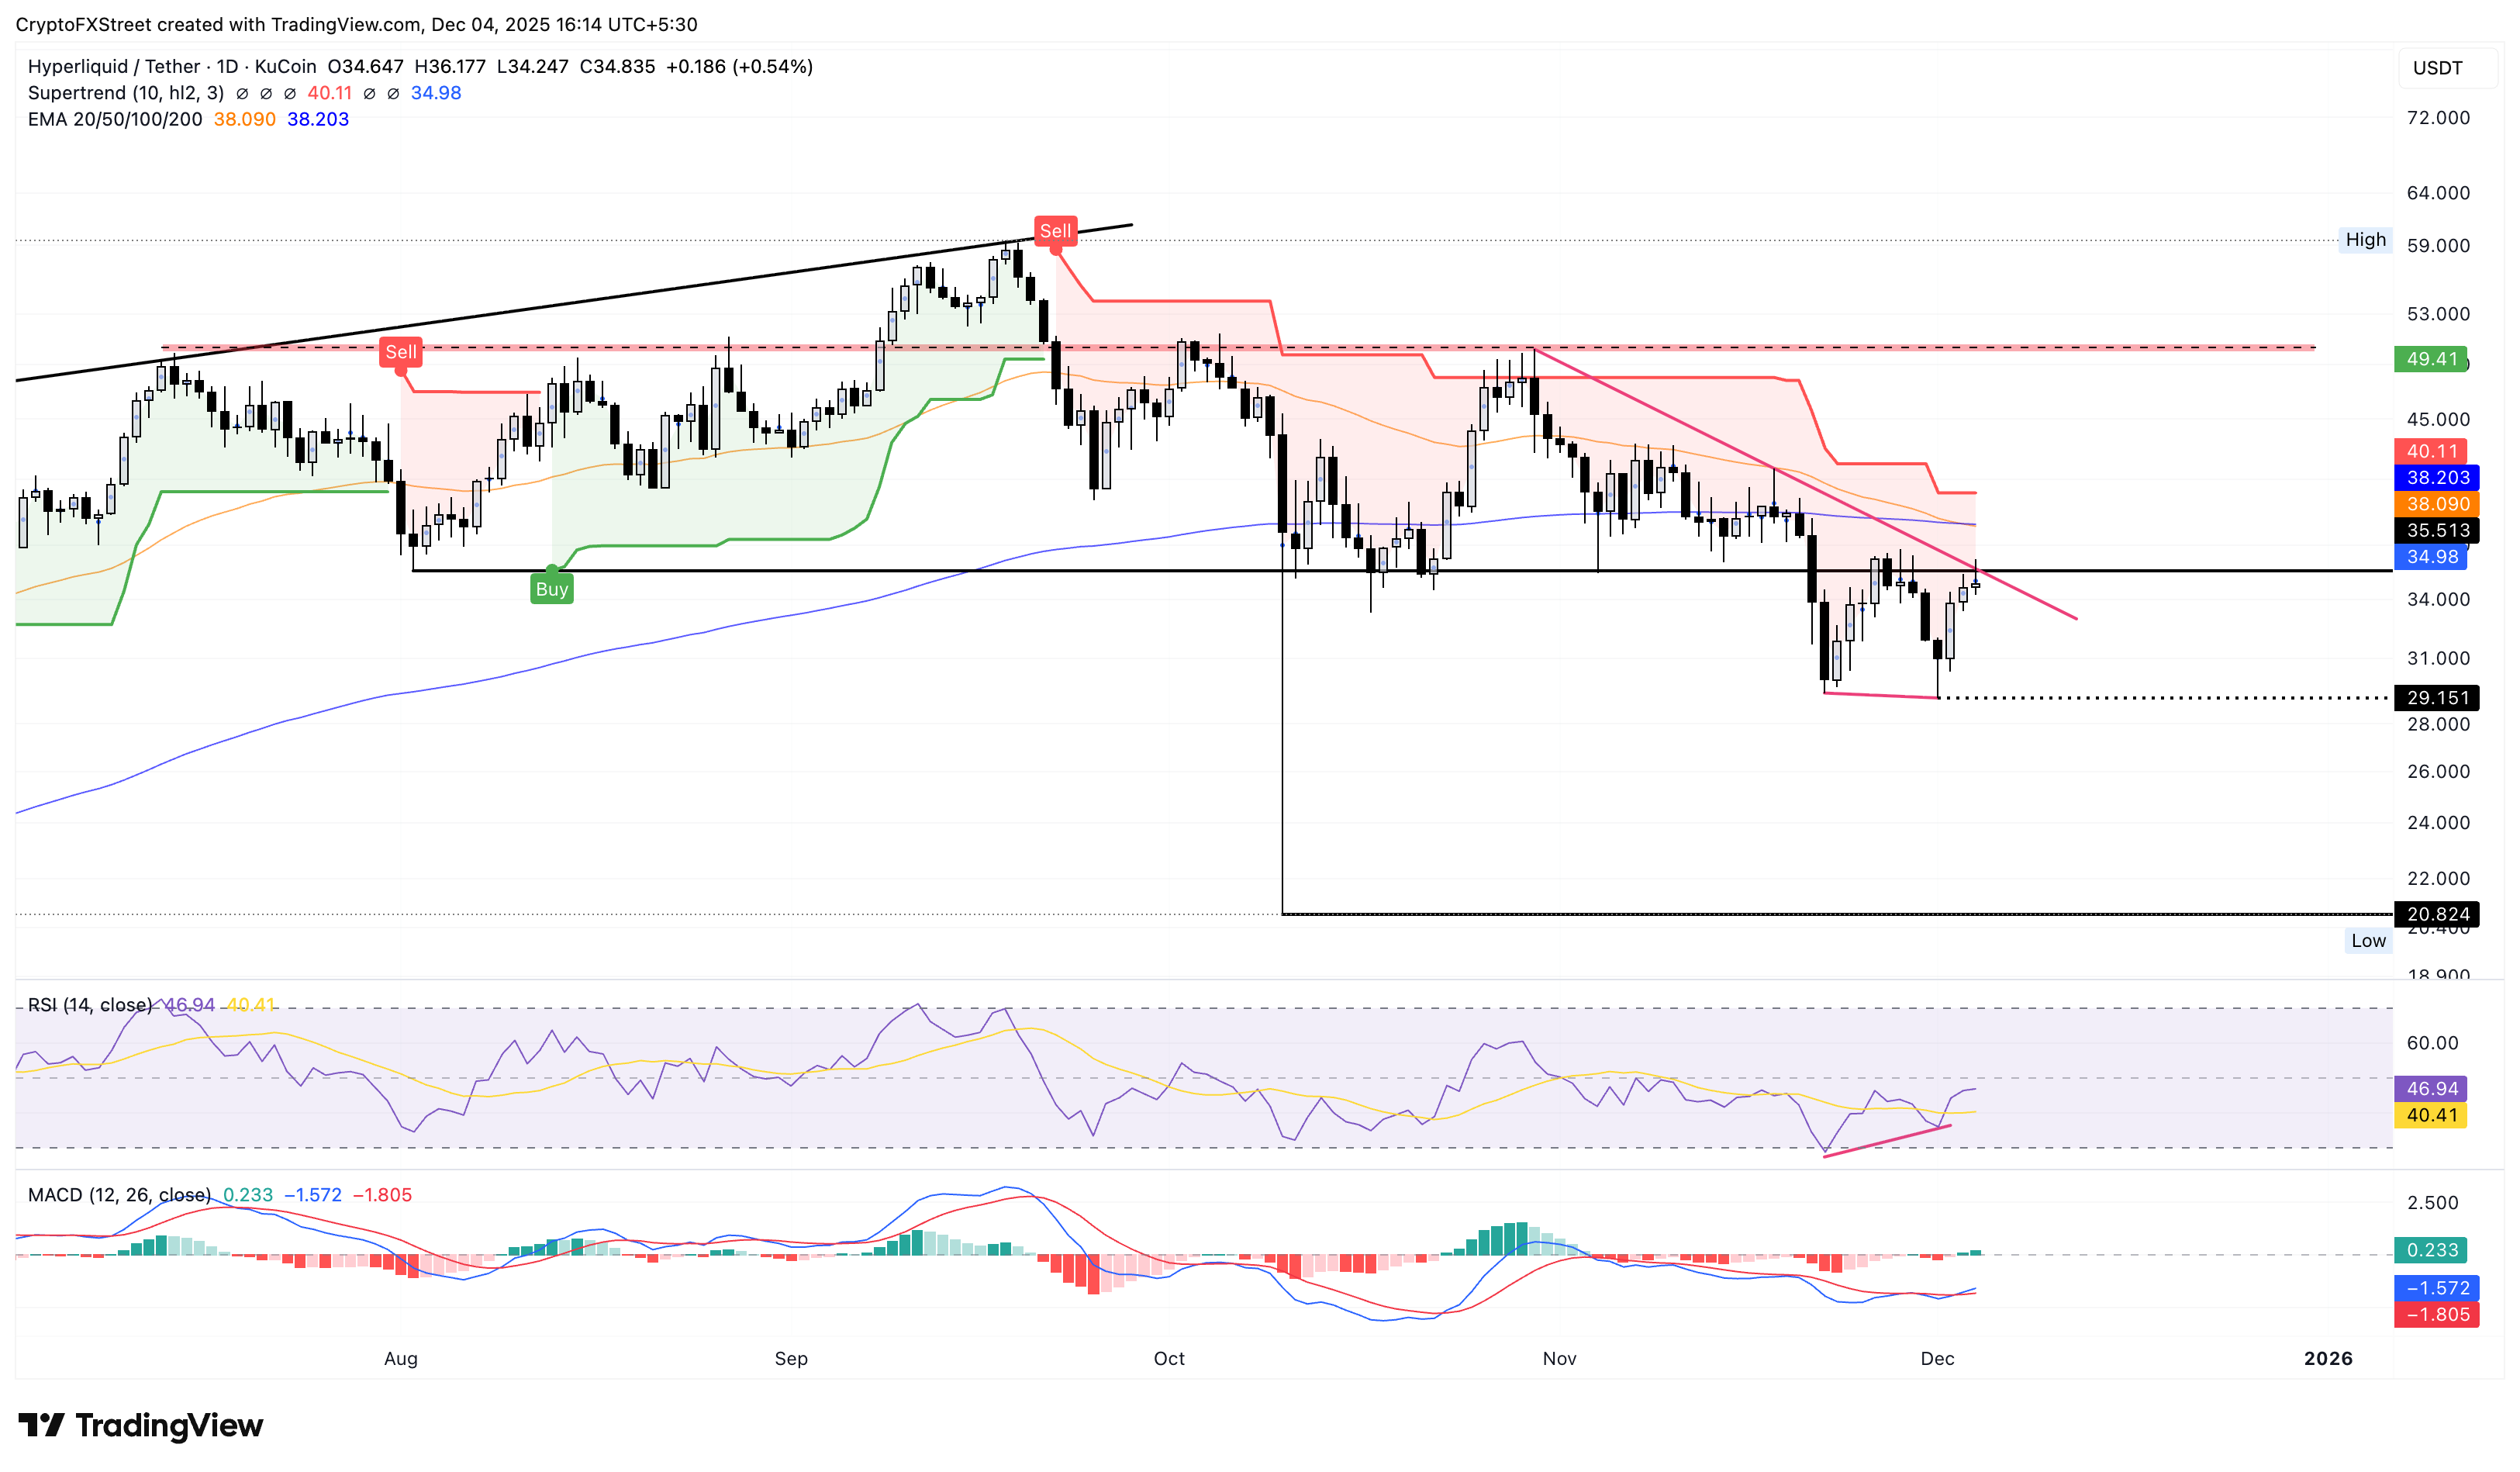
In case of a reversal from the trendline, HYPE could retest the December 1 low at $29.15 while increasing the chances of the Death Cross pattern occurring.

超过一百万用户依赖 FXStreet 获取实时市场数据、图表工具、专家洞见和外汇新闻。其全面的经济日历和教育网络研讨会帮助交易者保持信息领先、做出审慎决策。FXStreet 拥有约 60 人的团队,分布在巴塞罗那总部及全球各地区。
阅读更多


