
Trade The World
Hyperliquid Price Forecast: HYPE shows signs of recovery as whale activity rises and funding rates turn positive
作者 Manish Chhetri
发布日期: 5 Nov 2025 | 修改日期: 5 Nov 2025


POPULAR ARTICLES

Hyperliquid (HYPE) price is showing early signs of stabilization, trading around $40 at the time of writing on Wednesday after a sharp correction earlier in the week.
- Hyperliquid rebounds slightly on Wednesday, finding support near a crucial level following a sharp correction.
- On-chain and derivatives data indicate early signs of recovery, with retail activity low, large whale orders up, and funding rates flipping positive.
- The technical outlook suggests a potential rebound, aiming for the$51.15 mark.
Hyperliquid (HYPE) price is showing early signs of stabilization, trading around $40 at the time of writing on Wednesday after a sharp correction earlier in the week. On-chain and derivatives data indicate improving market conditions, with rising whale activity and positive funding rates suggesting growing confidence among large holders. On the technical side, suggest a potential rebound, aiming for the $51.15 mark.
HYPE’s on-chain and derivatives data show early signs of recovery
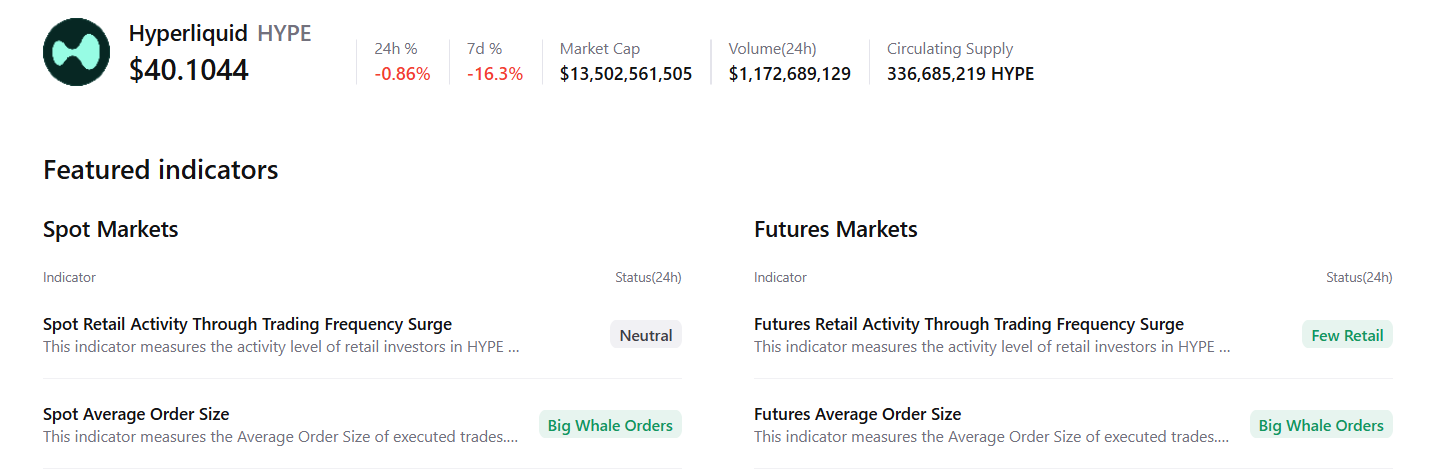
CryptoQuant’s summary data supports the positive outlook, as HYPE’s spot and futures markets show large whale orders and less retail activity, signaling a potential recovery ahead.
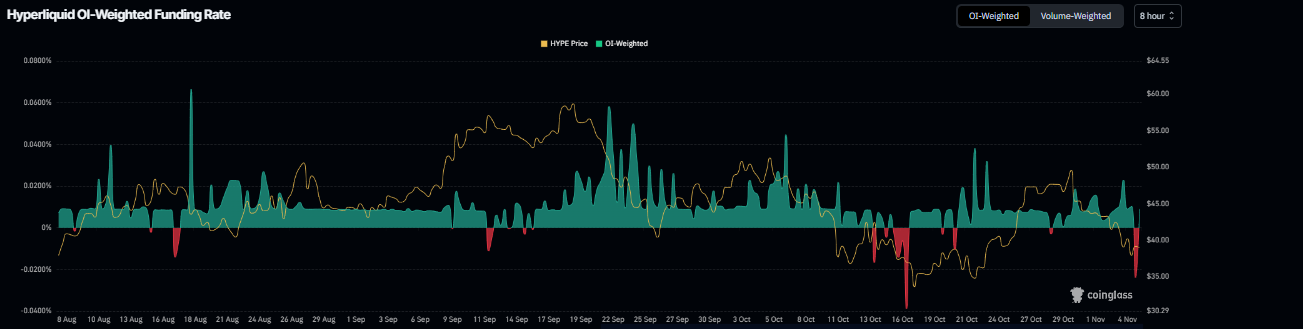
Apart from whale accumulation, derivatives data also support a recovery rally for Hyperliquid. Coinglass’s OI-Weighted Funding Rate data shows that the number of traders betting that the price of HYPE will slide further is lower than those anticipating a price increase.
The metric has flipped to a positive rate, standing at 0.0090% on Wednesday, indicating that longs are paying shorts. Historically, as shown in the chart below, when the funding rates have flipped from negative to positive, Hyperliquid’s price has rallied sharply.
Hyperliquid Price Forecast: HYPE finds support around a key level
Hyperliquid price faced rejection around the daily resistance level at $51.15 on October 30 and declined 19% in the next six days, retesting the daily support level at $36.51 on Tuesday. This daily level at $36.51 roughly coincides with the 200-day Exponential Moving Average (EMA) at $38.69 and the previously broken descending trendline, making it a key support zone to watch. At the time of writing on Wednesday, HYPE trades slightly above $40.
If HYPE continues its recovery, it could extend the rally toward the daily resistance level at $51.15.
The Relative Strength Index (RSI) on the daily chart reads 45, pointing upward toward the neutral level of 50, indicating early signs of fading bearish momentum. However, for the recovery rally to be sustained, the RSI must move above the neutral level.
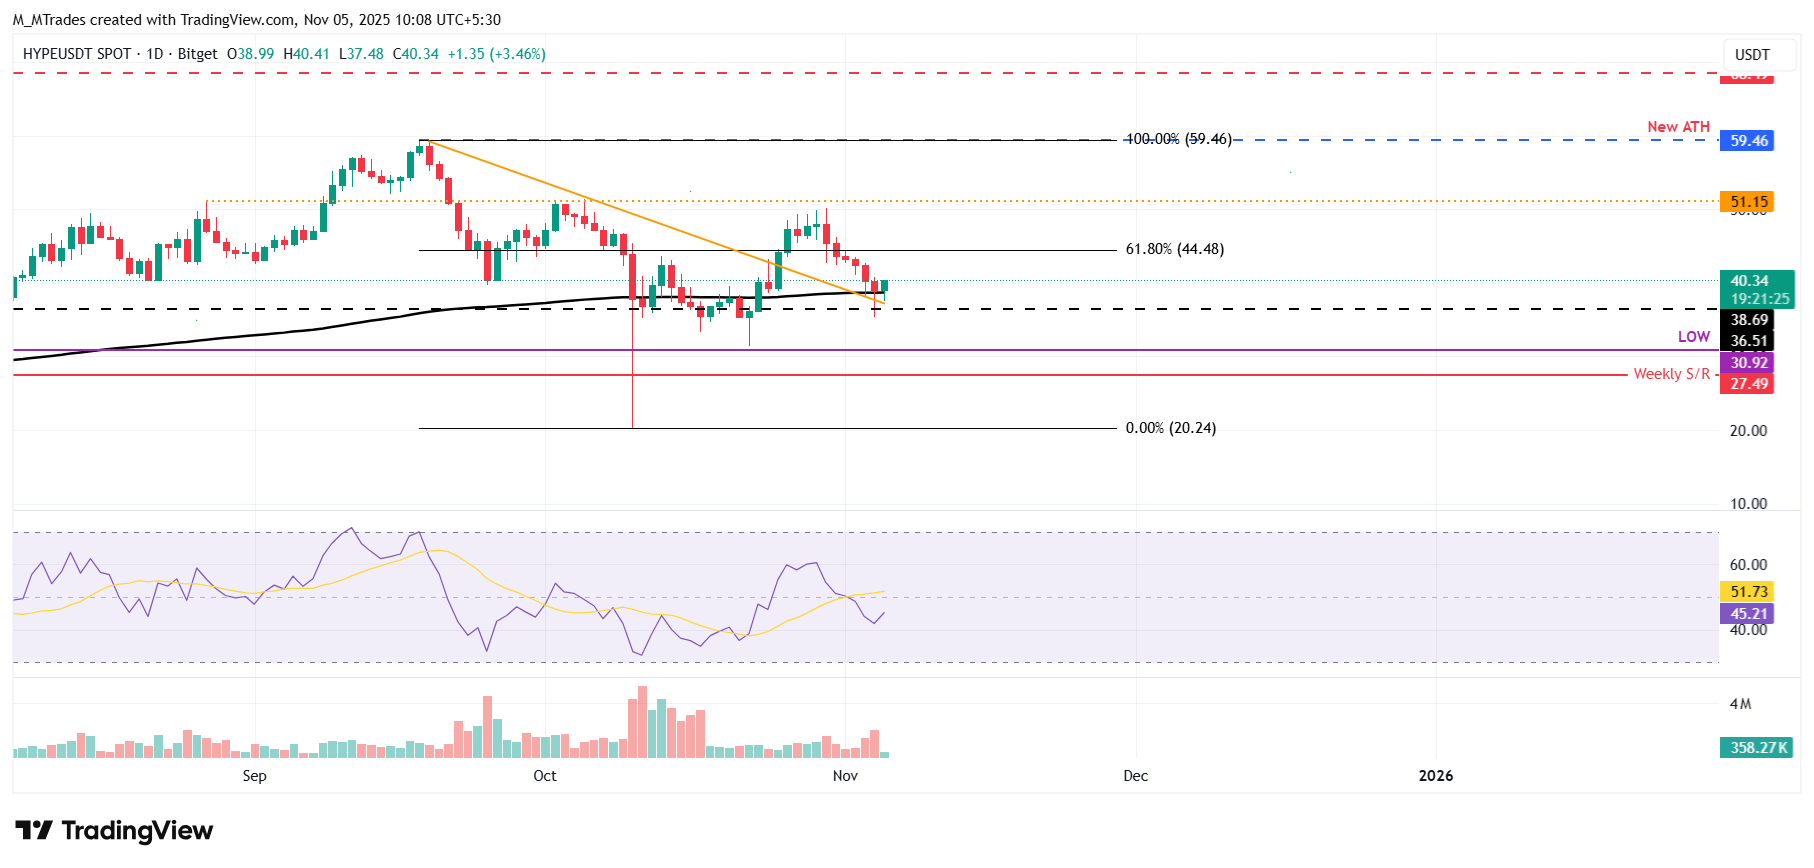
However, if HYPE faces a correction and closes below $36.51 daily support, it could extend the decline toward the next support level at $30.92.

FXStreet
超过一百万用户依赖 FXStreet 获取实时市场数据、图表工具、专家洞见和外汇新闻。其全面的经济日历和教育网络研讨会帮助交易者保持信息领先、做出审慎决策。FXStreet 拥有约 60 人的团队,分布在巴塞罗那总部及全球各地区。
Read More


