
Trade The World
Litecoin Price Forecast: LTC rally extends with bulls eyeing $130
作者 Manish Chhetri
发布日期: 2 Oct 2025 | 修改日期: 2 Oct 2025


POPULAR ARTICLES

Litecoin (LTC) price continues to climb, trading above $118 on Thursday, extending gains of over 10% so far this week. The bullish momentum is further supported by rising Open Interest (OI) and trading volume in the LTC token.
- Litecoin price extends its gains on Thursday after rallying more than 10% so far this week.
- On-chain and derivatives data indicate a bullish outlook, as trading volume and open interest for LTC are on the rise.
- The technical outlook suggests a rally continuation, with bulls targeting $130.
Litecoin (LTC) price continues to climb, trading above $118 on Thursday, extending gains of over 10% so far this week. The bullish momentum is further supported by rising Open Interest (OI) and trading volume in the LTC token. Meanwhile, technical analysis suggests an upward leg targeting levels above $130.
On-chain data and derivatives show bullish bias for LTC
CoinGlass’s data show that the futures’ OI in Litecoin at exchanges rose from $797 million on Tuesday to $955 million on Thursday, the highest level since September 20. An increasing OI represents new or additional money entering the market and new buying, which could fuel the current Litecoin price rally.
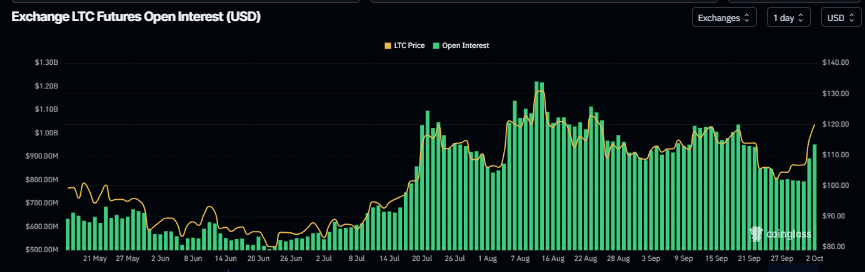
Litecoin open interest chart. Source: Coinglass
Another aspect bolstering the platform’s bullish outlook is a recent surge in traders’ interest and liquidity in Litecoin. Santiment data shows that LTC’s trading volume rose from $286.70 million on Tuesday to $1.05 billion on Thursday, the highest since August 15.
 [07-1759376072813-1759376072815.51.58, 02 Oct, 2025].png)
LTC trading volume chart. Source: Santiment
Litecoin Price Forecast: LTC bulls aiming for $130 mark
Litecoin price found support around the 200-day Exponential Moving Average (EMA) at $103.61 on September 25 and rose 12.5% by Wednesday. This level roughly coincides with multiple support levels, such as the volume profile POC (Point of Control) is at $102.62, the price level with the highest traded volume since November 2024, the 50% retracement level is at $98.68, and the ascending trendline (drawn by connecting multiple lows since early April), making this a key support zone. At the time of writing on Thursday, LTC continues to trade higher above $118.
If LTC continues its upward momentum, it could extend the rally toward the next resistance at $130.
The Relative Strength on the daily chart reads 61, above the neutral level of 50, indicating bullish momentum. The Moving Average Convergence Divergence (MACD) showed a bullish crossover on Wednesday, signaling a potential buy opportunity and indicating the possible start of an upward trend.
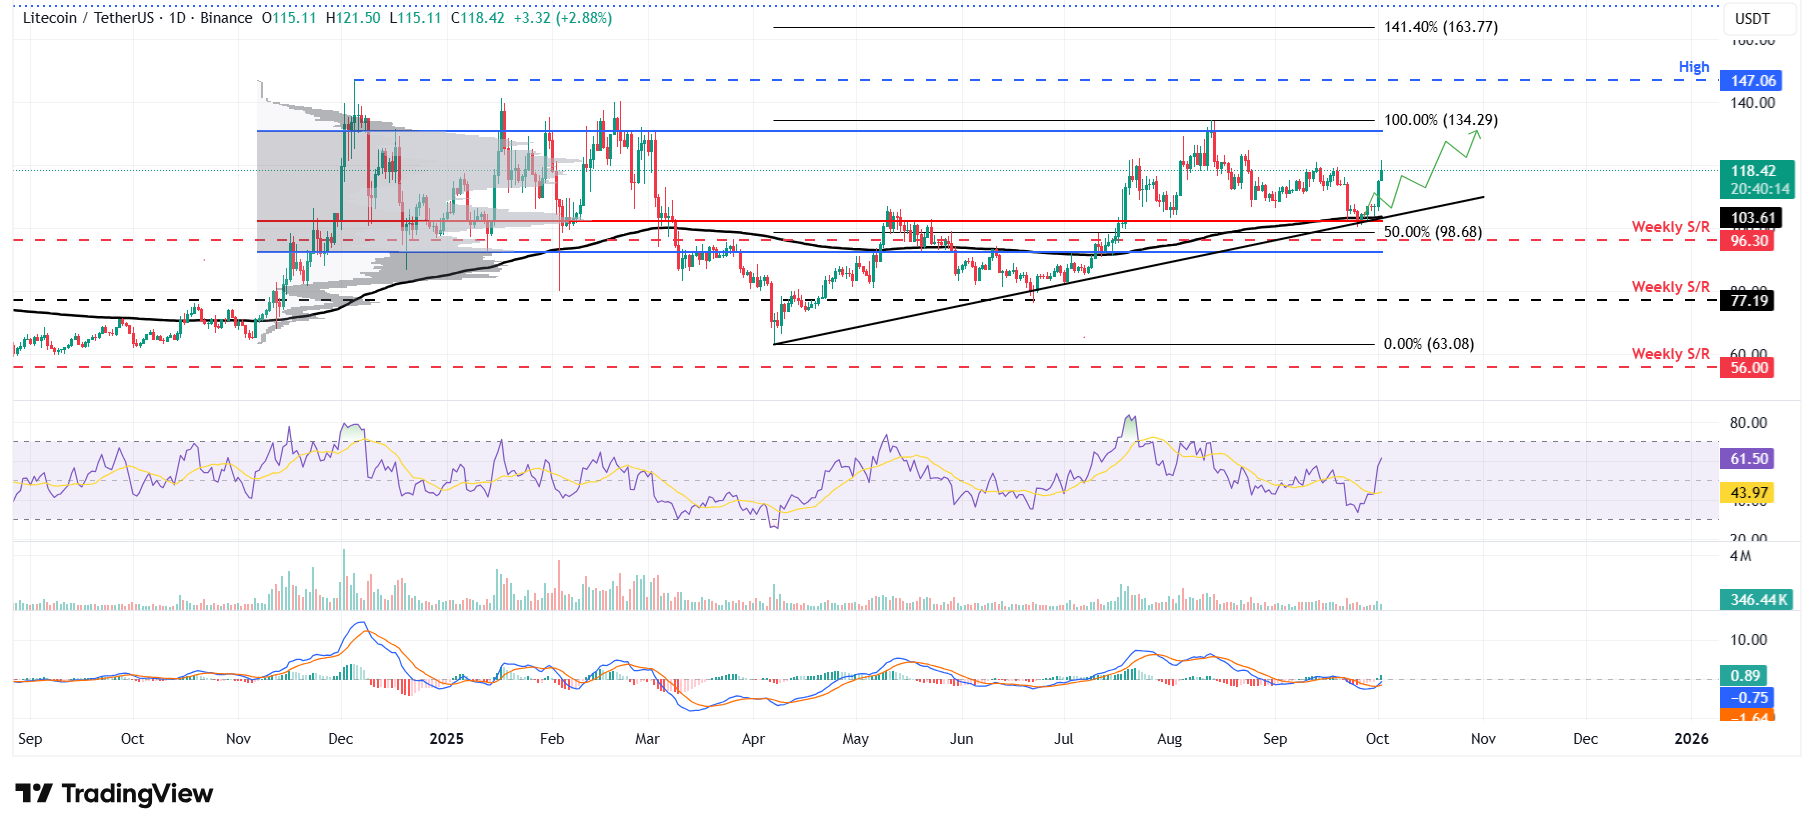
LTC/USDT daily chart
However, if LTC faces a correction, it could extend the decline toward the 200-day EMA at $103.61.

FXStreet
超过一百万用户依赖 FXStreet 获取实时市场数据、图表工具、专家洞见和外汇新闻。其全面的经济日历和教育网络研讨会帮助交易者保持信息领先、做出审慎决策。FXStreet 拥有约 60 人的团队,分布在巴塞罗那总部及全球各地区。
Read More


