
Trade The World
Meme coins retreat as Dogecoin, Shiba Inu, and Pepe face renewed bearish pressure
作者 Vishal Dixit
发布日期: 9 Oct 2025 | 修改日期: 9 Oct 2025


POPULAR ARTICLES

Meme coins, such as Dogecoin (DOGE), Shiba Inu (SHIB), and Pepe (PEPE), are losing ground as the broader cryptocurrency market faces selling pressure. Dogecoin risks further losses within a symmetrical triangle pattern while Shiba Inu and Pepe approach a key support level.
- Dogecoin reverses within a symmetrical triangle pattern on the 4-hour chart.
- Shiba Inu nears a key support level as bearish momentum resurfaces.
- Pepe drops below the $0.00001000 psychological level as retail interest declines.
Meme coins, such as Dogecoin (DOGE), Shiba Inu (SHIB), and Pepe (PEPE), are losing ground as the broader cryptocurrency market faces selling pressure. Dogecoin risks further losses within a symmetrical triangle pattern while Shiba Inu and Pepe approach a key support level.
Retail interest in meme coins splits
The broader cryptocurrency market sentiment directly dictates the demand for meme coins, bolstering their speculative nature. The retail interest for DOGE and SHIB remains steady while PEPE struggles to keep up.
CoinGlass data shows that the DOGE and SHIB Futures Open Interest (OI) have increased by 2% in the last 24 hours, reaching $4.43 billion and $193.05 million, respectively. An increase in Futures OI refers to a risk-on sentiment among traders, building up long positions.
At the same time, PEPE Futures OI is down 5.91% to $558.66 million, suggesting that traders are closing long positions.

Meme coins derivatives data. Source: CoinGlass
Dogecoin risks further decline below the 200-period EMA
Dogecoin is down over 2% at the time of writing on Thursday, nearly erasing the 3.57% gains from the previous day, which would extend the declining trend. DOGE approaches the 200-period Exponential Moving Average (EMA) at $0.24593 on the 4-hour chart.
If DOGE falls below this dynamic support, the local ascending trendline at $0.23800 and the S1 Pivot Point level at $0.23098 could act as key support levels.
The technical indicators on the 4-hour chart indicate a bearish shift as the Relative Strength Index (RSI) at 43 dips below the halfway line. Additionally, the Moving Average Convergence Divergence (MACD) crosses below the zero line with its signal line, indicating heightened bearish momentum.
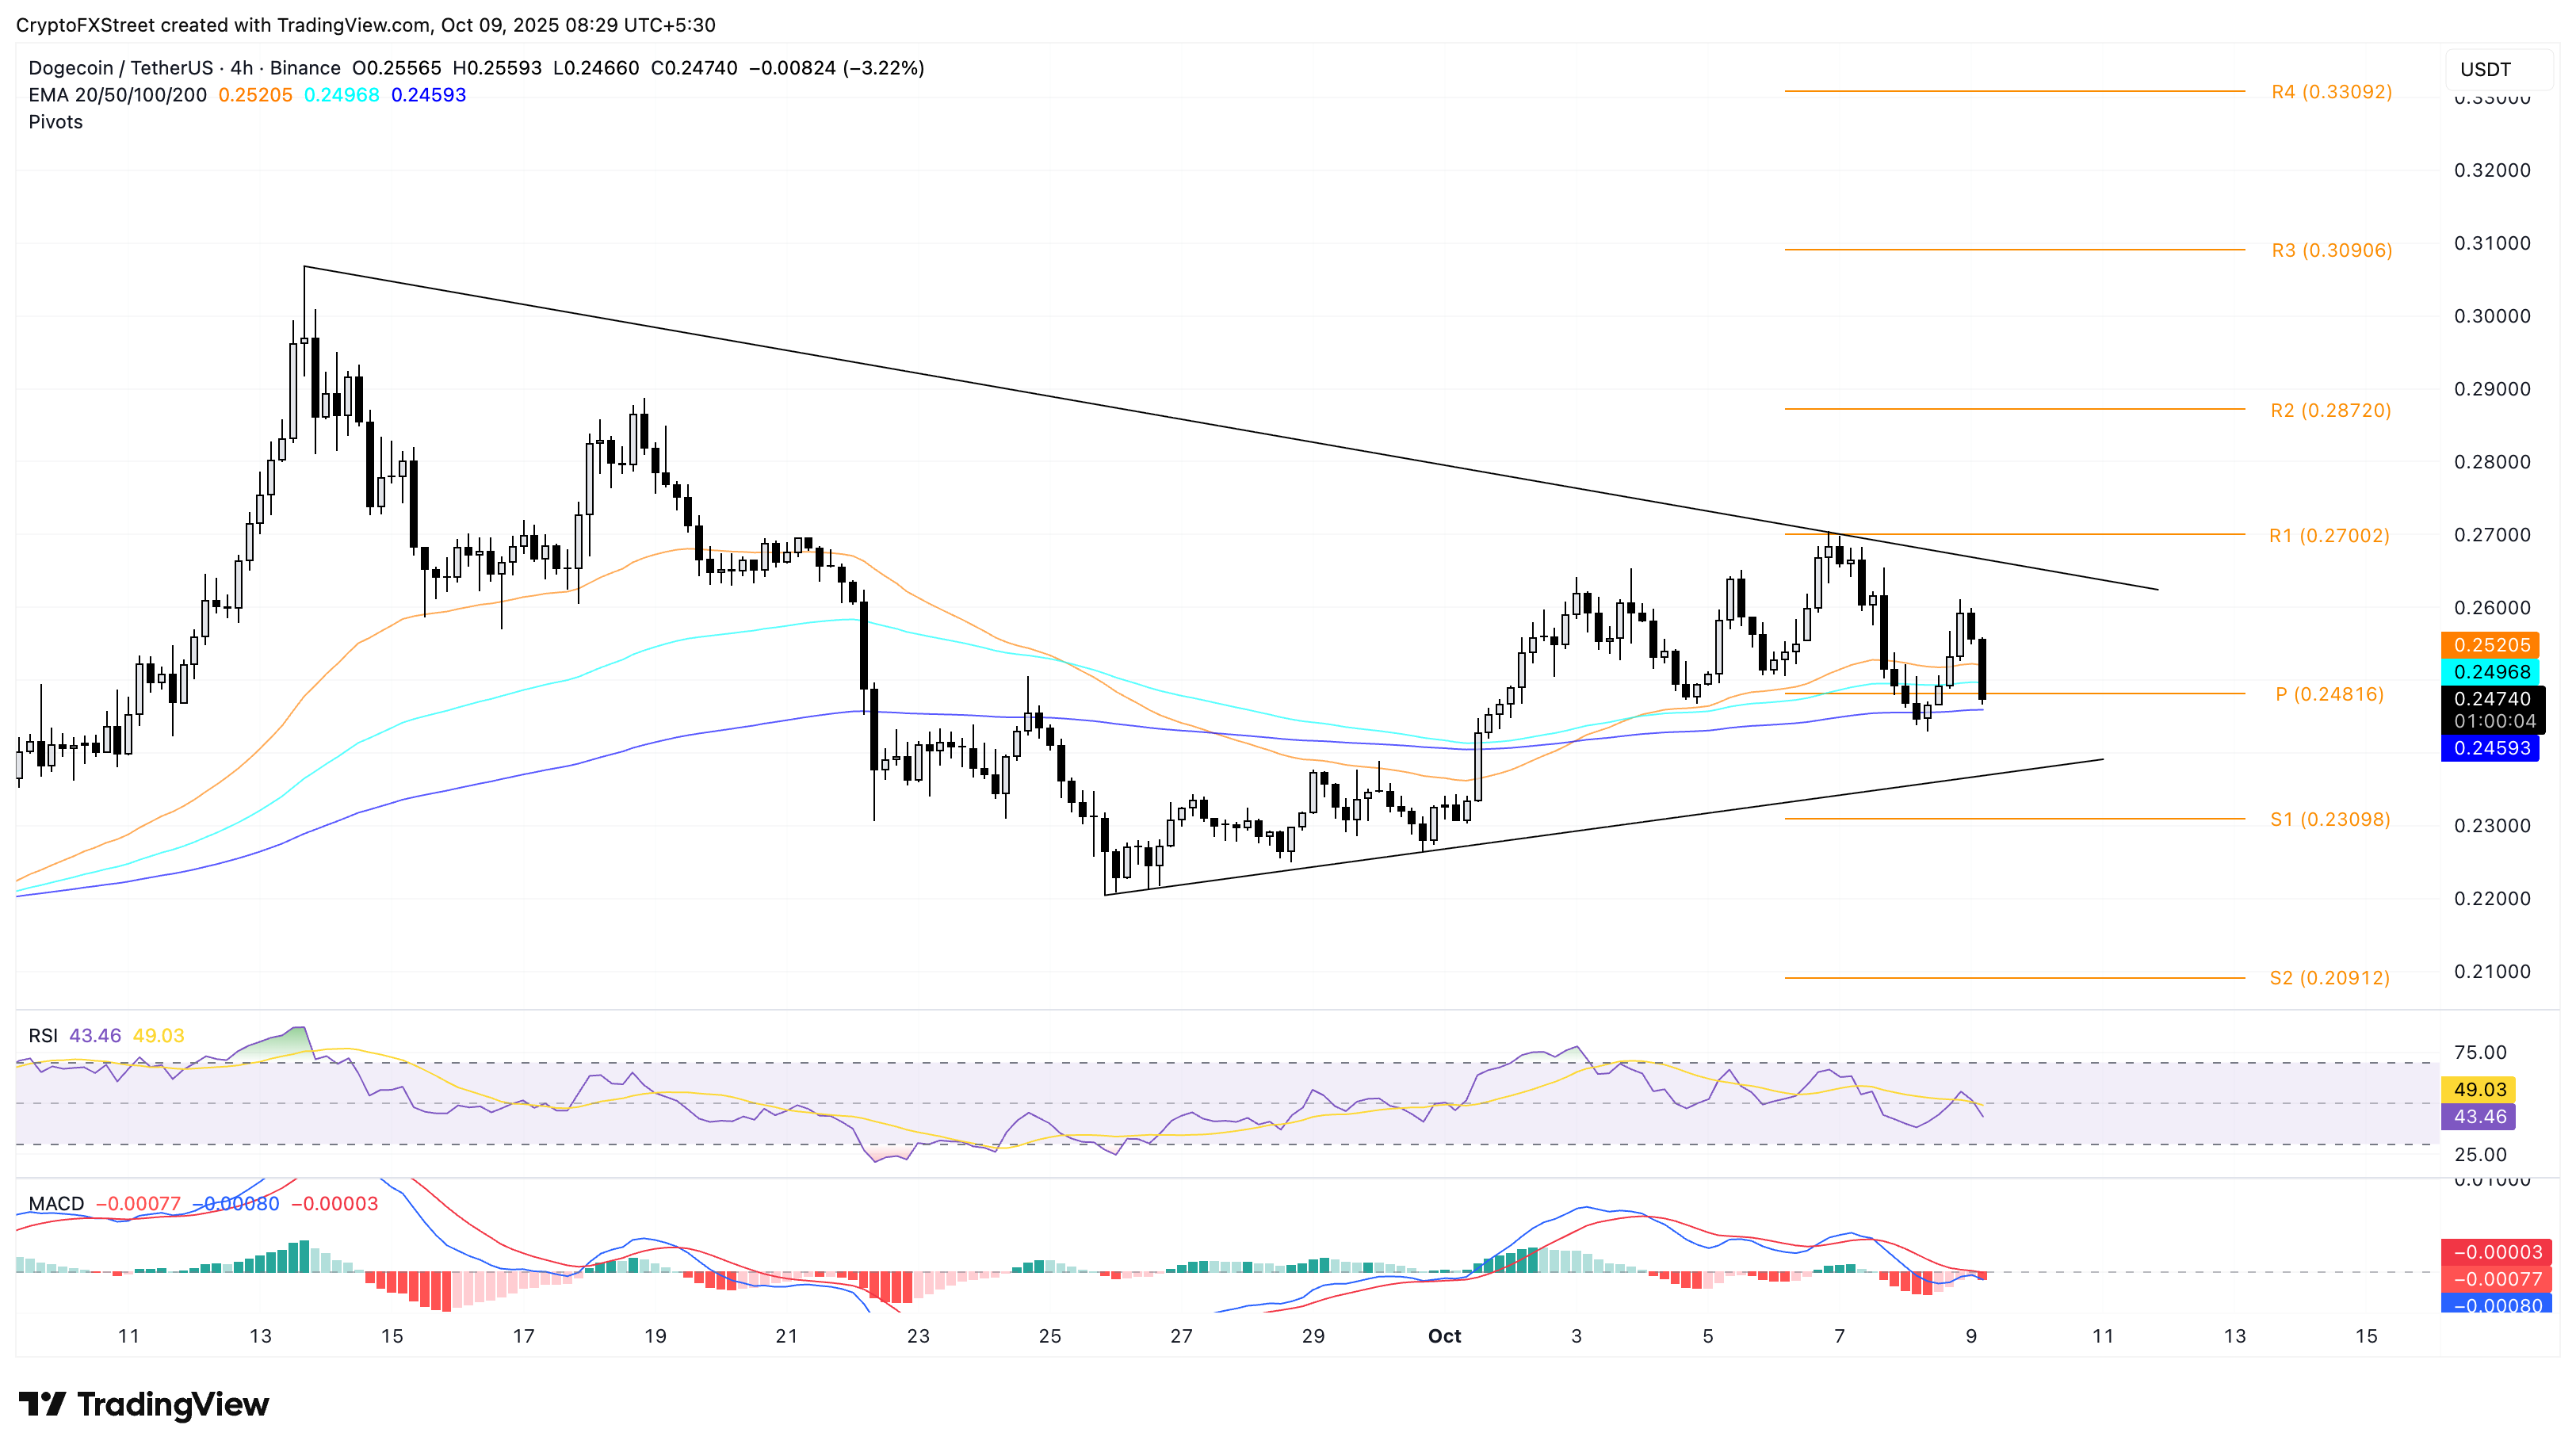
DOGE/USDT 4-hour price chart.
Looking up, a bounce back from the 200-period EMA could test the resistance at $0.26600, which completes a symmetrical triangle pattern with the ascending triangle pattern.
Shiba Inu holds at a crucial support level
Shiba Inu retraces to the $0.00001202 support level on the 4-hour chart, struggling to sustain above the 200-period EMA at $0.00001250. The declining trend of the 50-, 100-, and 200-period EMAs on the same chart indicates a prevailing downtrend.
A clean push below the $0.00001202 level could extend the decline to the $0.00001148 low from September 25.
The RSI is at 41 on the 4-hour chart, reversing from the halfway line, suggesting a rise in selling pressure. Still, compared to the previous $0.00001202 retest, RSI remains higher, indicating a bullish divergence, which flashes the possibility of a bounce back.
However, MACD maintains a downward trend with its signal line indicating that the bearish momentum is on the rise.
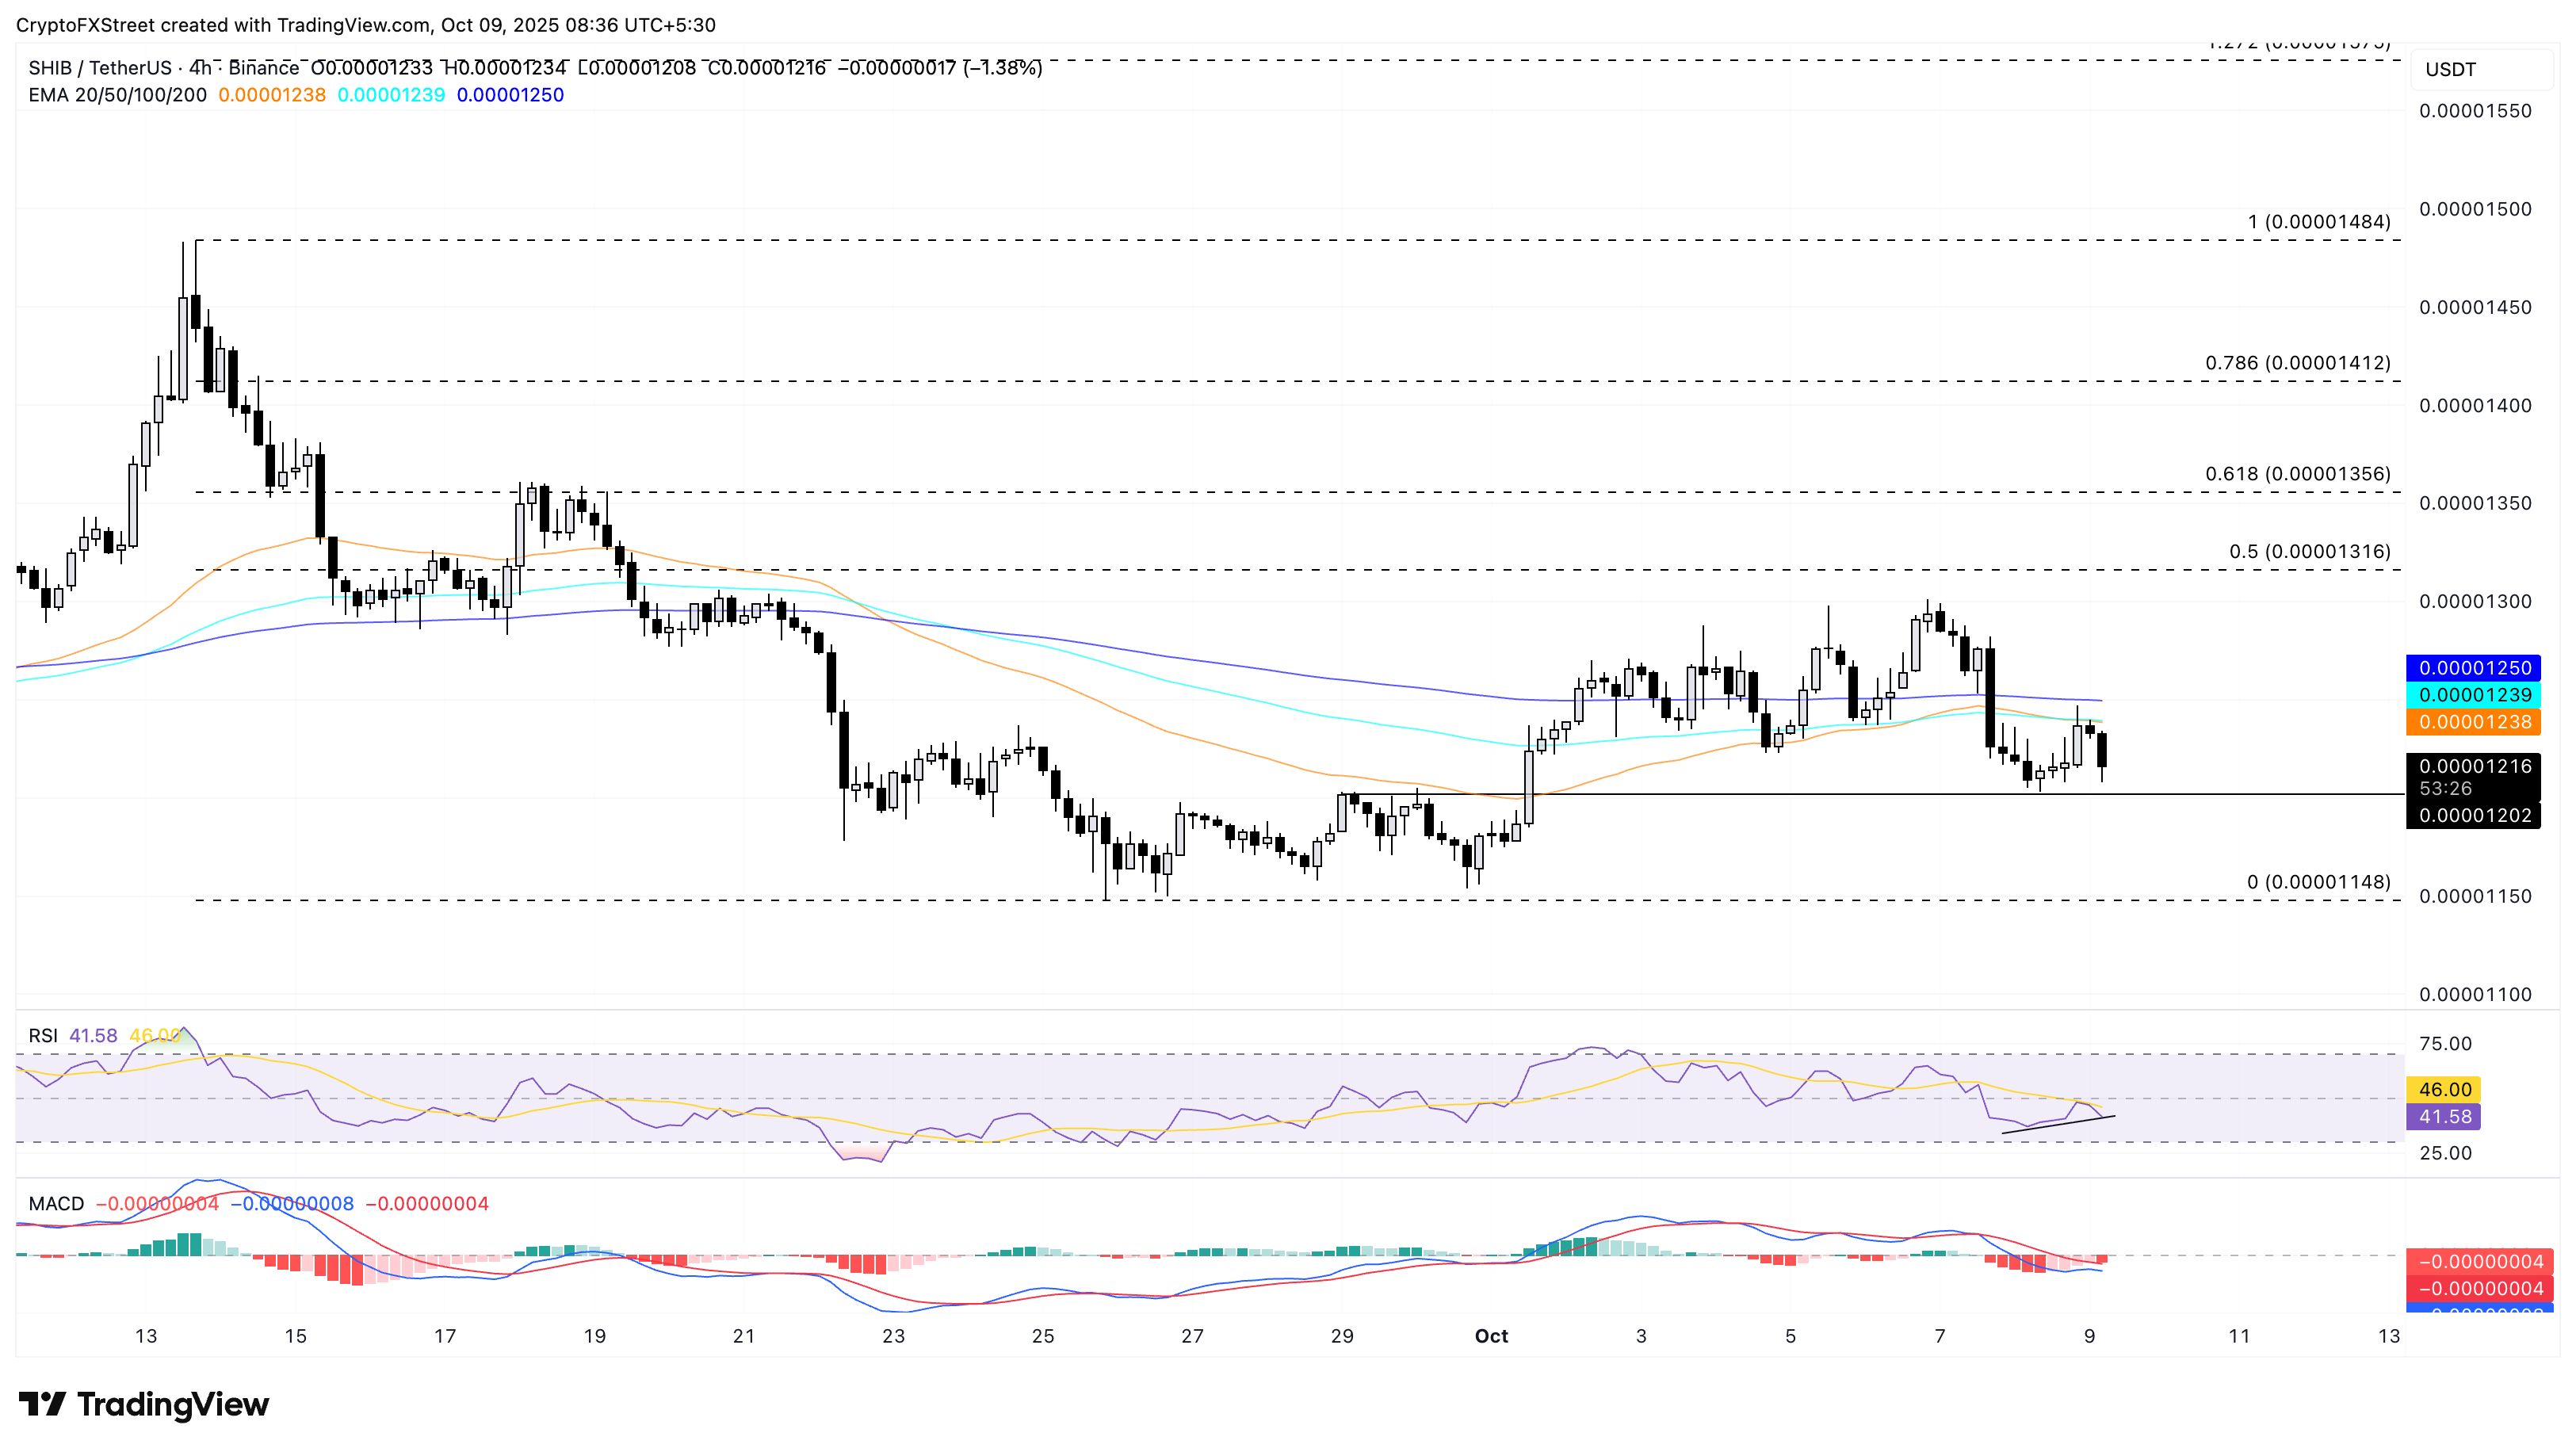
SHIB/USDT 4-hour price chart.
A potential reversal above the 200-period EMA at $0.00001250 could aim for the 50% retracement level at $0.00001316, drawn from the September 13 high of $0.00001484 to the September 25 low of $0.00001148.
Pepe loses bullish momentum
Pepe reverses from the 50-day EMA at $0.00001019, failing to hold above the psychological mark. The frog-themed meme coin reversal approaches the $0.00000887 support floor, marked by the June 22 close.
The close proximity of the 50-, 100-, and 200-day EMAs at $0.00001019, $0.00001050, and $0.00001077, respectively, acts as a dynamic resistance to PEPE’s recovery attempts. Beyond these, the declining trendline formed by connecting the highs of May 23 and September 13, at $0.00001175, could act as a resistance.
The momentum indicators signal a decline in bullish momentum as the RSI at 42 descends towards the oversold zone with room for further correction. At the same time, the declining MACD converges with its signal line, potentially indicating a bearish trend reversal.
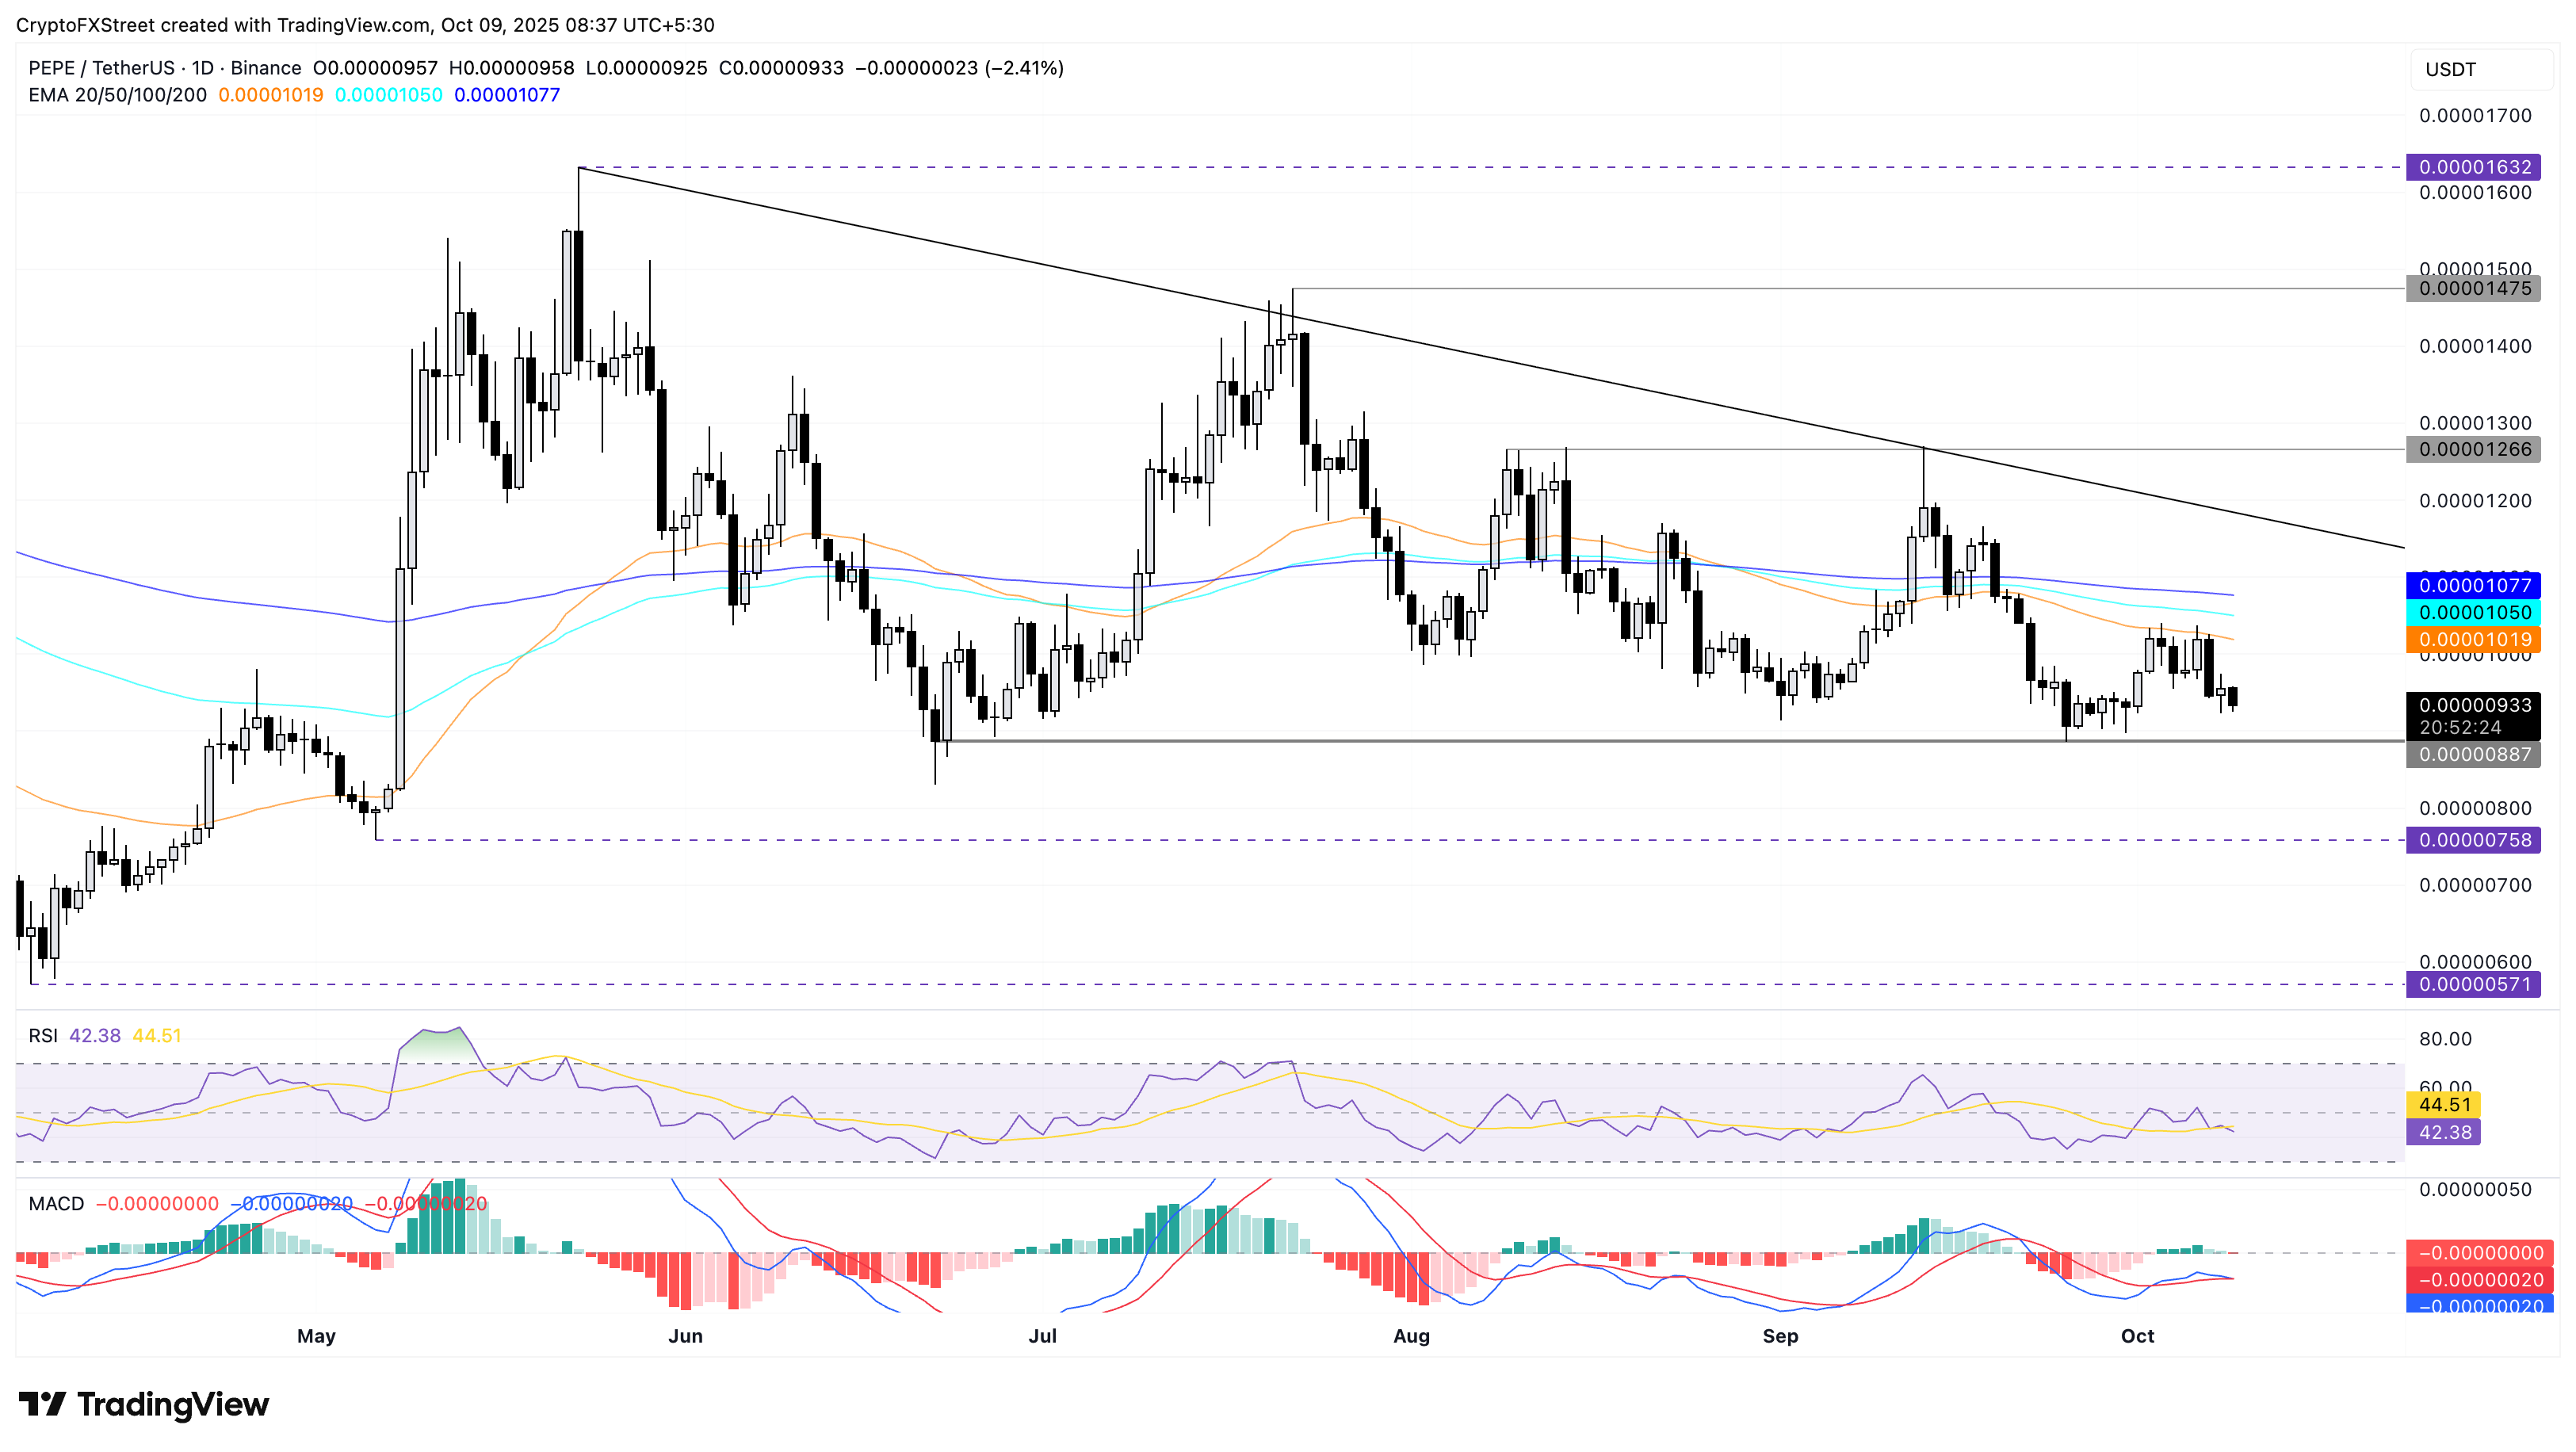
PEPE/USDT daily price chart.
On the other hand, if PEPE falls below the $0.00000887 level, it could extend the decline to $0.00000758, as marked by the May 6 low.

FXStreet
超过一百万用户依赖 FXStreet 获取实时市场数据、图表工具、专家洞见和外汇新闻。其全面的经济日历和教育网络研讨会帮助交易者保持信息领先、做出审慎决策。FXStreet 拥有约 60 人的团队,分布在巴塞罗那总部及全球各地区。
Read More


