
Trade The World
NZD/USD Price Forecast: Extends dovish RBNZ-inspired fall below mid-0.5700s, six-month low
作者 Haresh Menghani
发布日期: 8 Oct 2025 | 修改日期: 8 Oct 2025


POPULAR ARTICLES

The NZD/USD pair extends the previous day's sharp retracement slide from levels just above mid-0.5800s, or a nearly two-week high, and attracts heavy selling for the second straight day on Wednesday.
- NZD/USD attracts heavy selling for the second straight day in reaction to the dovish RBNZ.
- The USD climbs to its highest level since late August and also exerts pressure on the pair.
- The overnight failure near the 200-day SMA and the subsequent fall favor bearish traders.
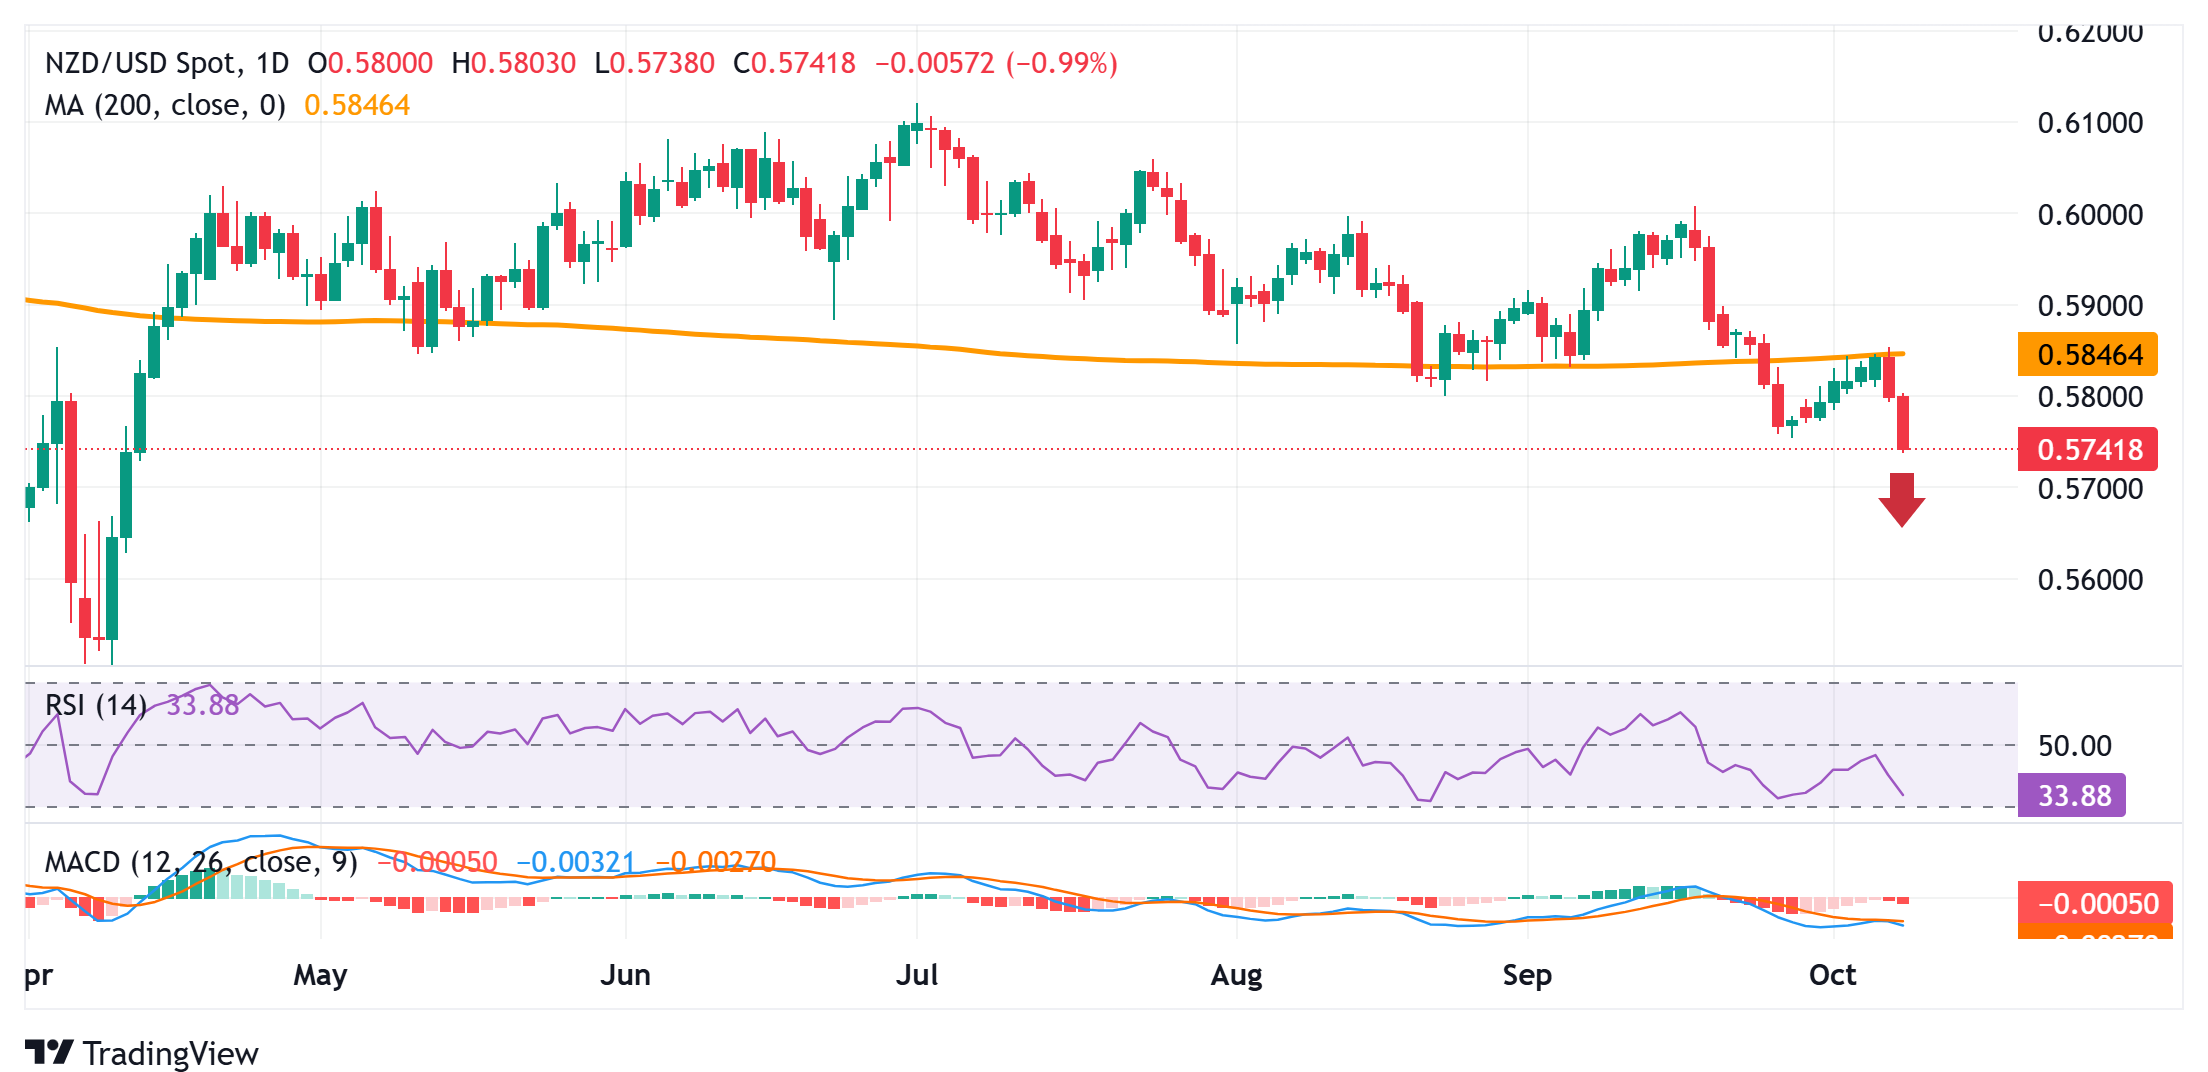
The NZD/USD pair extends the previous day's sharp retracement slide from levels just above mid-0.5800s, or a nearly two-week high, and attracts heavy selling for the second straight day on Wednesday. The steep intraday decline drags spot prices to the 0.5740-0.5735 region, or the lowest level since April 11 during the Asian session, and is sponsored by a combination of factors.
The New Zealand Dollar (NZD) weakens across the board in reaction to the Reserve Bank of New Zealand's (RBNZ) surprise 50 basis points (bps) rate cut and a dovish outlook. In fact, the central bank showed readiness to cut rates further as required for inflation to settle sustainably near the 2% target mid-point in the medium term. This, along with sustained US Dollar (USD) buying, turns out to be another factor exerting downward pressure on the NZD/USD pair.
From a technical perspective, the overnight failure near the very important 200-day Simple Moving Average (SMA) and the subsequent decline favors bearish traders. Moreover, oscillators on the daily chart remain in negative territory and are still away from being in the oversold zone, suggesting that the path of least resistance for the NZD/USD pair is to the downside. Hence, some follow-through weakness, towards the 0.5700 round figure, looks like a distinct possibility.
A convincing break below the said handle could make the NZD/USD pair vulnerable to extend the downfall towards the 0.5665 region en route to the 0.5610-0.5600 area and the next relevant support near the 0.5580-0.5575 zone.
On the flip side, any attempted recovery beyond the 0.5770 region is likely to confront stiff resistance near the 0.5800 mark. A sustained strength beyond the latter, however, might trigger a short-covering rally and lift the NZD/USD pair back towards the 200-day SMA barrier, currently around mid-0.5800s. Some follow-through buying would negate the near-term negative outlook and shift the bias in favor of bullish traders, paving the way towards reclaiming the 0.5900 mark.
NZD/USD Daily chart
US Dollar Price This week
The table below shows the percentage change of US Dollar (USD) against listed major currencies this week. US Dollar was the strongest against the Japanese Yen.
| USD | EUR | GBP | JPY | CAD | AUD | NZD | CHF | |
|---|---|---|---|---|---|---|---|---|
| USD | 0.92% | 0.44% | 1.93% | 0.08% | 0.36% | 1.32% | 0.61% | |
| EUR | -0.92% | -0.58% | 0.92% | -0.87% | -0.59% | 0.36% | -0.34% | |
| GBP | -0.44% | 0.58% | 1.61% | -0.29% | -0.01% | 0.95% | 0.25% | |
| JPY | -1.93% | -0.92% | -1.61% | -1.77% | -1.59% | -0.67% | -1.33% | |
| CAD | -0.08% | 0.87% | 0.29% | 1.77% | 0.32% | 1.25% | 0.54% | |
| AUD | -0.36% | 0.59% | 0.01% | 1.59% | -0.32% | 0.96% | 0.25% | |
| NZD | -1.32% | -0.36% | -0.95% | 0.67% | -1.25% | -0.96% | -0.70% | |
| CHF | -0.61% | 0.34% | -0.25% | 1.33% | -0.54% | -0.25% | 0.70% |
The heat map shows percentage changes of major currencies against each other. The base currency is picked from the left column, while the quote currency is picked from the top row. For example, if you pick the US Dollar from the left column and move along the horizontal line to the Japanese Yen, the percentage change displayed in the box will represent USD (base)/JPY (quote).

FXStreet
超过一百万用户依赖 FXStreet 获取实时市场数据、图表工具、专家洞见和外汇新闻。其全面的经济日历和教育网络研讨会帮助交易者保持信息领先、做出审慎决策。FXStreet 拥有约 60 人的团队,分布在巴塞罗那总部及全球各地区。
Read More


