
Trade The World
NZD/USD Price Forecast: Seems vulnerable while below 200-hour SMA hurdle near 0.5670
作者 Haresh Menghani
发布日期: 12 Nov 2025 | 修改日期: 12 Nov 2025


POPULAR ARTICLES

The NZD/USD pair meets with a fresh supply during the Asian session on Wednesday and now seems to have snapped a two-day winning streak, to the 0.5670 region, or a nearly one-week top touched the previous day.
- NZD/USD attracts some sellers on Wednesday amid a goodish pickup in the USD demand.
- The overnight failure near the 200-hour SMA backs the case for further near-term losses.
- A sustained strength beyond the 0.5670 hurdle is needed to negate the negative outlook.
The NZD/USD pair meets with a fresh supply during the Asian session on Wednesday and now seems to have snapped a two-day winning streak, to the 0.5670 region, or a nearly one-week top touched the previous day. Spot prices slide below mid-0.5600s in the last hour and seem vulnerable amid the emergence of some US Dollar (USD) dip-buying.
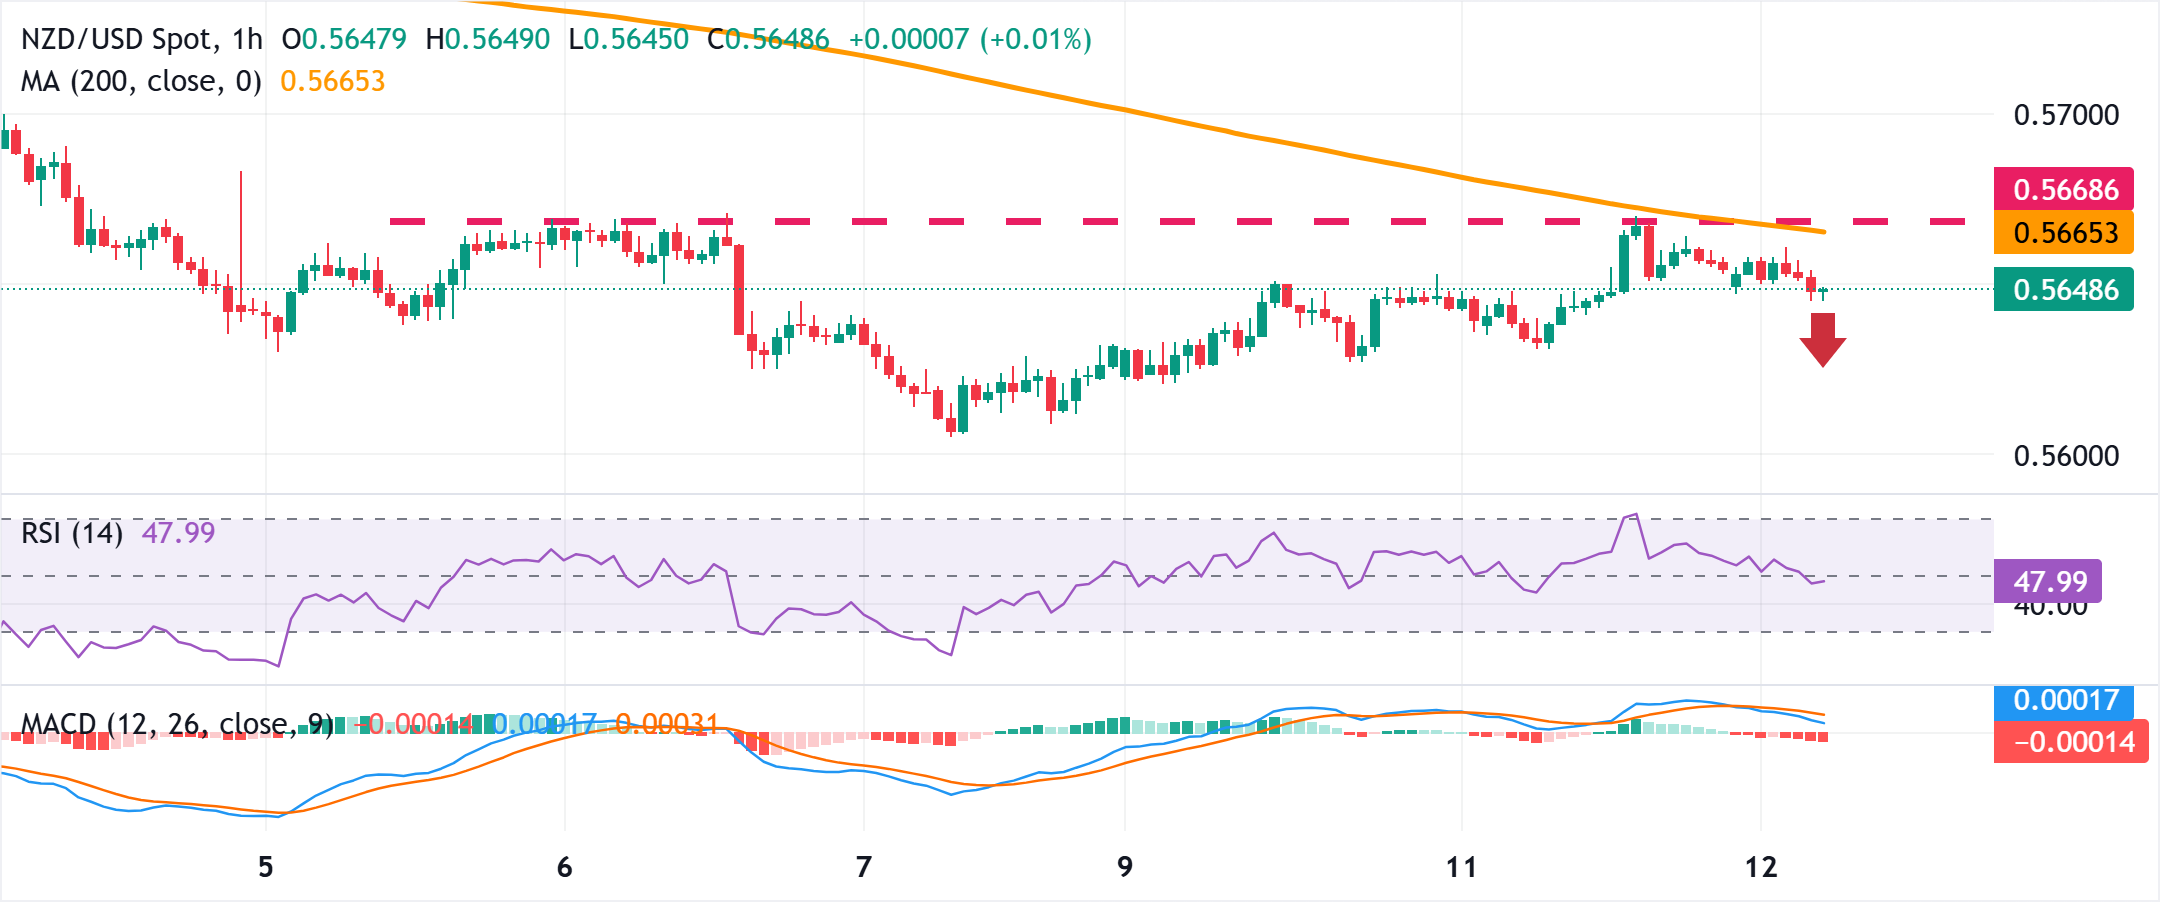
From a technical perspective, the NZD/USD pair faced rejection near the 200-hour Simple Moving Average (SMA) on Tuesday, and the subsequent slide backs the case for deeper losses. Moreover, oscillators on the daily chart are holding deep in bearish territory and have just started gaining negative traction on hourly charts. This, in turn, validates the outlook and suggests that the path of least resistance for spot prices is to the downside.
Hence, some follow-through weakness towards the 0.5625 intermediate support en route to the 0.5600 neighborhood, or the lowest level since April, touched last Friday, looks like a distinct possibility. Acceptance below the latter would mark a fresh breakdown and make the NZD/USD pair vulnerable to accelerate the downfall towards mid-0.5500s before eventually dropping to the April low – levels just below the 0.5500 psychological mark.
On the flip side, the 0.5665-0.5670 area (200-hour SMA) might continue to act as an immediate strong barrier, above which a bout of a short-covering move could allow the NZD/USD pair to reclaim the 0.5700 round figure. Some follow-through buying should pave the way for additional gains towards the 0.5750-0.5755 intermediate resistance en route to the 0.5800 round-figure mark, or the late October swing high.
NZD/USD 1-hour chart
US Dollar Price Today
The table below shows the percentage change of US Dollar (USD) against listed major currencies today. US Dollar was the strongest against the Japanese Yen.
| USD | EUR | GBP | JPY | CAD | AUD | NZD | CHF | |
|---|---|---|---|---|---|---|---|---|
| USD | 0.07% | 0.21% | 0.39% | 0.04% | 0.11% | 0.13% | 0.03% | |
| EUR | -0.07% | 0.14% | 0.32% | -0.02% | 0.06% | 0.06% | -0.03% | |
| GBP | -0.21% | -0.14% | 0.18% | -0.16% | -0.09% | -0.08% | -0.18% | |
| JPY | -0.39% | -0.32% | -0.18% | -0.34% | -0.27% | -0.26% | -0.36% | |
| CAD | -0.04% | 0.02% | 0.16% | 0.34% | 0.07% | 0.08% | -0.02% | |
| AUD | -0.11% | -0.06% | 0.09% | 0.27% | -0.07% | 0.02% | -0.08% | |
| NZD | -0.13% | -0.06% | 0.08% | 0.26% | -0.08% | -0.02% | -0.10% | |
| CHF | -0.03% | 0.03% | 0.18% | 0.36% | 0.02% | 0.08% | 0.10% |
The heat map shows percentage changes of major currencies against each other. The base currency is picked from the left column, while the quote currency is picked from the top row. For example, if you pick the US Dollar from the left column and move along the horizontal line to the Japanese Yen, the percentage change displayed in the box will represent USD (base)/JPY (quote).

FXStreet
超过一百万用户依赖 FXStreet 获取实时市场数据、图表工具、专家洞见和外汇新闻。其全面的经济日历和教育网络研讨会帮助交易者保持信息领先、做出审慎决策。FXStreet 拥有约 60 人的团队,分布在巴塞罗那总部及全球各地区。
Read More


