
Trade The World
Pi Network sponsors Token2049 Singapore, teasing second public interaction
作者 Vishal Dixit
发布日期: 2 Sep 2025 | 修改日期: 2 Sep 2025


POPULAR ARTICLES

Pi Network (PI) trades at $0.3457 at the time of writing on Tuesday, recovering after two days of freefall, with bulls struggling to hold ground above the record low of $0.3220.
- Pi Network becomes gold sponsor of Token2049, hinting at the second public interaction this year.
- PI ticks higher after two consecutive days of losses, avoiding the record low $0.3220 retest.
- The technical outlook suggests that the path of least resistance is to the downside.
Pi Network (PI) trades at $0.3457 at the time of writing on Tuesday, recovering after two days of freefall, with bulls struggling to hold ground above the record low of $0.3220. Damping the decline, Token2049, the world’s largest crypto event, has revealed Pi Network as a gold sponsor on its partnership page, tilting investors’ sentiment.
Still, the declining trend within a falling channel pattern underpins the bearish bias in the PI’s technical outlook.
Pi Network could return to the public stage with Token2049
Pi Network is one of the gold sponsors of the Token2049 crypto event, as listed on the event’s partnership page alongside other notable names, including Circle and CoinEx. This fuels the discussion of Pi Network founder Nicolas Kokkalis, who returns to the public stage after the Consensus event by Coindesk that took place in Toronto from May 14 to May 16 this year.
Partners of Token2049. Source: Token2049
The initial anticipation, coupled with the launch of the Linux version of Pi Node, could help PI recover its losses. However, investors must remember that during the past three-day Consensus event in Canada, the token dropped by 41%. This downturn marked the beginning of a prolonged correction period.
Pi Network continues the struggle for a bounce back
Pi Network’s falling channel pattern remains intact on the daily chart, with the recent downcycle started by the more than 8% drop on Sunday. At the time of writing, PI recovers over 1% on the day, with bulls eyeing a bounce back to the channel pattern’s overhead trendline formed by connecting the May 21 and August 10 peaks.
The 50-day Exponential Moving Average (EMA) at $0.4021 is moving closely with the overhead trendline. A decisive push above this level would mark the beginning of the breakout rally, targeting the $0.5000 psychological milestone.
The momentum indicators on the daily chart remain at neutral levels, with the Relative Strength Index (RSI) at 43, fluctuating at the midpoint, and exhibiting a steady formation of higher lows. The near-stagnant rise, compared to the price action taking multiple supports slightly above the $0.3220 level, highlights a bullish divergence, increasing the chances of an uptrend revival.
The Moving Average Convergence Divergence (MACD) indicator displays a decline in green histogram bars as the average lines approach a potential convergence. A red histogram bar below the zero line, indicating a possible crossover, would signal a sell opportunity as momentum turns bearish.
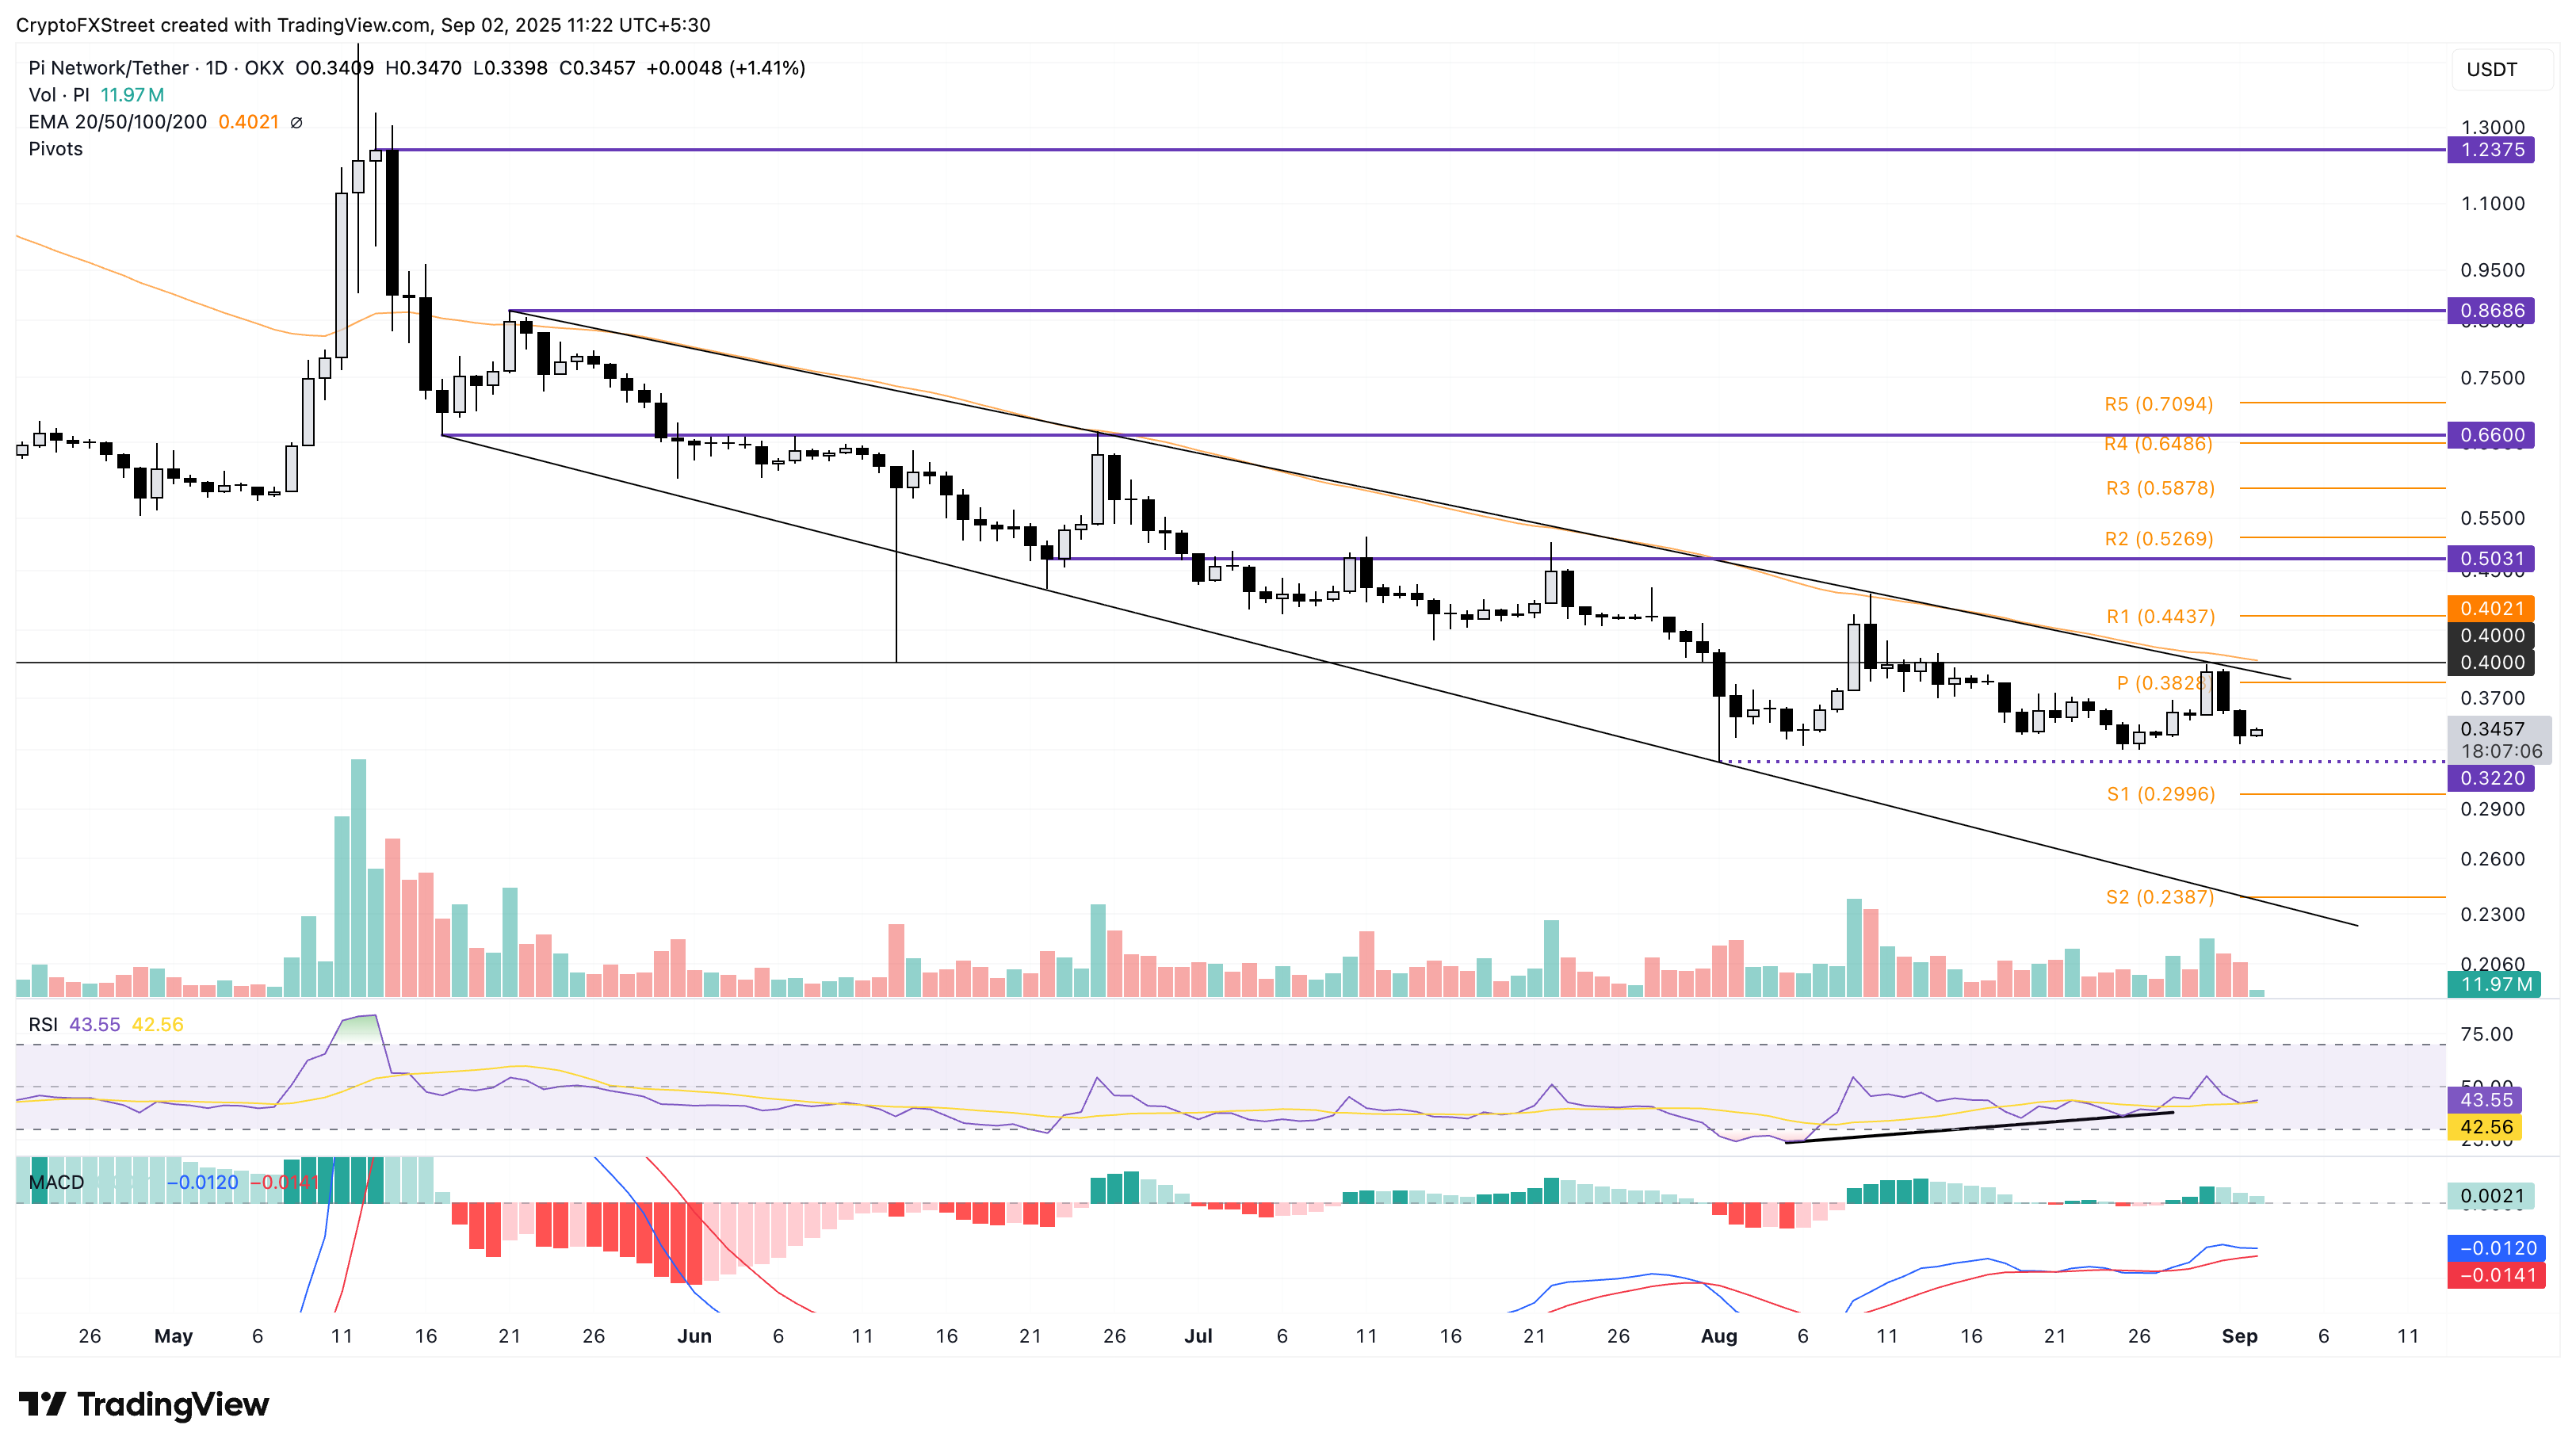
PI/USDT daily price chart.
Looking down, if PI fails to uphold the $0.3220 support level, it could extend the decline to the S1 pivot level at $0.2996.
Open Interest, funding rate FAQs
Higher Open Interest is associated with higher liquidity and new capital inflow to the market. This is considered the equivalent of increase in efficiency and the ongoing trend continues. When Open Interest decreases, it is considered a sign of liquidation in the market, investors are leaving and the overall demand for an asset is on a decline, fueling a bearish sentiment among investors.
Funding fees bridge the difference between spot prices and prices of futures contracts of an asset by increasing liquidation risks faced by traders. A consistently high and positive funding rate implies there is a bullish sentiment among market participants and there is an expectation of a price hike. A consistently negative funding rate for an asset implies a bearish sentiment, indicating that traders expect the cryptocurrency’s price to fall and a bearish trend reversal is likely to occur.

FXStreet
超过一百万用户依赖 FXStreet 获取实时市场数据、图表工具、专家洞见和外汇新闻。其全面的经济日历和教育网络研讨会帮助交易者保持信息领先、做出审慎决策。FXStreet 拥有约 60 人的团队,分布在巴塞罗那总部及全球各地区。
Read More


