
Trade The World
Pi Network rises as MiCA whitepaper boosts sentiment and technical outlook
作者 Vishal Dixit
发布日期: 20 Nov 2025 | 修改日期: 20 Nov 2025


POPULAR ARTICLES

Pi Network (PI) is up 11% so far this week, underpinned by its whitepaper on the Market in Crypto-Assets (MiCA) regulations for the European Union (EU) markets. The technical outlook remains bullish as PI exceeds the long-standing dynamic resistance, the 50-day Exponential Moving Average, preparing
- Pi Network exceeds the 50-day EMA with a 4% rise on Thursday, marking its sixth day of uptrend.
- The release of the MiCA whitepaper for the European markets boosts demand and sentiment around Pi Network.
- The technical outlook indicates a bullish incline as recovery gains momentum.
Pi Network (PI) is up 11% so far this week, underpinned by its whitepaper on the Market in Crypto-Assets (MiCA) regulations for the European Union (EU) markets. The technical outlook remains bullish as PI exceeds the long-standing dynamic resistance, the 50-day Exponential Moving Average, preparing for a breakout rally.
Pi Network’s MiCA whitepaper could open the gate to the European market
Pi Network is heating up with the release of its MiCA regulations compliance whitepaper, a legal and technical filing submitted to request permission to start trading in the EU and the European Economic Area (EEA). Although the whitepaper is linked to the official Pi Network website, there is no clear announcement from the Pi core team or its founders.
Furthermore, the whitepaper highlights the initial listing request for OKCoin Europe Ltd (OKX Europe), with a start date of November 28. Pi Network positions for a potential increase in trading volume that could support a price surge, typically seen with listing in new markets.
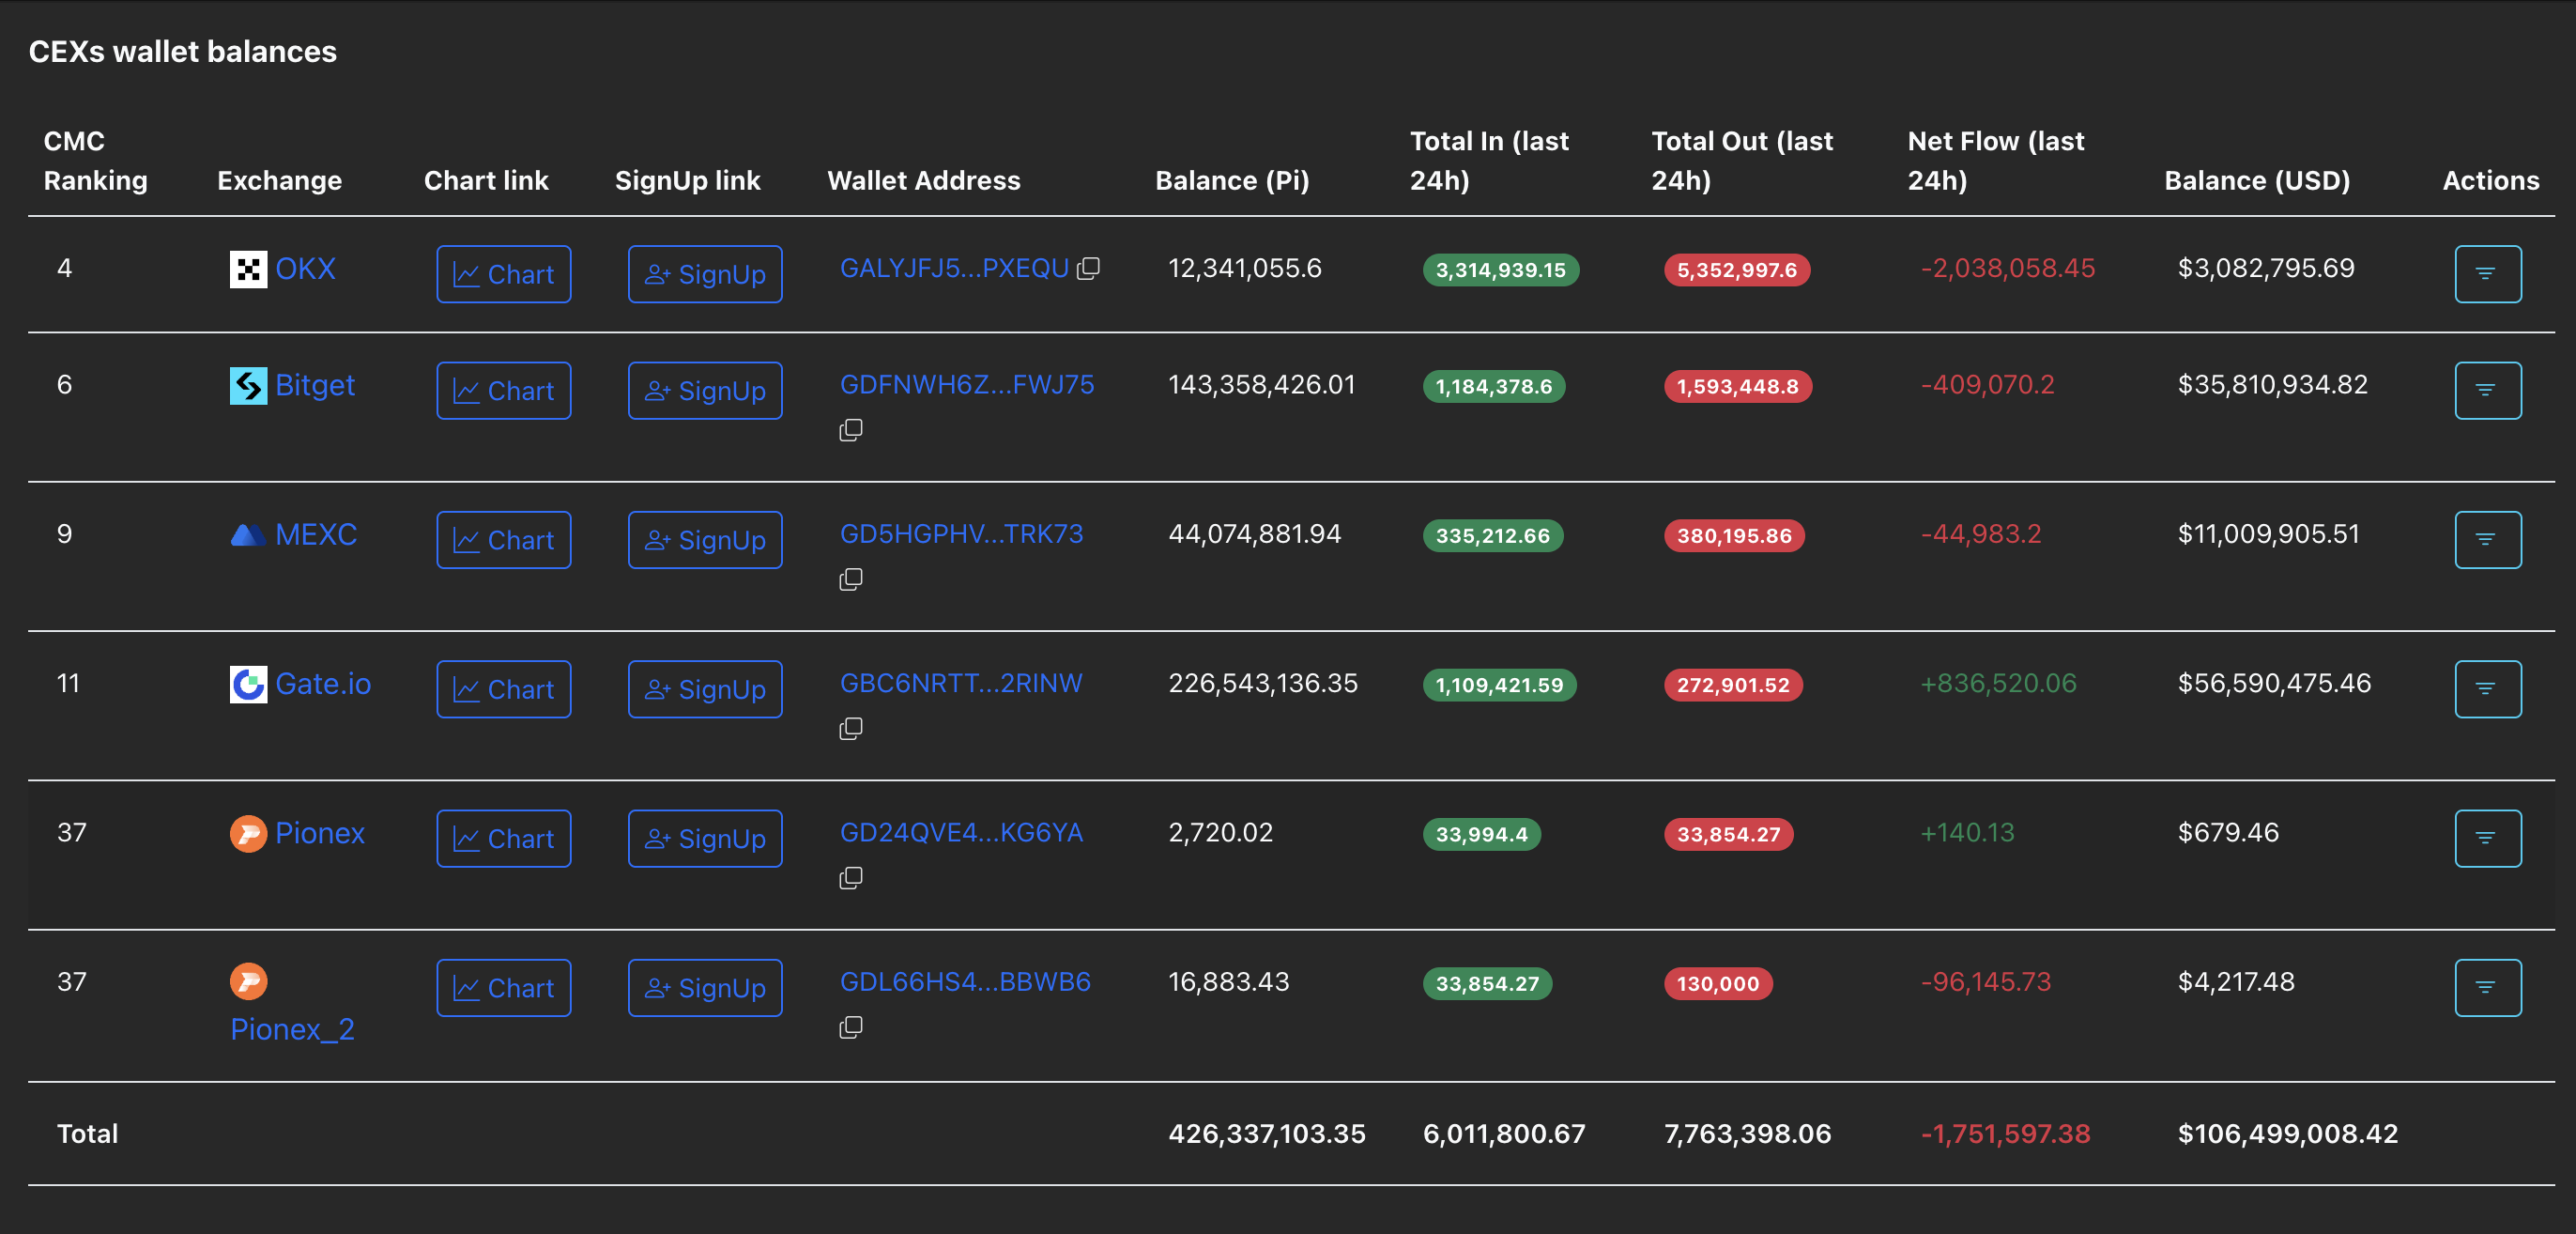
As of Thursday, PI is listed on five Centralized Exchanges (CEXs), which are holding a total balance of 426.33 million tokens. With the release of the MiCA regulation whitepaper, the increased demand for CEXs has led to a net outflow of 1.75 million PI, suggesting buy-side dominance.
Pi Network exceeds the 50-day EMA
Pi Network trades near the $0.2500 level, holding above the 50-day EMA at $0.2431. The short-term six-day recovery run is approaching the $0.2643 level, marked by the September 26 close, which served as key resistance in late October.
If PI successfully ends a day above this level, it could confirm a resurgent bullish trend, potentially targeting the $0.3220 as the immediate resistance, aligning with the August 1 low.
In line with the recovery run, the momentum indicators on the daily chart suggest heightened buying activity. The Moving Average Convergence Divergence (MACD) rises above the signal line, accompanied by a fresh wave of advancing green histogram bars, indicating increased bullish momentum.
Additionally, the Relative Strength Index (RSI) at 62 is moving north, with further room for growth before it hits the overbought zone.

If PI fails to hold above the 50-day EMA, it would extend the dynamic resistance's dominance. In such a case, the PI token could retrace towards the $0.2000 round figure.
Cryptocurrency prices FAQs
Token launches influence demand and adoption among market participants. Listings on crypto exchanges deepen the liquidity for an asset and add new participants to an asset’s network. This is typically bullish for a digital asset.
A hack is an event in which an attacker captures a large volume of the asset from a DeFi bridge or hot wallet of an exchange or any other crypto platform via exploits, bugs or other methods. The exploiter then transfers these tokens out of the exchange platforms to ultimately sell or swap the assets for other cryptocurrencies or stablecoins. Such events often involve an en masse panic triggering a sell-off in the affected assets.
Macroeconomic events like the US Federal Reserve’s decision on interest rates influence crypto assets mainly through the direct impact they have on the US Dollar. An increase in interest rate typically negatively influences Bitcoin and altcoin prices, and vice versa. If the US Dollar index declines, risk assets and associated leverage for trading gets cheaper, in turn driving crypto prices higher.
Halvings are typically considered bullish events as they slash the block reward in half for miners, constricting the supply of the asset. At consistent demand if the supply reduces, the asset’s price climbs.

FXStreet
超过一百万用户依赖 FXStreet 获取实时市场数据、图表工具、专家洞见和外汇新闻。其全面的经济日历和教育网络研讨会帮助交易者保持信息领先、做出审慎决策。FXStreet 拥有约 60 人的团队,分布在巴塞罗那总部及全球各地区。
Read More


