
Pi Network Price Forecast: PI rebounds slightly but selling pressure persists
作者 Vishal Dixit
发布日期: 20 Jan 2026 | 修改日期: 20 Jan 2026


热门文章

Pi Network (PI) edges higher by 1% at press time on Tuesday, signaling a minor recovery after recording a fresh record low of $0.1502 on Monday. Mainnet holders have withdrawn over 4 million PI tokens from centralized exchanges supporting Pi Network over the last 24 hours.
- Pi Network recovers 1% on Tuesday from a key support level after a 4% drop on Monday.
- PiScan data shows over 4 million PI token withdrawals in 24 hours, reflecting a retail attempt to protect against downside.
- Technically, the PI token remains under intense selling pressure, flipping the momentum bearish and risking further losses.
Pi Network (PI) edges higher by 1% at press time on Tuesday, signaling a minor recovery after recording a fresh record low of $0.1502 on Monday. Mainnet holders have withdrawn over 4 million PI tokens from centralized exchanges supporting Pi Network over the last 24 hours. The technical outlook for PI remains bearish as momentum indicators signal intense selling pressure.
Retail demand caps the downside
PiScan data shows that the reserves of centralized exchanges have decreased by 4.24 million PI tokens, indicating large withdrawals over the last 24 hours. This reflects strong buying, which capped the downside with a daily close above $0.1900. A steady decline in the exchange reserve would limit supply pressure, increasing the likelihood of a rebound for the PI token.

Technical outlook: Will the PI token price crash further?
Pi Network holds above $0.1900 at the time of writing on Tuesday, roughly 30% up from Monday’s low at $0.1502. This rebound aligns with the large exchange withdrawals and avoids a breakdown at the $0.1919 support level.
The downward-sloping 20-day and 50-day Exponential Moving Averages (EMAs) reflect a prevailing downtrend.
Additionally, the momentum indicators on the daily chart suggest intense bearish momentum. The Moving Average Convergence Divergence (MACD) flips downside from the zero line, crossing the red line with a widening negative histogram. The Relative Strength Index (RSI) is at 30, hovering around the oversold boundary and consistent with the recent drop.
A daily close below $0.1919 could extend the bearish trend, with support levels at the S1 and S2 Pivot Points at $0.1835 and $0.1632, respectively.
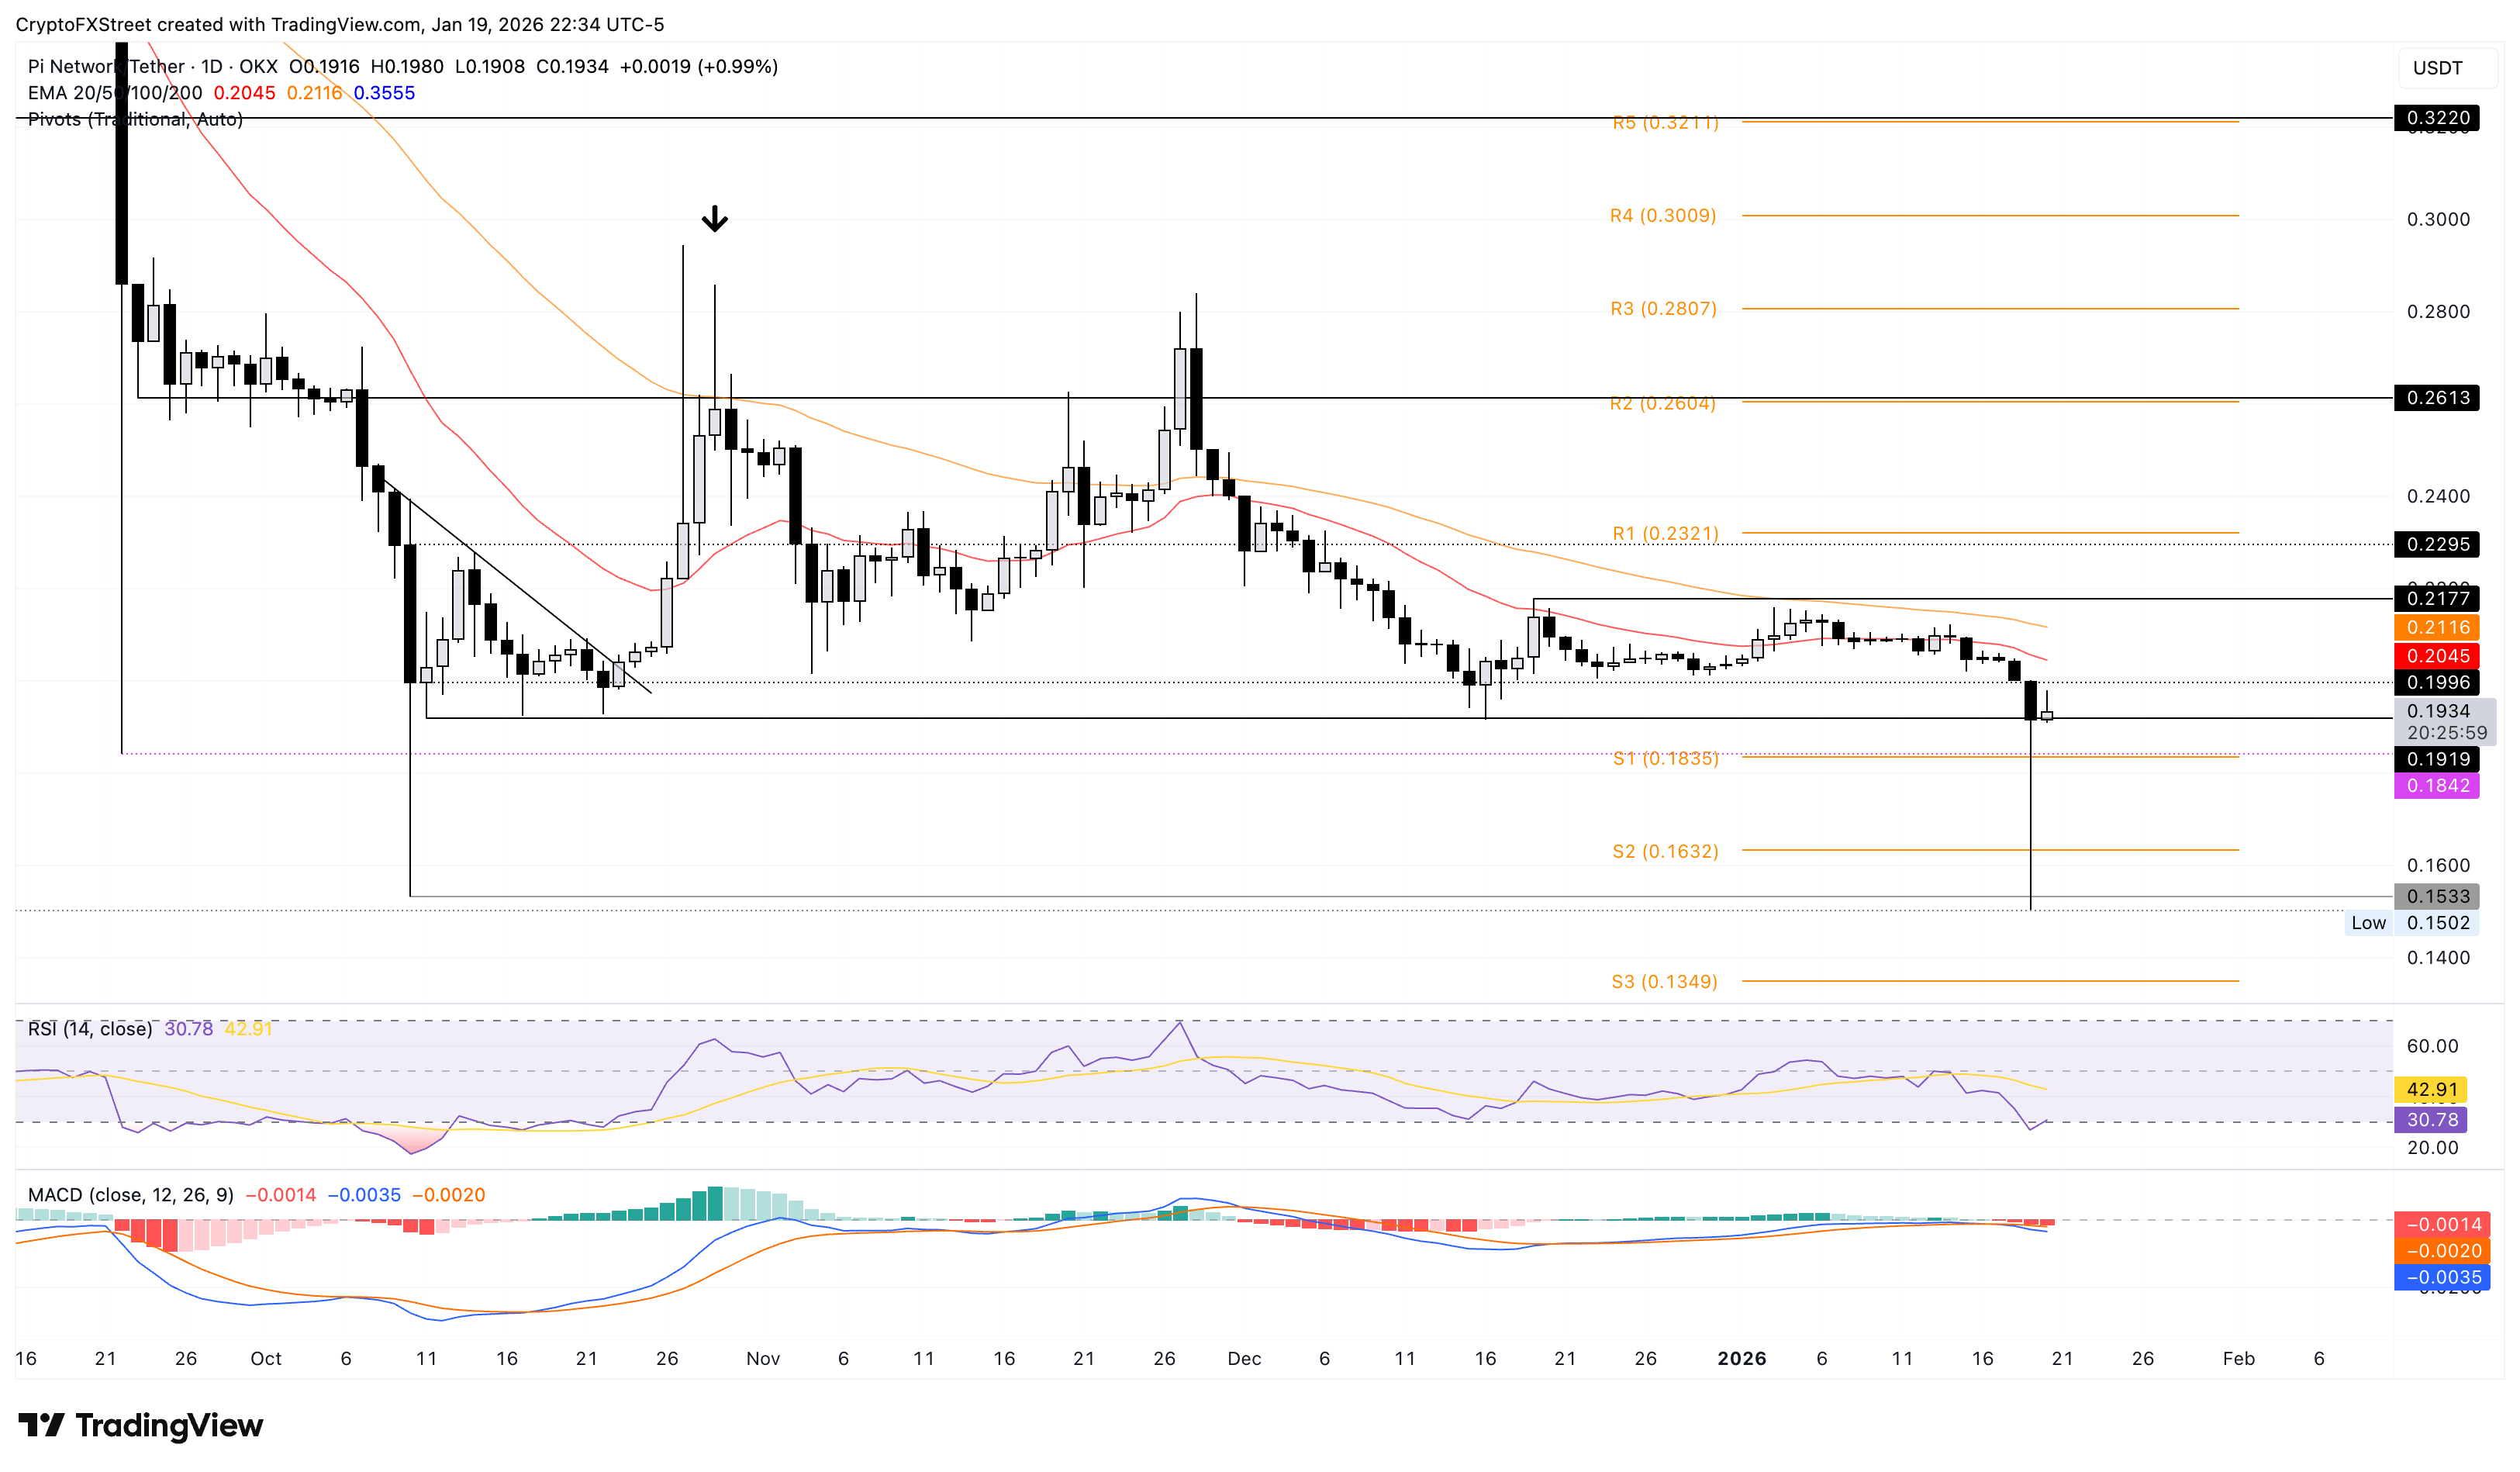
However, a rebound in PI could face opposition at the declining 20-day and 50-day EMAs at $0.2045 and $0.2116, respectively.
Bitcoin, altcoins, stablecoins FAQs
Bitcoin is the largest cryptocurrency by market capitalization, a virtual currency designed to serve as money. This form of payment cannot be controlled by any one person, group, or entity, which eliminates the need for third-party participation during financial transactions.
Altcoins are any cryptocurrency apart from Bitcoin, but some also regard Ethereum as a non-altcoin because it is from these two cryptocurrencies that forking happens. If this is true, then Litecoin is the first altcoin, forked from the Bitcoin protocol and, therefore, an “improved” version of it.
Stablecoins are cryptocurrencies designed to have a stable price, with their value backed by a reserve of the asset it represents. To achieve this, the value of any one stablecoin is pegged to a commodity or financial instrument, such as the US Dollar (USD), with its supply regulated by an algorithm or demand. The main goal of stablecoins is to provide an on/off-ramp for investors willing to trade and invest in cryptocurrencies. Stablecoins also allow investors to store value since cryptocurrencies, in general, are subject to volatility.
Bitcoin dominance is the ratio of Bitcoin's market capitalization to the total market capitalization of all cryptocurrencies combined. It provides a clear picture of Bitcoin’s interest among investors. A high BTC dominance typically happens before and during a bull run, in which investors resort to investing in relatively stable and high market capitalization cryptocurrency like Bitcoin. A drop in BTC dominance usually means that investors are moving their capital and/or profits to altcoins in a quest for higher returns, which usually triggers an explosion of altcoin rallies.

超过一百万用户依赖 FXStreet 获取实时市场数据、图表工具、专家洞见和外汇新闻。其全面的经济日历和教育网络研讨会帮助交易者保持信息领先、做出审慎决策。FXStreet 拥有约 60 人的团队,分布在巴塞罗那总部及全球各地区。
阅读更多


