
Trade The World
Pi Network Price Forecast: PI recovers amid Pi App Studio updates
作者 Vishal Dixit
发布日期: 17 Nov 2025 | 修改日期: 17 Nov 2025


POPULAR ARTICLES
Pi Network (PI) trades above $0.2200 at press time on Monday, sustaining the 3.52% gains from Sunday. The announcement of Pi App Studio updates on Thursday aligns with the three-day recovery in PI token, with bulls aiming towards the 50-day Exponential Moving Average.
- Pi Network extends the recovery for the third consecutive day, after a 3.52% surge on Sunday.
- The announcement of fresh updates for Pi App Studio aligns with the token’s short-term recovery.
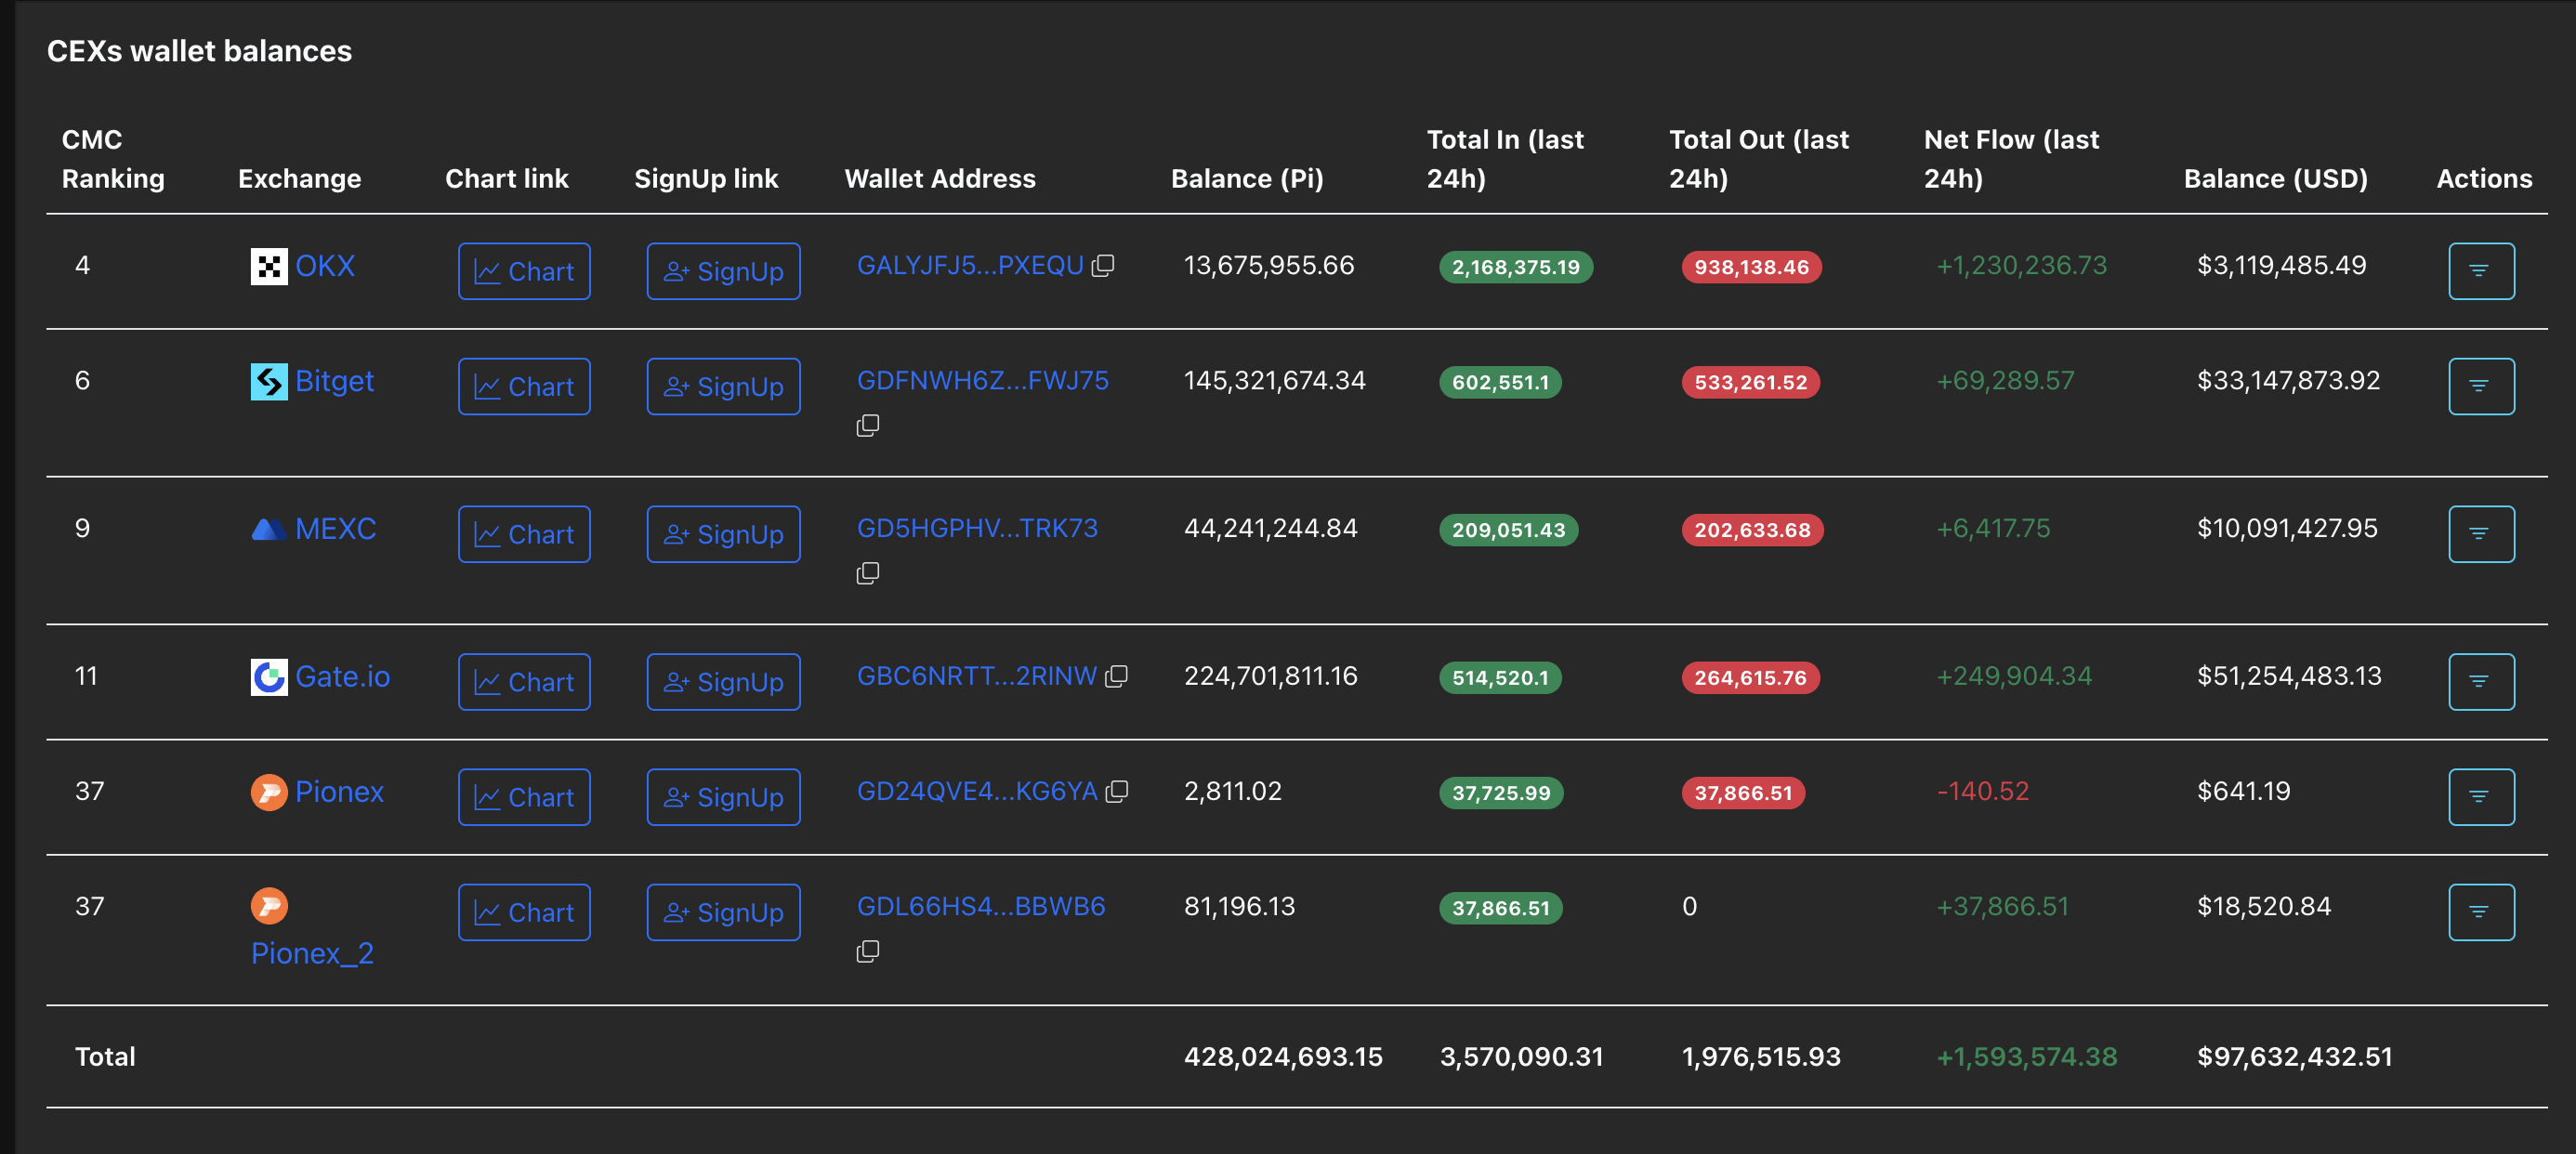
- Centralized Exchanges record a net inflow of 1.59 million PI tokens, indicating that holders are realizing profits.
Pi Network (PI) trades above $0.2200 at press time on Monday, sustaining the 3.52% gains from Sunday. The announcement of Pi App Studio updates on Thursday aligns with the three-day recovery in PI token, with bulls aiming towards the 50-day Exponential Moving Average.
However, the rising inflows on Centralized Exchange (CEX) wallets indicate large user deposits, a sign of profit-taking, which could add to overhead supply pressure.
Holders realize profit as Pi Network rolls out new updates
Pi Network released fresh updates in the Pi App Studio on Thursday, providing developers with more customization and flexibility, as well as a new management and creator interface. The push for development on the Pi Network reflects the management’s enthusiasm to expand from mobile mining cryptocurrency to a larger Web 3.0 ecosystem.

Despite the expansion plans, the short-term on-chain flow indicates low confidence among PI token holders. According to PiScan, the CEXs' wallet balances recorded a net deposit of 1.59 million PI in the last 24 hours, primarily on OKX, with a net deposit of 1.23 million. The increase in user deposits on CEXs suggests that investors with verified Know Your Customer (KYC) status are taking profits, which could contribute to an increased supply of overhead.
Pi Network signals a potential bullish shift to the ongoing consolidation
Pi Network’s recent three-day recovery is part of the lateral extension between the October 11 low of $0.1919 and the declining 50-day EMA at $0.2435. The positive shift in the consolidation range aims to challenge the overhead moving average, which has acted as a dynamic resistance, intact since late May.
If PI holds a successful close above $0.2435, it could confirm the bullish trend reversal. In such a case, the $0.2613 and $0.3220 levels marked by the lows of September 23 and August 1, respectively, could serve as overhead resistances.
The momentum indicators on the daily chart maintain a neutral stance, as the Moving Average Convergence Divergence (MACD) exhibits a sideways trend with its signal line. Meanwhile, the Relative Strength Index (RSI) at 49 indicates a decline in selling pressure, promoting upside potential.
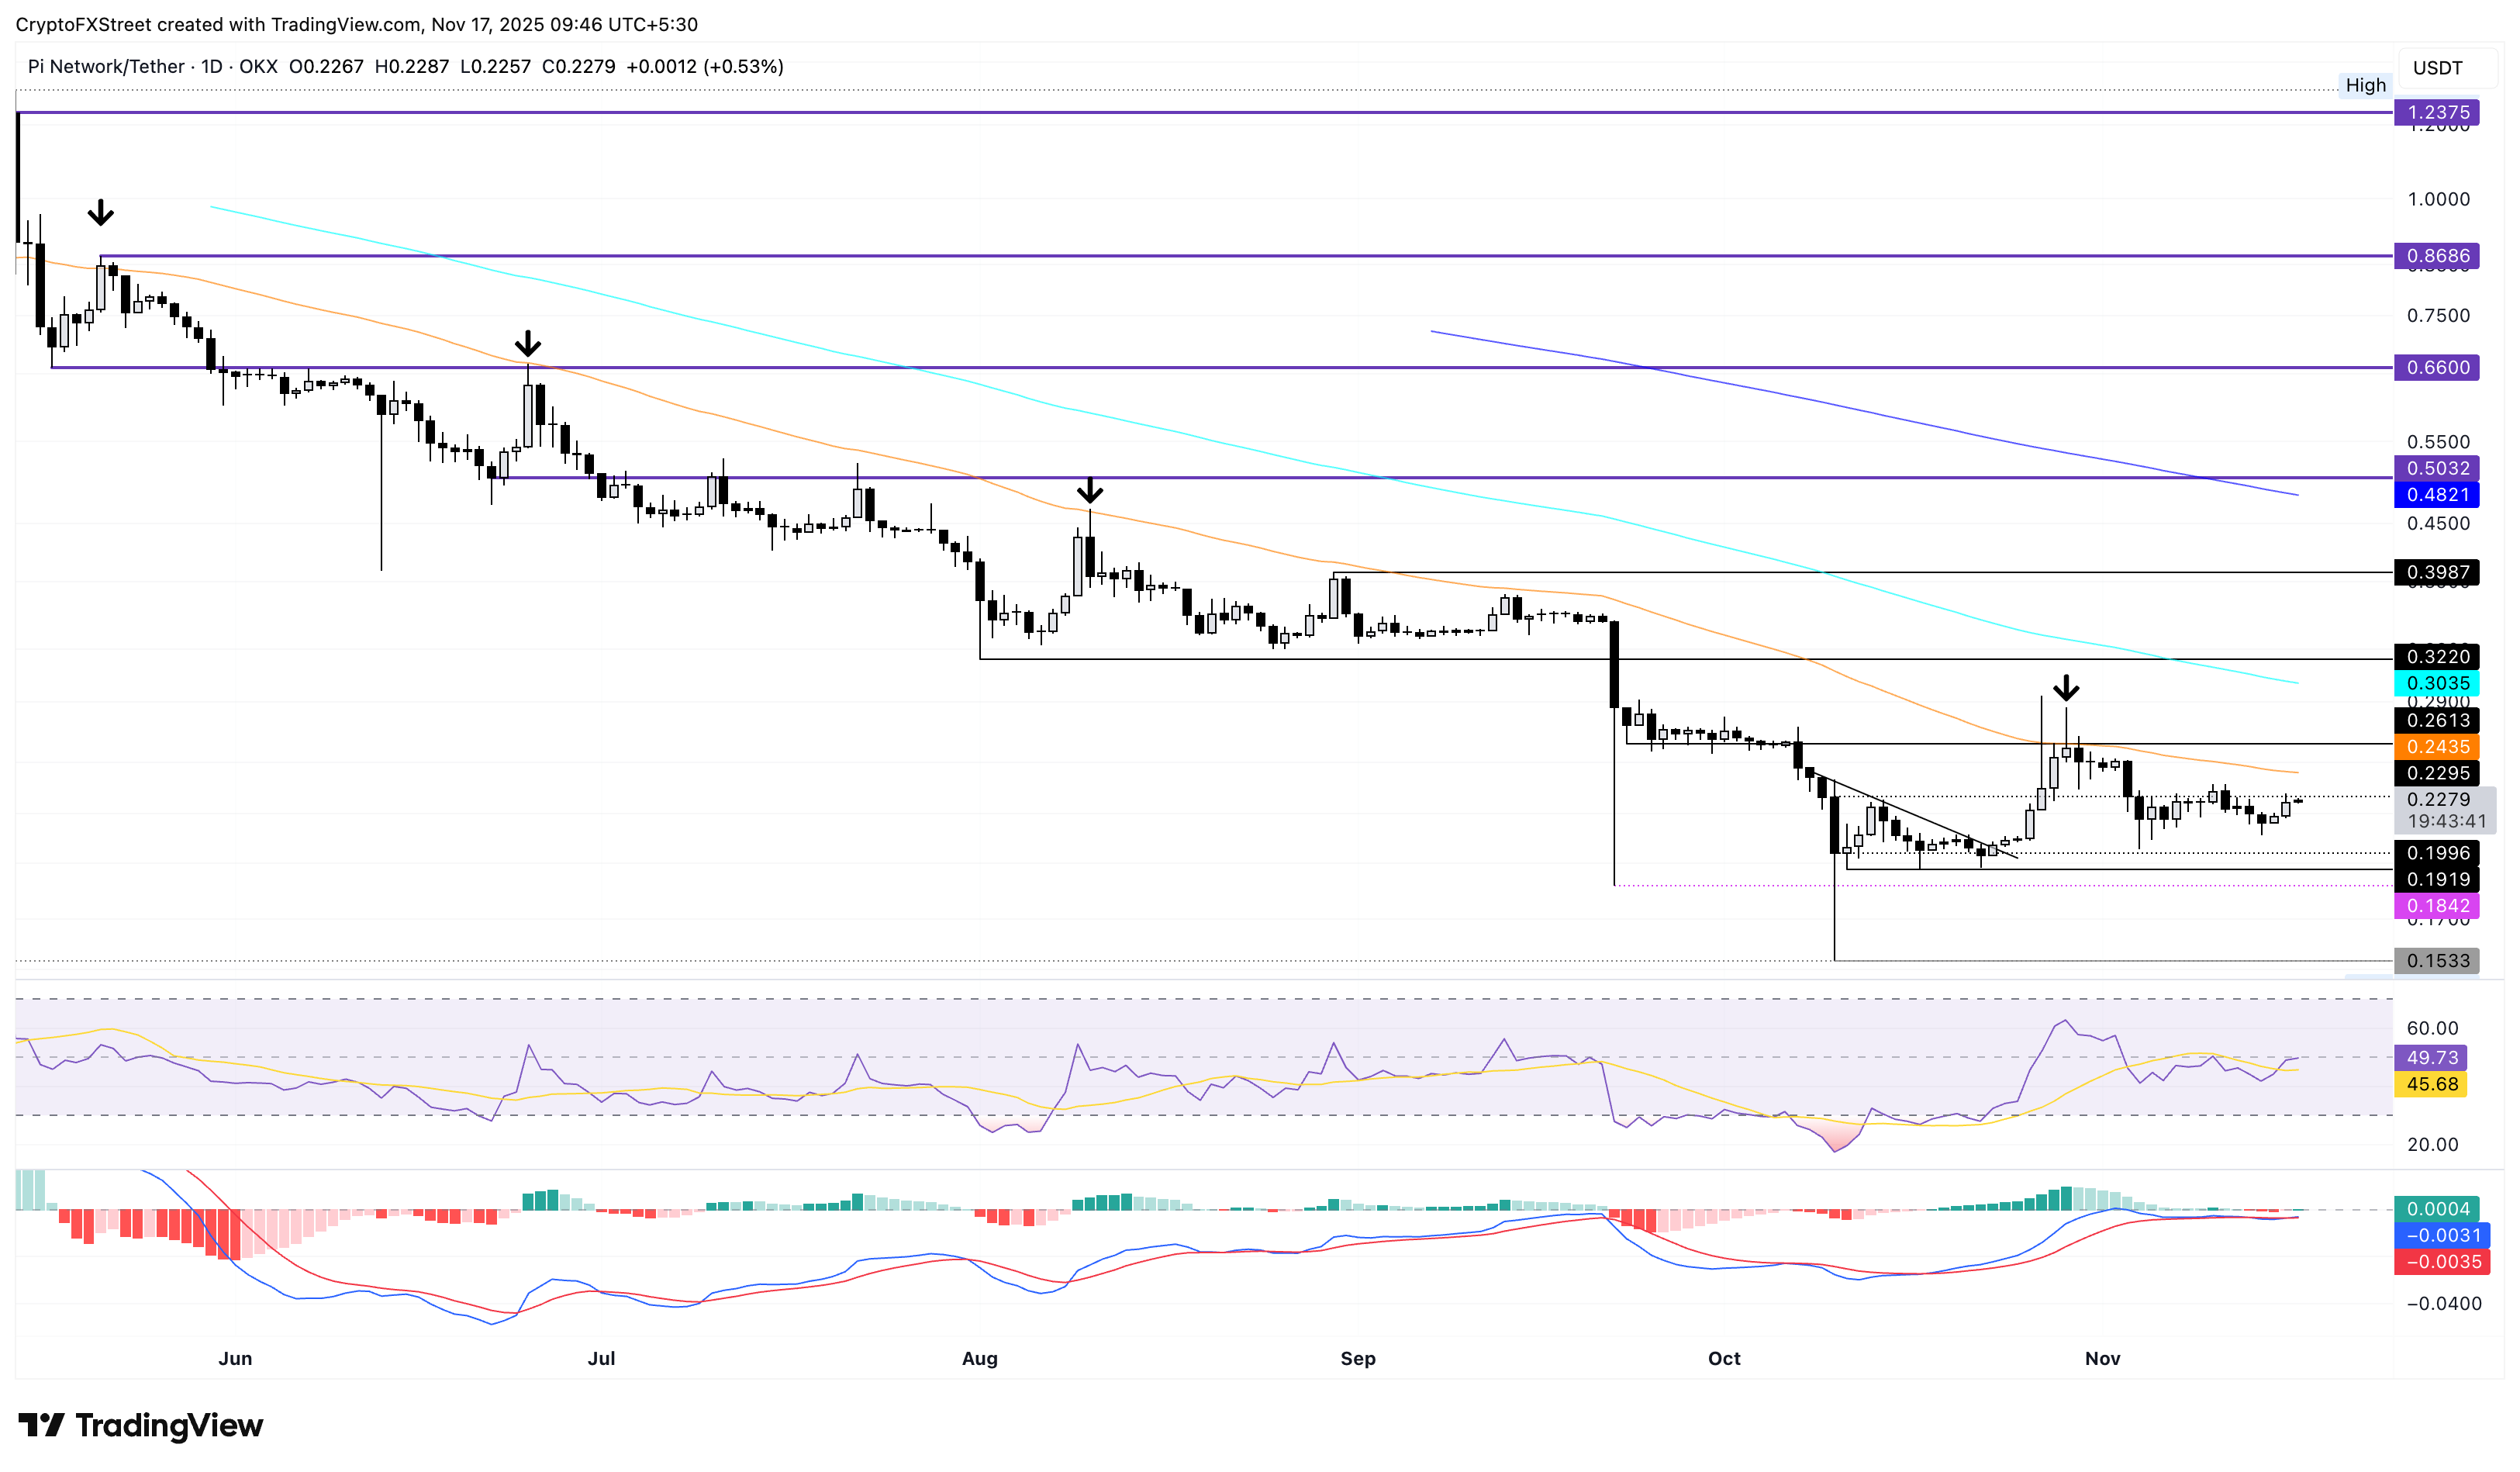
On the downside, the key support levels for PI remain at the $0.1919 and $0.1533 lows from October 11 and 10, respectively.
Cryptocurrency metrics FAQs
The developer or creator of each cryptocurrency decides on the total number of tokens that can be minted or issued. Only a certain number of these assets can be minted by mining, staking or other mechanisms. This is defined by the algorithm of the underlying blockchain technology. On the other hand, circulating supply can also be decreased via actions such as burning tokens, or mistakenly sending assets to addresses of other incompatible blockchains.
Market capitalization is the result of multiplying the circulating supply of a certain asset by the asset’s current market value.
Trading volume refers to the total number of tokens for a specific asset that has been transacted or exchanged between buyers and sellers within set trading hours, for example, 24 hours. It is used to gauge market sentiment, this metric combines all volumes on centralized exchanges and decentralized exchanges. Increasing trading volume often denotes the demand for a certain asset as more people are buying and selling the cryptocurrency.
Funding rates are a concept designed to encourage traders to take positions and ensure perpetual contract prices match spot markets. It defines a mechanism by exchanges to ensure that future prices and index prices periodic payments regularly converge. When the funding rate is positive, the price of the perpetual contract is higher than the mark price. This means traders who are bullish and have opened long positions pay traders who are in short positions. On the other hand, a negative funding rate means perpetual prices are below the mark price, and hence traders with short positions pay traders who have opened long positions.

FXStreet
超过一百万用户依赖 FXStreet 获取实时市场数据、图表工具、专家洞见和外汇新闻。其全面的经济日历和教育网络研讨会帮助交易者保持信息领先、做出审慎决策。FXStreet 拥有约 60 人的团队,分布在巴塞罗那总部及全球各地区。
Read More


