
Trade The World
Pi Network Price Forecast: Rising momentum and strong whale demand put PI on breakout watch
作者 Manish Chhetri
发布日期: 24 Nov 2025 | 修改日期: 24 Nov 2025


POPULAR ARTICLES

Pi Network (PI) begins the week on a positive note, extending its weekend gains and approaching a key technical barrier around $0.247 at the time of writing on Monday.
- Pi Network trades in green on Monday, nearing a key resistance zone, a breakout above suggests a rally ahead.
- On-chain data shows large whale orders, indicating strengthening accumulation and improving investor confidence.
- The technical outlook suggests a potential upside move, with momentum indicators signaling a bullish bias as buying pressure builds.
Pi Network (PI) begins the week on a positive note, extending its weekend gains and approaching a key technical barrier around $0.247 at the time of writing on Monday. Growing momentum, coupled with increased whale accumulation, has lifted sentiment, putting PI on watch for a potential breakout if buyers step in.
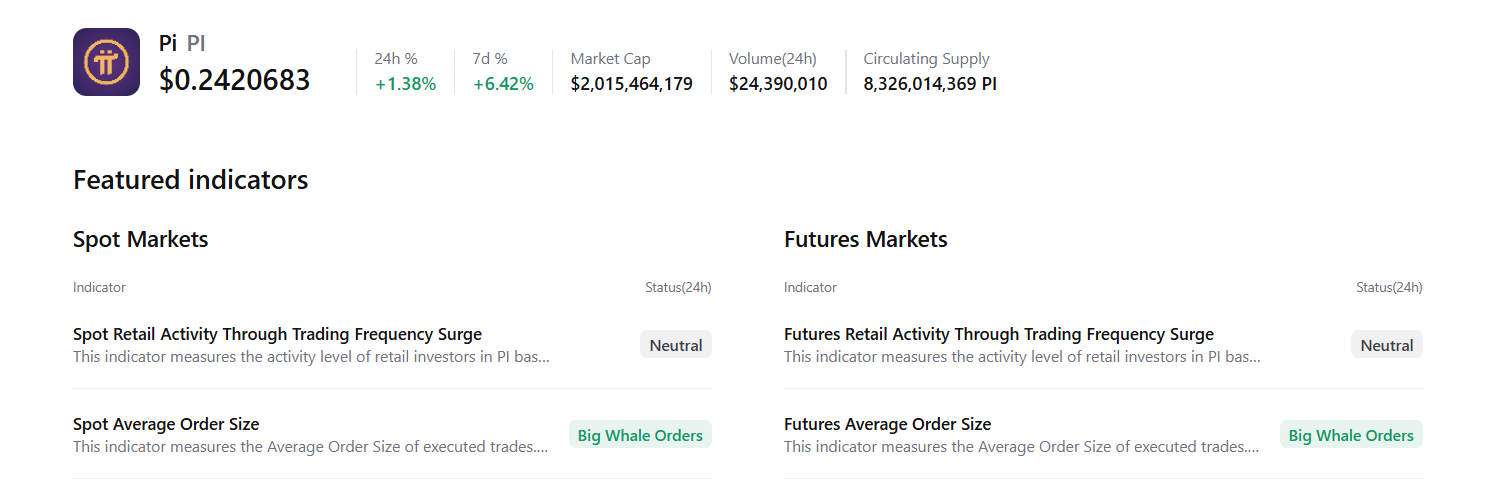
Large whale orders in the spot and futures markets
CryptoQuant summary data supports a positive outlook for Pi Network, as spot and futures markets show large whale orders, signaling that a rally may be forming.
Pi Price Forecast: PI momentum indicators show bullish bias
Pi Network declined nearly 5% on Friday, retesting the weekly support level at $0.221, and recovered most of its losses over the weekend. At the time of writing on Monday, it nears the 50-day Exponential Moving Average (EMA) at $0.242. This 50-day EMA roughly coincides with the 38.2% Fibonacci retracement level at $0.247 (drawn from the August 30 high of $0.398 to the October 10 low of $0.153) and the descending trendline, making it a key resistance zone to watch.
If PI breaks and closes above the descending trendline on a daily basis, it could extend the rally toward the 50% price retracement level at $0.276.
The Relative Strength Index (RSI) on the daily chart reads 56, above the neutral level of 50, indicating bullish momentum gaining traction. Additionally, the Moving Average Convergence Divergence (MACD) showed a bullish crossover last week, which remains intact, further supporting the bullish thesis.
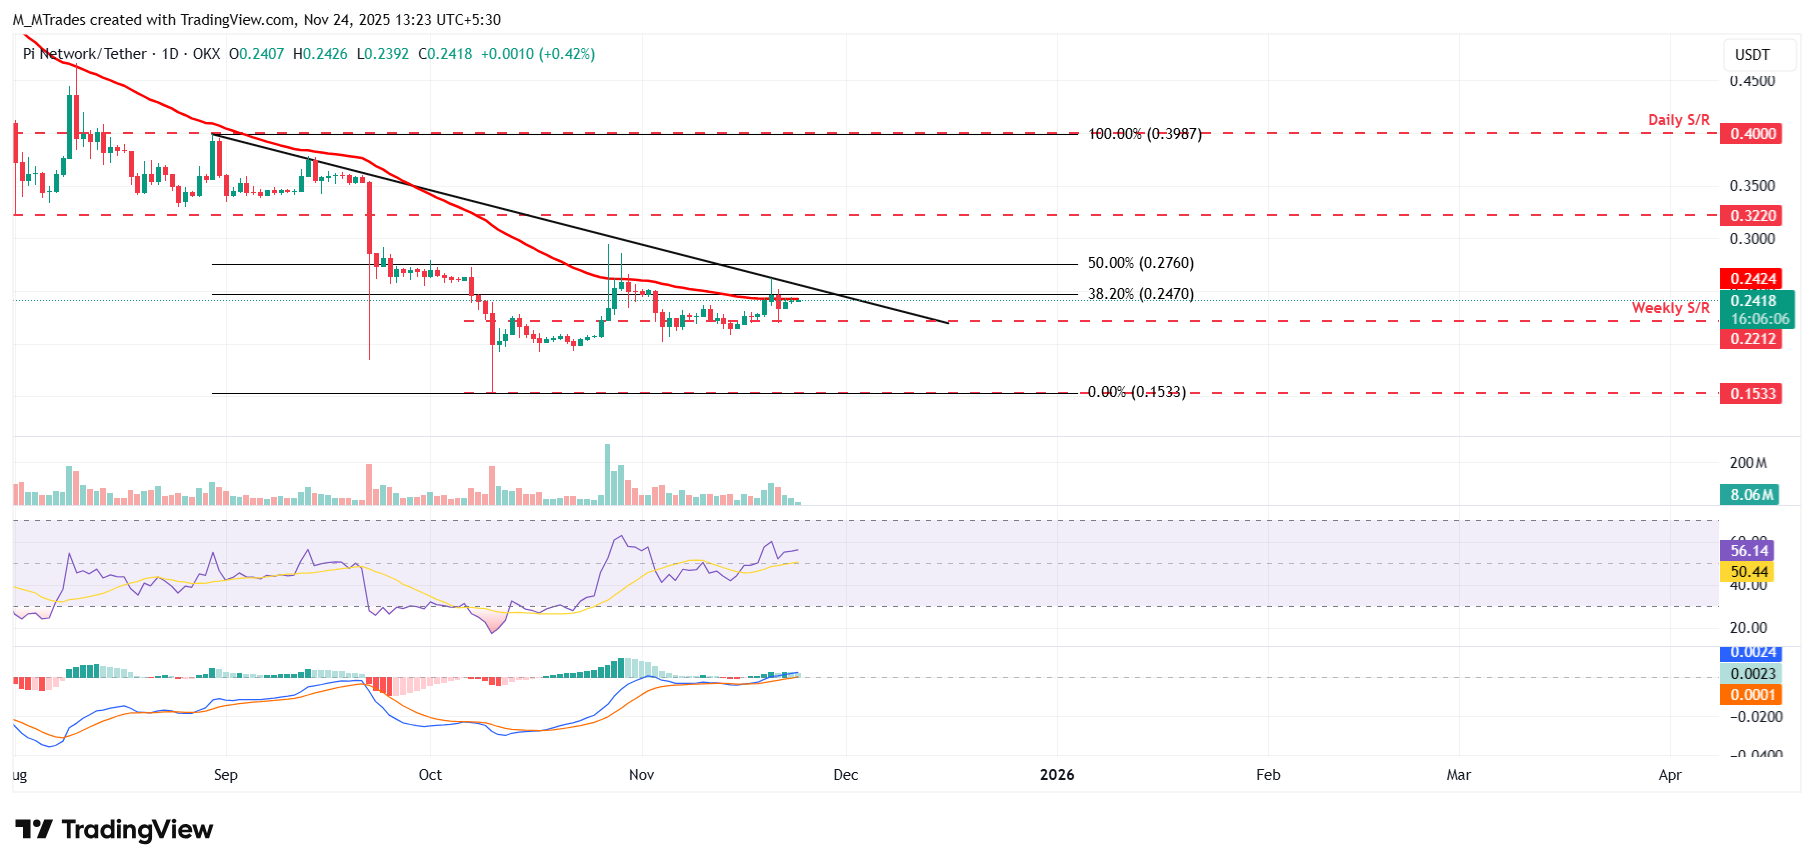
On the other hand, if PI faces rejection from the 50-day EMA at $0.242, it could extend the decline toward the weekly support at $0.221.

FXStreet
超过一百万用户依赖 FXStreet 获取实时市场数据、图表工具、专家洞见和外汇新闻。其全面的经济日历和教育网络研讨会帮助交易者保持信息领先、做出审慎决策。FXStreet 拥有约 60 人的团队,分布在巴塞罗那总部及全球各地区。
Read More


