


- XRP struggles to hold $2.40 amid growing risk-off sentiment in the broader crypto market.
- XRP’s derivatives market remains suppressed, with the Open Interest-weighted funding rate falling sharply to 0.0010%.
- Short-term recovery could be an uphill task, as evidenced by the futures Open Interest’s stability below $5 billion.
Ripple (XRP) recovery remains elusive, trading above $2.40 at the time of writing on Monday. The broader cryptocurrency market is heavily weighed down by risk-off sentiment, triggering a persistent sell-off.
Meanwhile, demand for XRP has remained significantly suppressed since the October 10 sell-off, which saw over $19 billion in crypto assets liquidated on a single day, as evidenced by the weak XRP derivatives market.
XRP extends intraday decline amid low retail interest
XRP highlights a weakening technical structure, worsened by waning retail demand. According to CoinGlass data, the XRP Open Interest (OI), representing the notional value of outstanding futures contracts, averages $4.33 billion at the time of writing, down from $9.09 billion, which marked its peak level in October.
If investors increasingly reduce their risk exposure, the prevailing decline could accelerate toward $2.18, a support area tested on October 17.
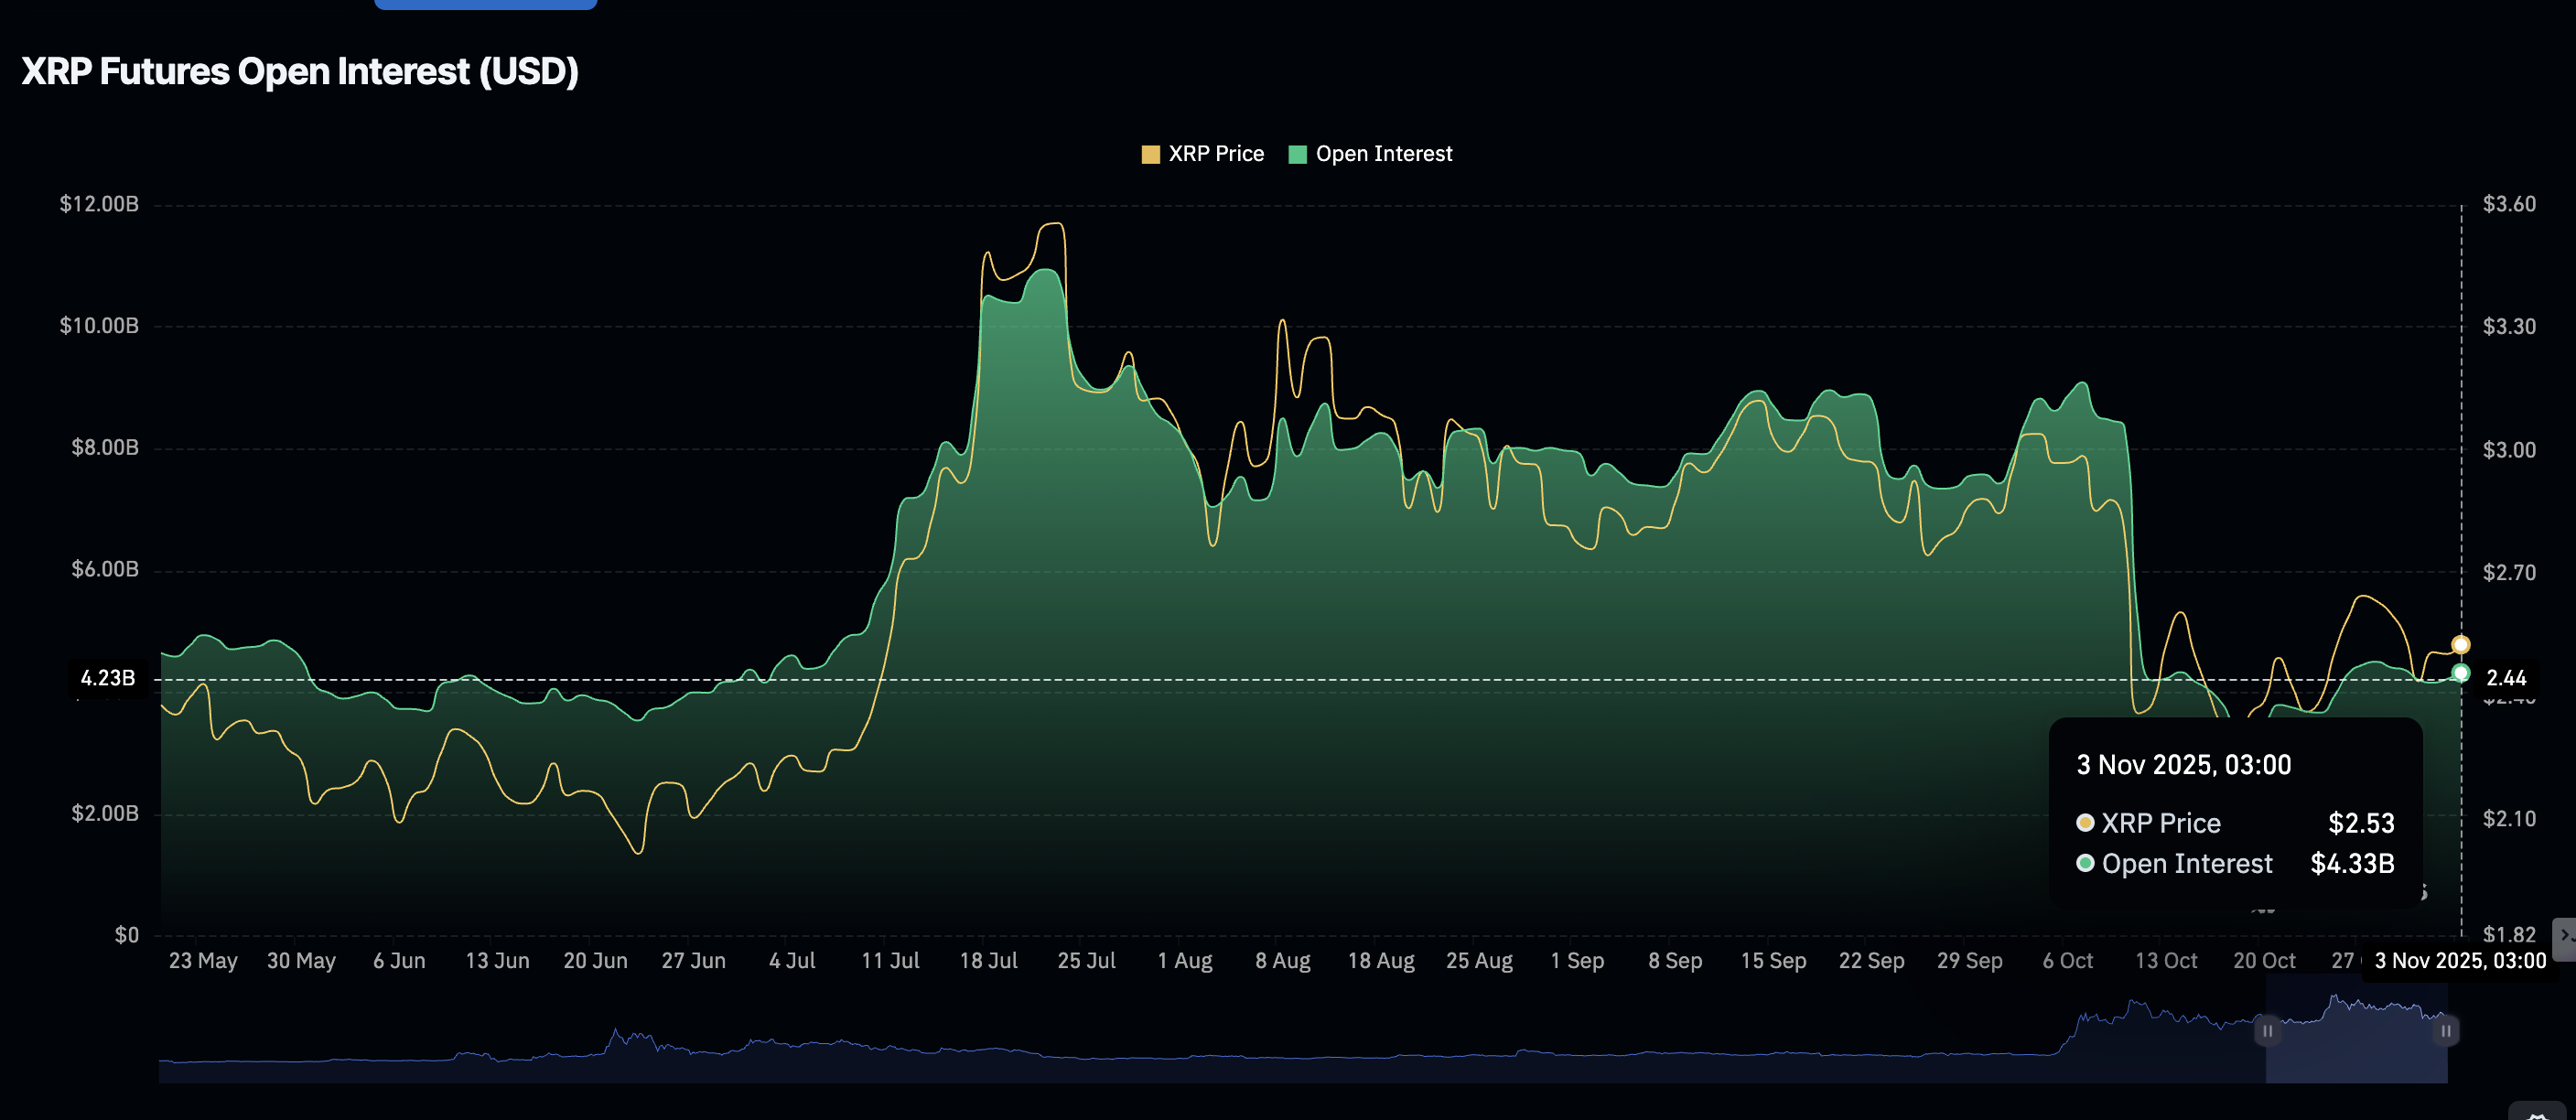
XRP Futures Open Interest | Source: CoinGlass
The XRP OI-weighted funding rate holds at 0.0010%, down from 0.0085% on Sunday. This drop suggests traders may be intentionally closing their long positions and piling into short positions, thereby depriving XRP of the tailwind needed to sustain its recovery.
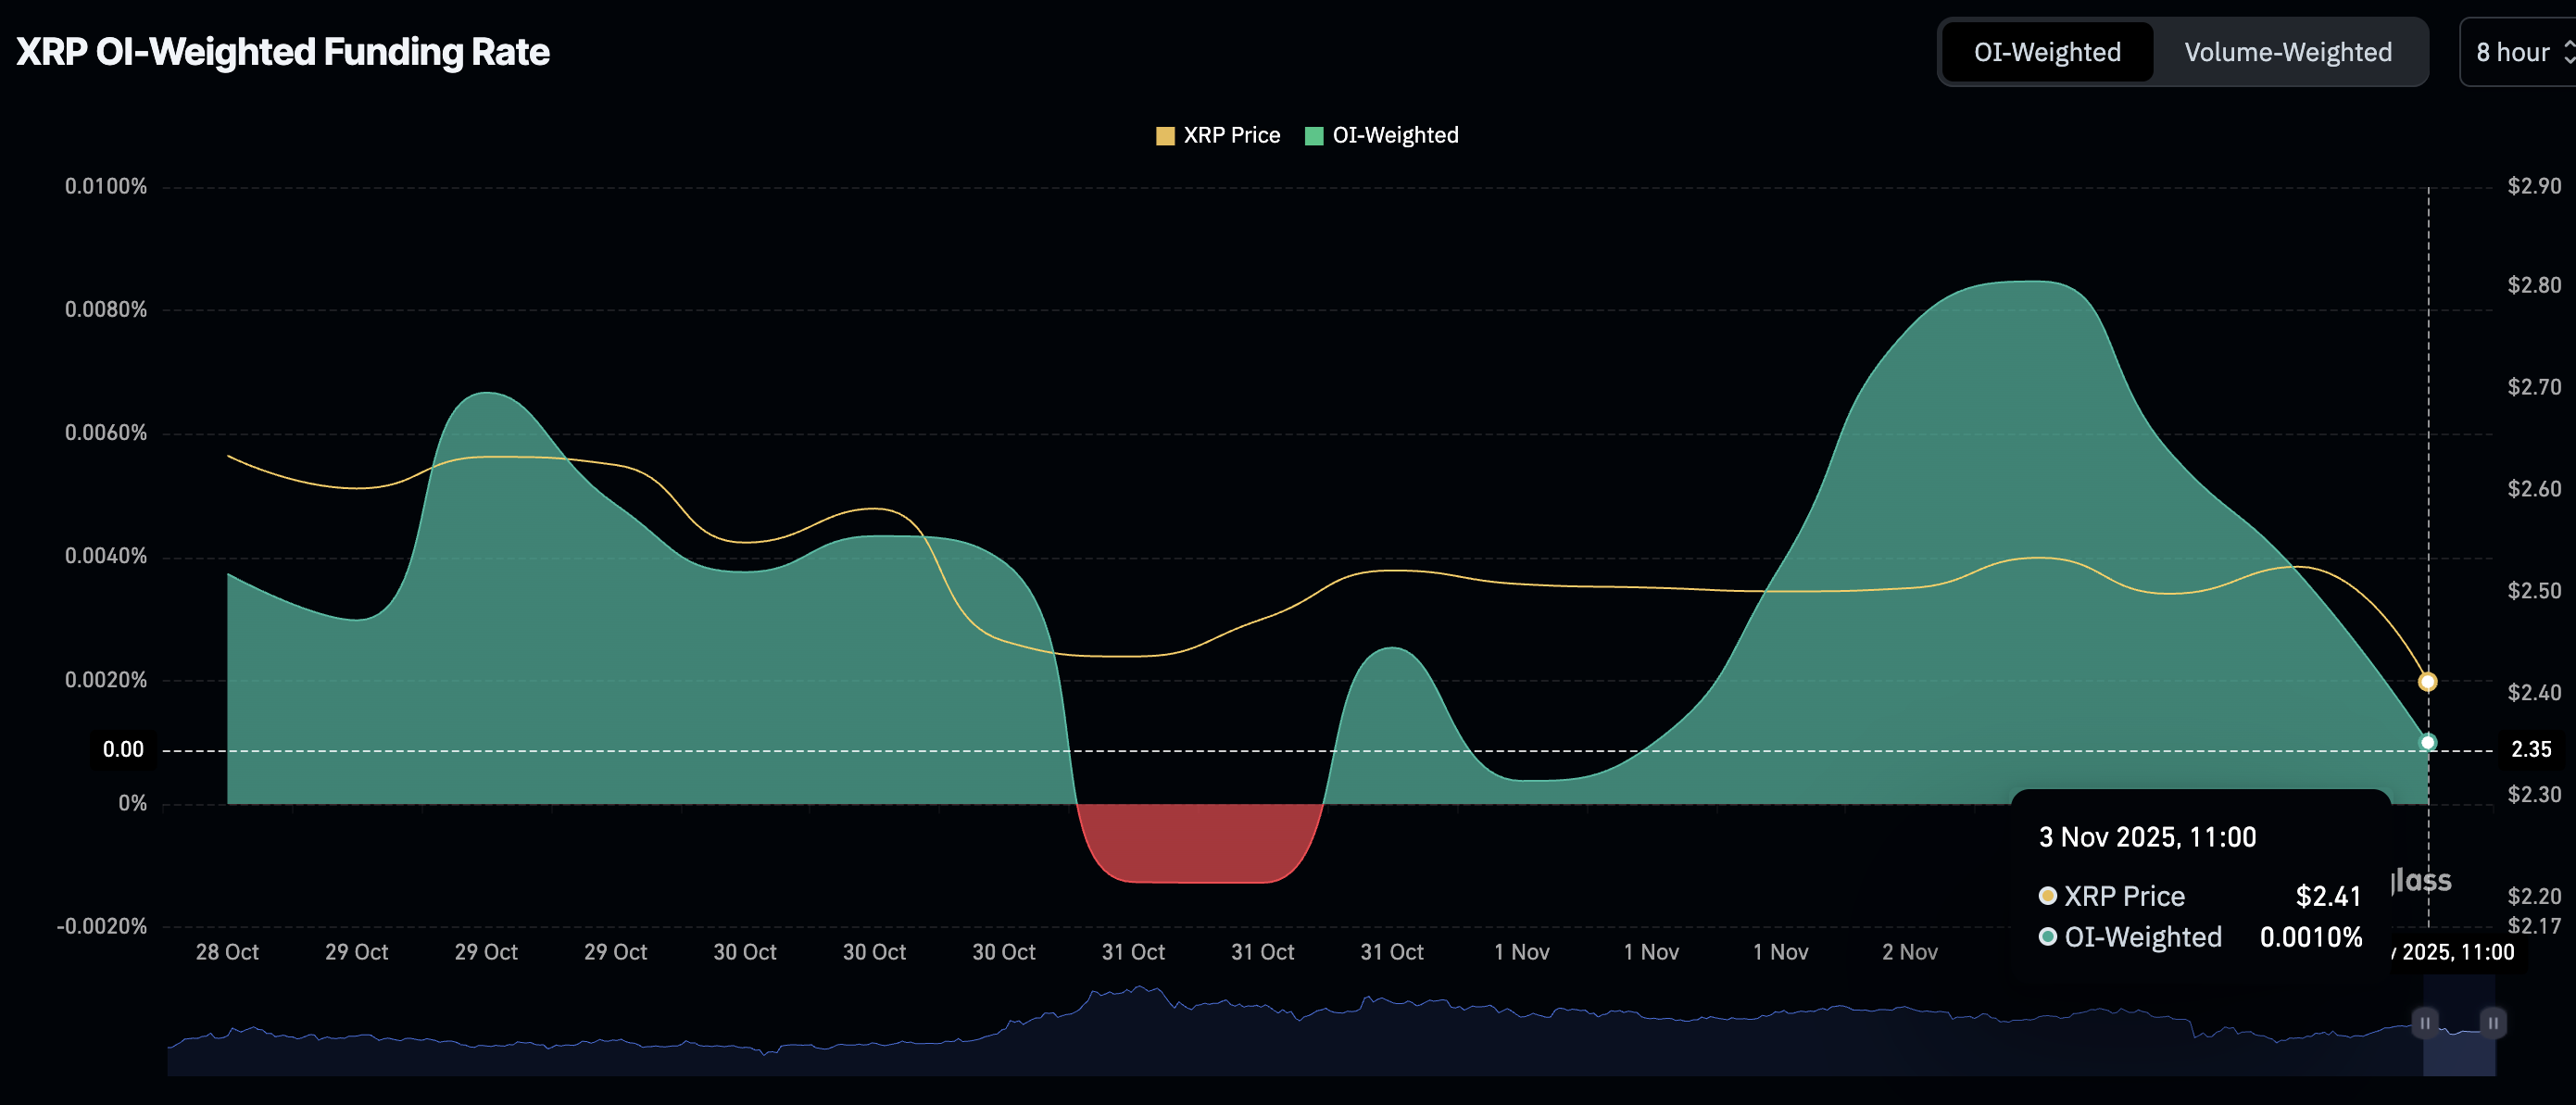
XRP OI-weighted funding rate | Source: CoinGlass
Technical outlook: Assessing XRP price above key support
XRP is largely in bearish hands, testing a short-term support at $2.40 at the time of writing on Monday. The Relative Strength Index (RSI) at 41 and falling toward oversold territory on the daily chart indicates that bearish momentum is increasing.
The Moving Average Convergence Divergence (MACD) indicator on the same daily chart will likely trigger a sell signal in upcoming sessions. Such a signal occurs when the blue MACD line crosses and settles below the red signal line, calling upon investors to reduce their risk exposure.
XRP’s position below key moving averages, including the 200-day Exponential Moving Average (EMA) at $2.60, the 50-day EMA at $2.64 and the 100-day EMA at $2.72, reinforces the bearish outlook.
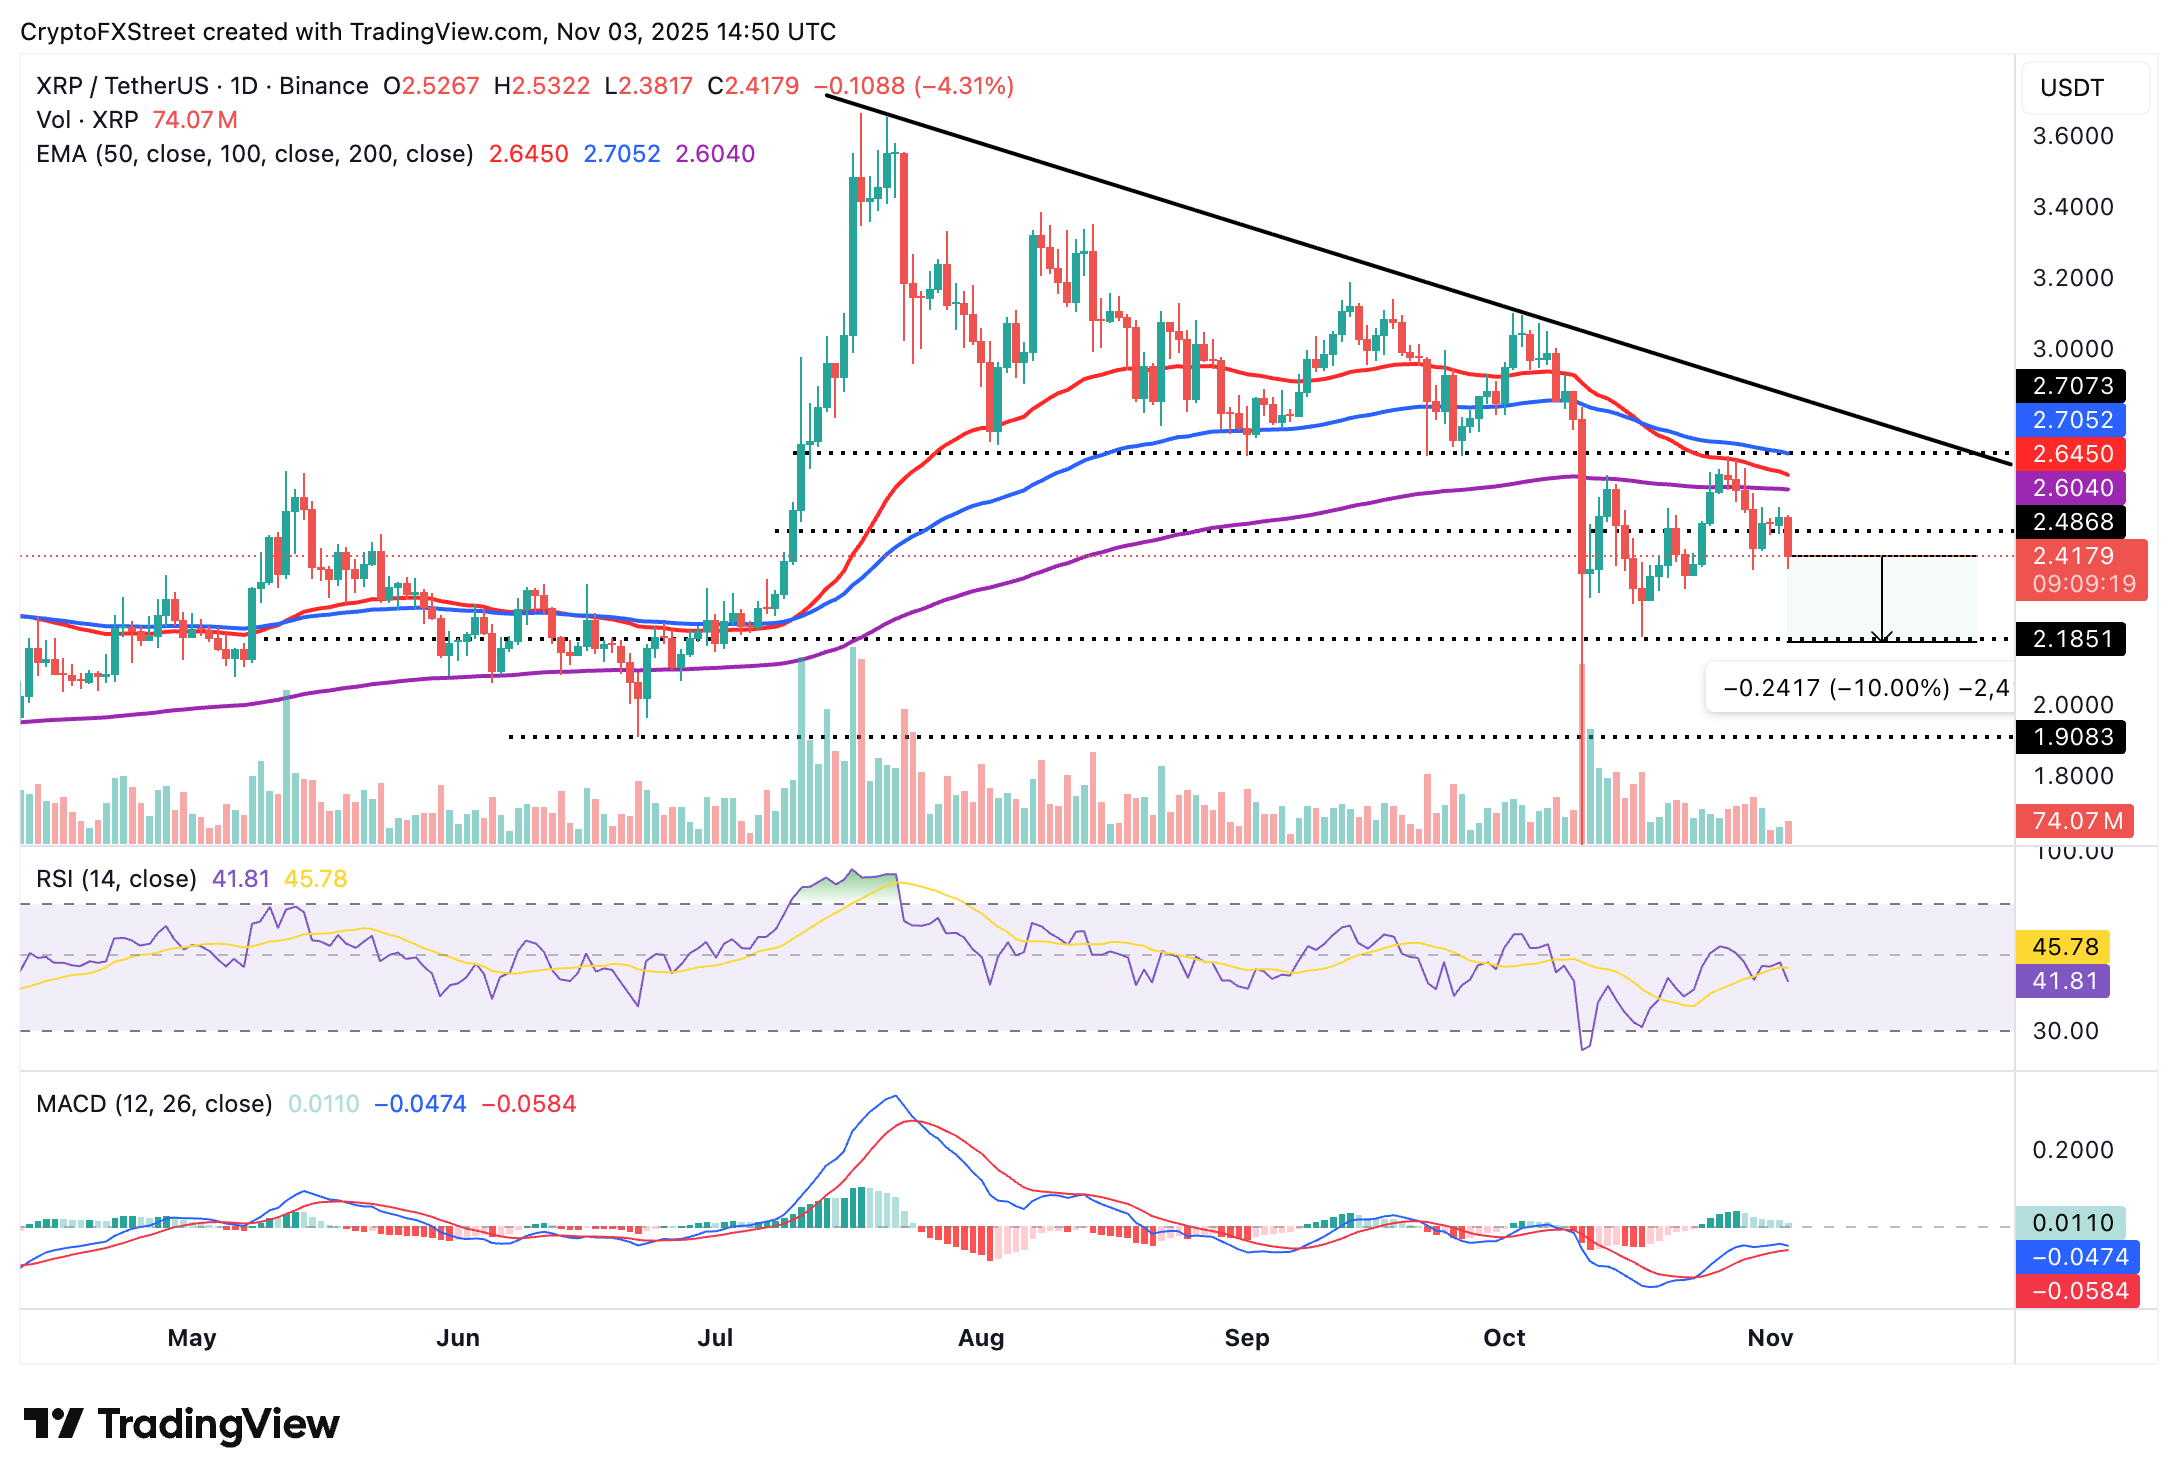
XRP/USDT daily chart
XRP is also staring at a 10% decline if its immediate support at $2.40 breaks. A daily close below this level may mean a prolonged bearish streak this week. Key areas of interest for traders are the support at $2.18, last tested on October 17, and $1.90, previously tested in June.
Still, traders cannot rule out a knee-jerk trend reversal if support at $2.40 holds, which could encourage investors to buy the dip. Key milestones that could mark the transition from bearish to bullish sentiment include a break above the 200-day EMA at $2.60, the 50-day EMA at $2.64, the 100-day EMA at $2.72 and the descending trendline, which has been in place since XRP achieved its new all-time high of $3.66 in July.
Cryptocurrency metrics FAQs
The developer or creator of each cryptocurrency decides on the total number of tokens that can be minted or issued. Only a certain number of these assets can be minted by mining, staking or other mechanisms. This is defined by the algorithm of the underlying blockchain technology. On the other hand, circulating supply can also be decreased via actions such as burning tokens, or mistakenly sending assets to addresses of other incompatible blockchains.
Market capitalization is the result of multiplying the circulating supply of a certain asset by the asset’s current market value.
Trading volume refers to the total number of tokens for a specific asset that has been transacted or exchanged between buyers and sellers within set trading hours, for example, 24 hours. It is used to gauge market sentiment, this metric combines all volumes on centralized exchanges and decentralized exchanges. Increasing trading volume often denotes the demand for a certain asset as more people are buying and selling the cryptocurrency.
Funding rates are a concept designed to encourage traders to take positions and ensure perpetual contract prices match spot markets. It defines a mechanism by exchanges to ensure that future prices and index prices periodic payments regularly converge. When the funding rate is positive, the price of the perpetual contract is higher than the mark price. This means traders who are bullish and have opened long positions pay traders who are in short positions. On the other hand, a negative funding rate means perpetual prices are below the mark price, and hence traders with short positions pay traders who have opened long positions.


