
Trade The World
Silver Price Forecast: XAG/USD eases from 14-Year high amid risk-on mood
作者 Vishal Chaturvedi
发布日期: 25 Jul 2025 | 修改日期: 25 Jul 2025


POPULAR ARTICLES

Silver (XAG/USD) corrects lower for a third day on Friday, easing to around $38.84 after hitting a fresh 14-year high of $39.53 earlier in the week.
- Silver eases below $39.00 on Friday after hitting a 14-year high of $39.53 earlier in the week.
- The pullback is driven by an improved risk appetite and a modest rebound in the US dollar.
- The RSI on the daily chart eases to 65, signaling a healthy cooldown from overbought territory.
Silver (XAG/USD) corrects lower for a third day on Friday, easing to around $38.84 after hitting a fresh 14-year high of $39.53 earlier in the week. The pullback reflects improved global risk sentiment and a modest rebound in the US Dollar (USD), as upbeat US macro data and signs of easing trade tensions dampen safe-haven demand. Despite the decline, the metal remains up nearly 1.70% so far this week, underscoring the strength of the broader bullish trend.
Silver (XAG/USD) Daily Timeframe
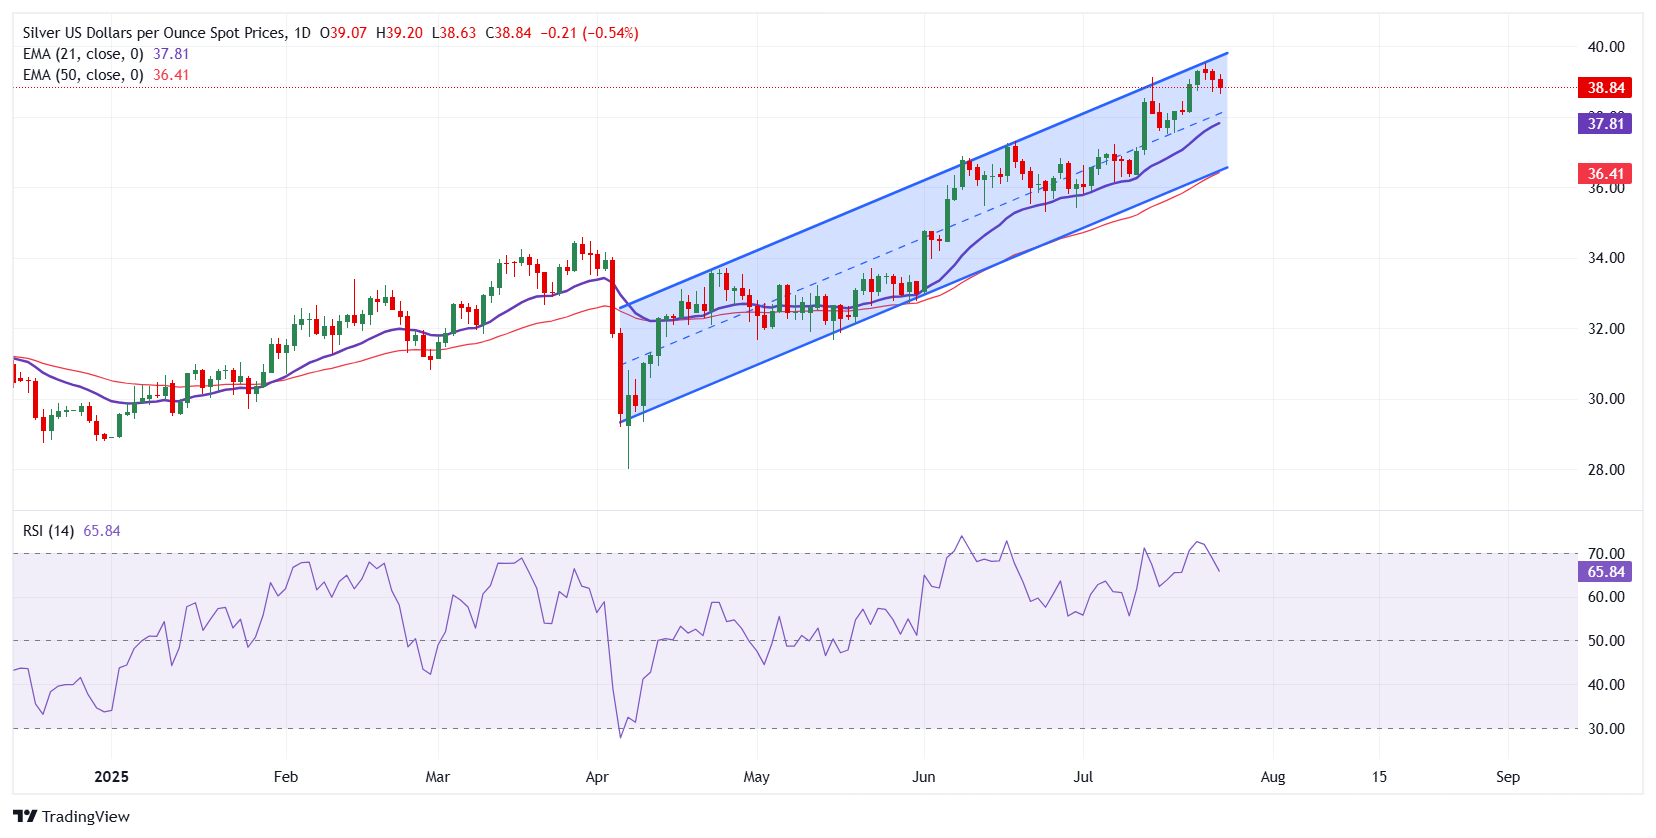
On the daily timeframe, Silver continues to trade within a well-established ascending channel that has contained price action since April. The metal remains comfortably above both the 21-day Exponential Moving Average (EMA) and the 50-day EMA. Both EMAs are sloping upwards, indicating that the bulls are still in control.
The Relative Strength Index (RSI) on the daily chart has eased to 65 from overbought levels, reflecting a healthy cooldown rather than a trend reversal.
Immediate support lies at $38.70, the July 22 low, followed by the psychological $38.00 mark. A break below these levels could accelerate the downside toward the 21-day EMA at $37.81. Further weakness may bring stronger support near $36.41, where the 50-day EMA aligns with the lower boundary of the ascending channel. On the upside, $39.00 now serves as the first hurdle, followed by $39.53 high of July 23.
A decisive move above this zone could reignite bullish momentum and pave the way for a test of the psychological $40.00 handle, with potential extension toward $42.00 and beyond.
Silver (XAG/USD) 1-Hour Chart
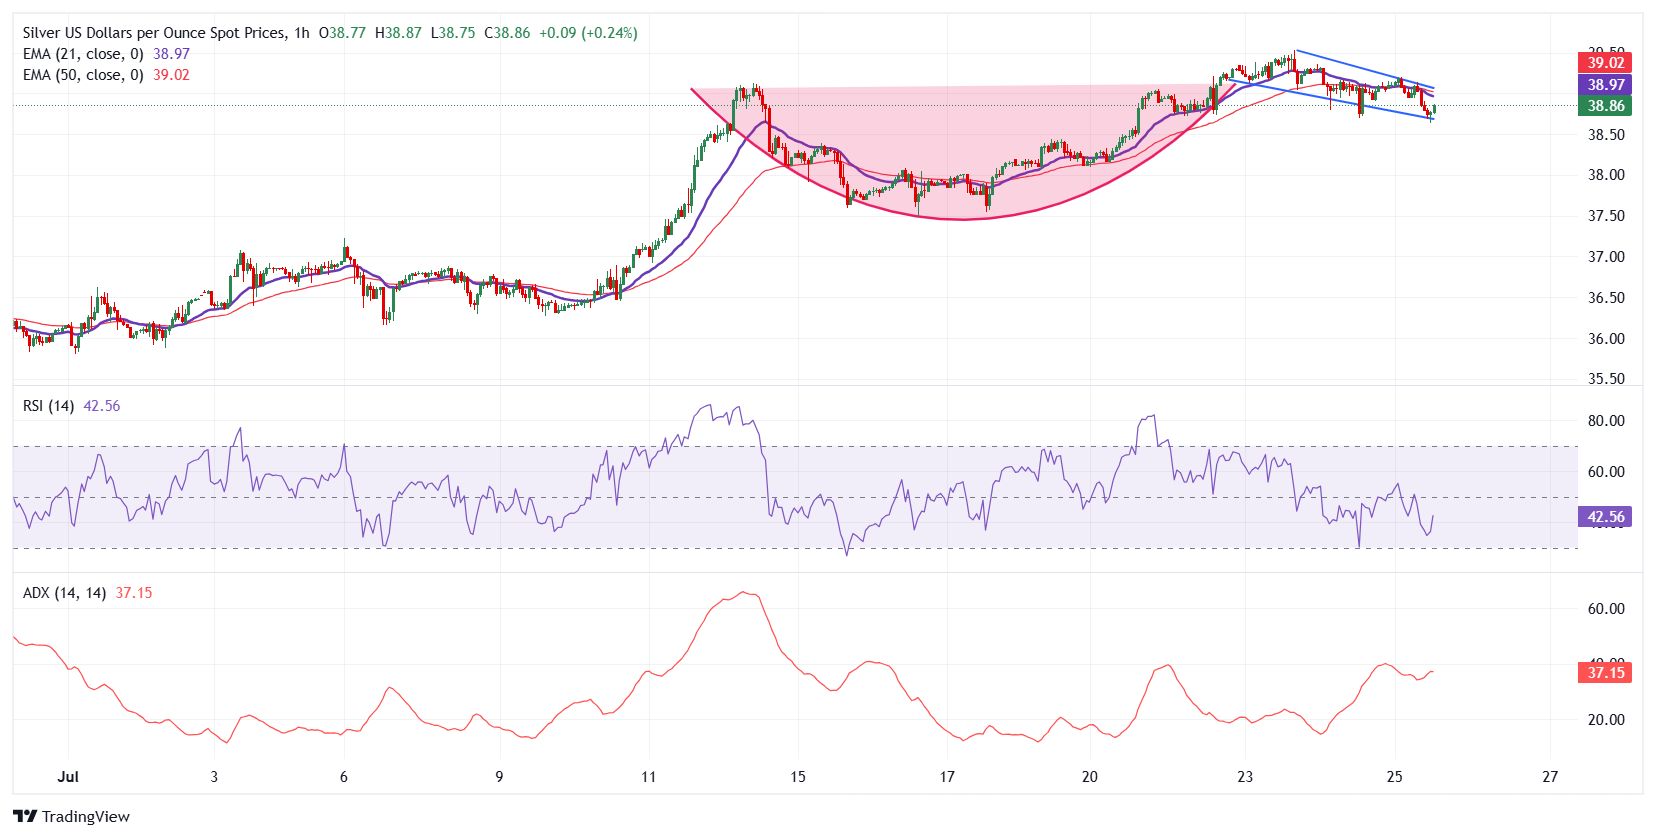
The hourly chart shows bearish pressure building, despite an earlier bullish setup. Silver recently carved out a classic cup-and-handle formation, with the handle forming as a falling wedge pattern — usually a bullish sign. However, the breakout attempt above the $39.00 mark lacked follow-through, and the price has since fallen back below the 21-period EMA at $38.96 and the 50-period EMA at $39.00. Notably, the 21-period EMA has now crossed below the 50-period EMA, now serving as immediate resistance.
On the downside, if the price breaks below the lower boundary of the handle formation, it could trigger further weakness toward $38.50 in the near term. The Relative Strength Index (RSI) on the hourly chart has also retreated to near 41, reflecting fading intraday momentum and a possible consolidation phase. Meanwhile, the Average Directional Index (ADX) remains elevated at around 37, indicating a still-active trend, although the loss of upward follow-through signals is growing caution among bulls.
Silver FAQs
Silver is a precious metal highly traded among investors. It has been historically used as a store of value and a medium of exchange. Although less popular than Gold, traders may turn to Silver to diversify their investment portfolio, for its intrinsic value or as a potential hedge during high-inflation periods. Investors can buy physical Silver, in coins or in bars, or trade it through vehicles such as Exchange Traded Funds, which track its price on international markets.
Silver prices can move due to a wide range of factors. Geopolitical instability or fears of a deep recession can make Silver price escalate due to its safe-haven status, although to a lesser extent than Gold's. As a yieldless asset, Silver tends to rise with lower interest rates. Its moves also depend on how the US Dollar (USD) behaves as the asset is priced in dollars (XAG/USD). A strong Dollar tends to keep the price of Silver at bay, whereas a weaker Dollar is likely to propel prices up. Other factors such as investment demand, mining supply – Silver is much more abundant than Gold – and recycling rates can also affect prices.
Silver is widely used in industry, particularly in sectors such as electronics or solar energy, as it has one of the highest electric conductivity of all metals – more than Copper and Gold. A surge in demand can increase prices, while a decline tends to lower them. Dynamics in the US, Chinese and Indian economies can also contribute to price swings: for the US and particularly China, their big industrial sectors use Silver in various processes; in India, consumers’ demand for the precious metal for jewellery also plays a key role in setting prices.
Silver prices tend to follow Gold's moves. When Gold prices rise, Silver typically follows suit, as their status as safe-haven assets is similar. The Gold/Silver ratio, which shows the number of ounces of Silver needed to equal the value of one ounce of Gold, may help to determine the relative valuation between both metals. Some investors may consider a high ratio as an indicator that Silver is undervalued, or Gold is overvalued. On the contrary, a low ratio might suggest that Gold is undervalued relative to Silver.

FXStreet
超过一百万用户依赖 FXStreet 获取实时市场数据、图表工具、专家洞见和外汇新闻。其全面的经济日历和教育网络研讨会帮助交易者保持信息领先、做出审慎决策。FXStreet 拥有约 60 人的团队,分布在巴塞罗那总部及全球各地区。
Read More


