
Trade The World
Solana-based Raydium and Jupiter extend rally as TVL, Open Interest surge
作者 Vishal Dixit
发布日期: 12 Sep 2025 | 修改日期: 12 Sep 2025


POPULAR ARTICLES

Decentralized Finance (DeFi) protocols such as Raydium (RAY) and Jupiter (JUP) rank among the top performers in the broader cryptocurrency market on Friday, fueled by the Solana (SOL) rally.
- Raydium extends the gains for the third consecutive day following a bounce off a key support trendline.
- Jupiter exceeds the 200-day EMA with bulls targeting further recovery to $0.65.
- TVL and derivatives data suggest increased demand among users and traders.
Decentralized Finance (DeFi) protocols such as Raydium (RAY) and Jupiter (JUP) rank among the top performers in the broader cryptocurrency market on Friday, fueled by the Solana (SOL) rally. The technical outlook suggests further recovery in Raydium and Jupiter underpinned by increased retail demand on the respective platforms and derivatives markets.
Rising TVL and Open Interest flash bullish potential
A surge in demand for the Solana-based protocols and the derivatives market indicates a rise in retail demand. DeFiLlama data shows that the Total Value Locked (TVL) on the Raydium and Jupiter have surged to $2.578 billion and $3.580 billion, respectively. This increase in assets deposited on the DeFi protocols reflects a rise in liquidity and network growth.
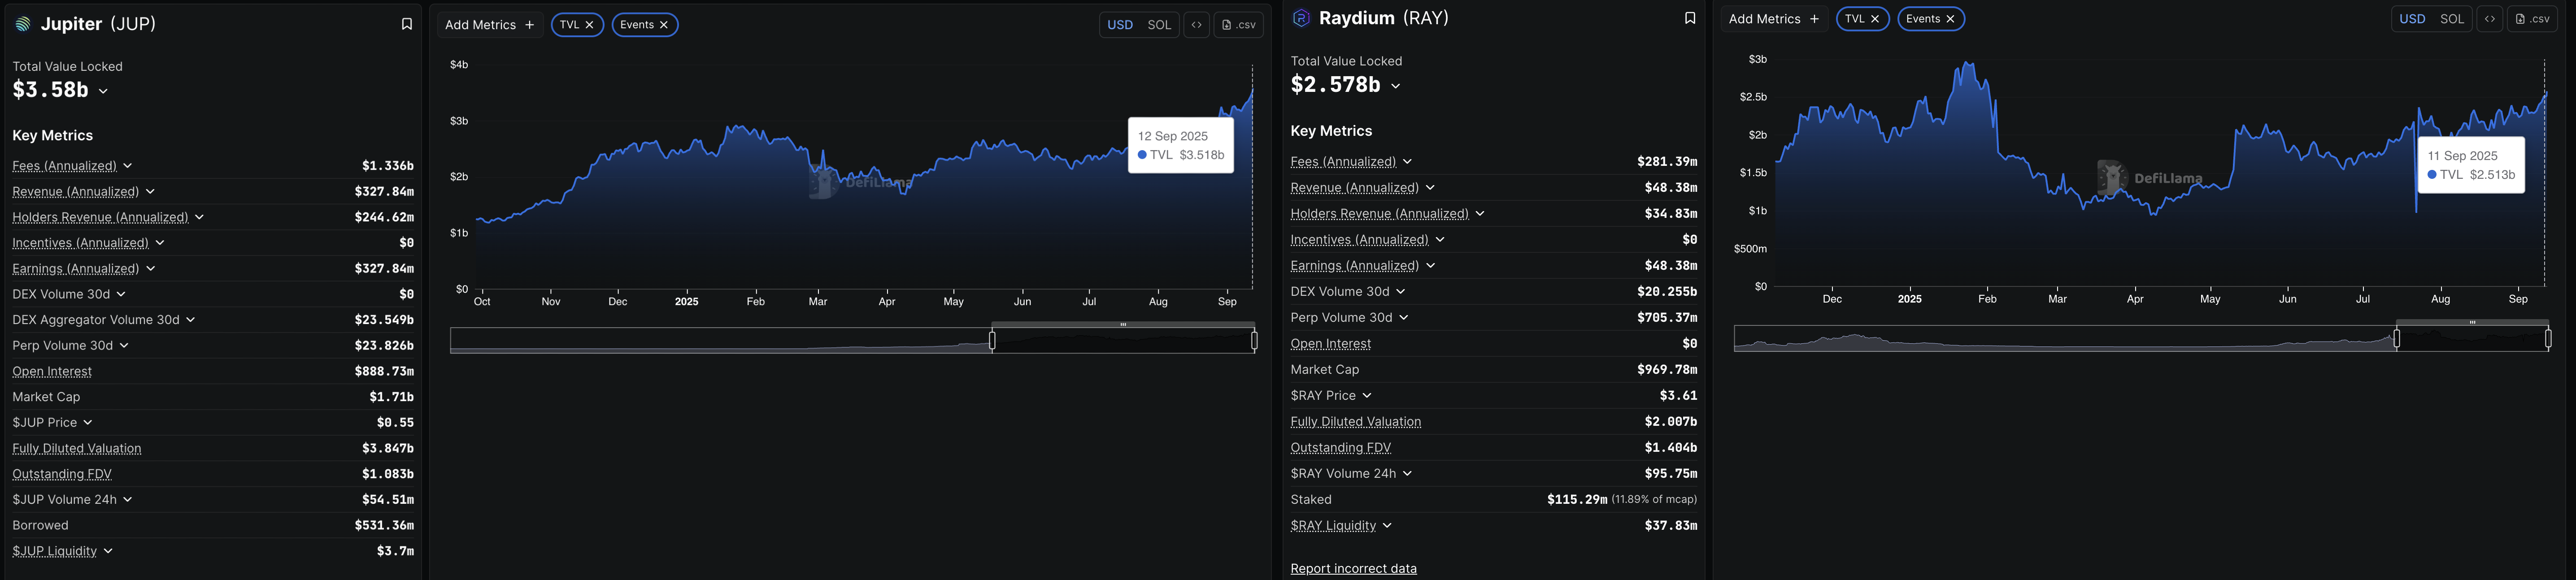
Total Value Locked on Raydium and Jupiter. Source: DeFiLlama
Meanwhile, CoinGlass data indicates that the Raydium and Jupiter Open Interest (OI) surged by 5% and 12% over the last 24 hours, respectively. This increase in capital inflows into RAY and JUP derivatives boosted the OI to $40.67 million and $165.17 million, respectively, which suggests heightened traders' confidence.
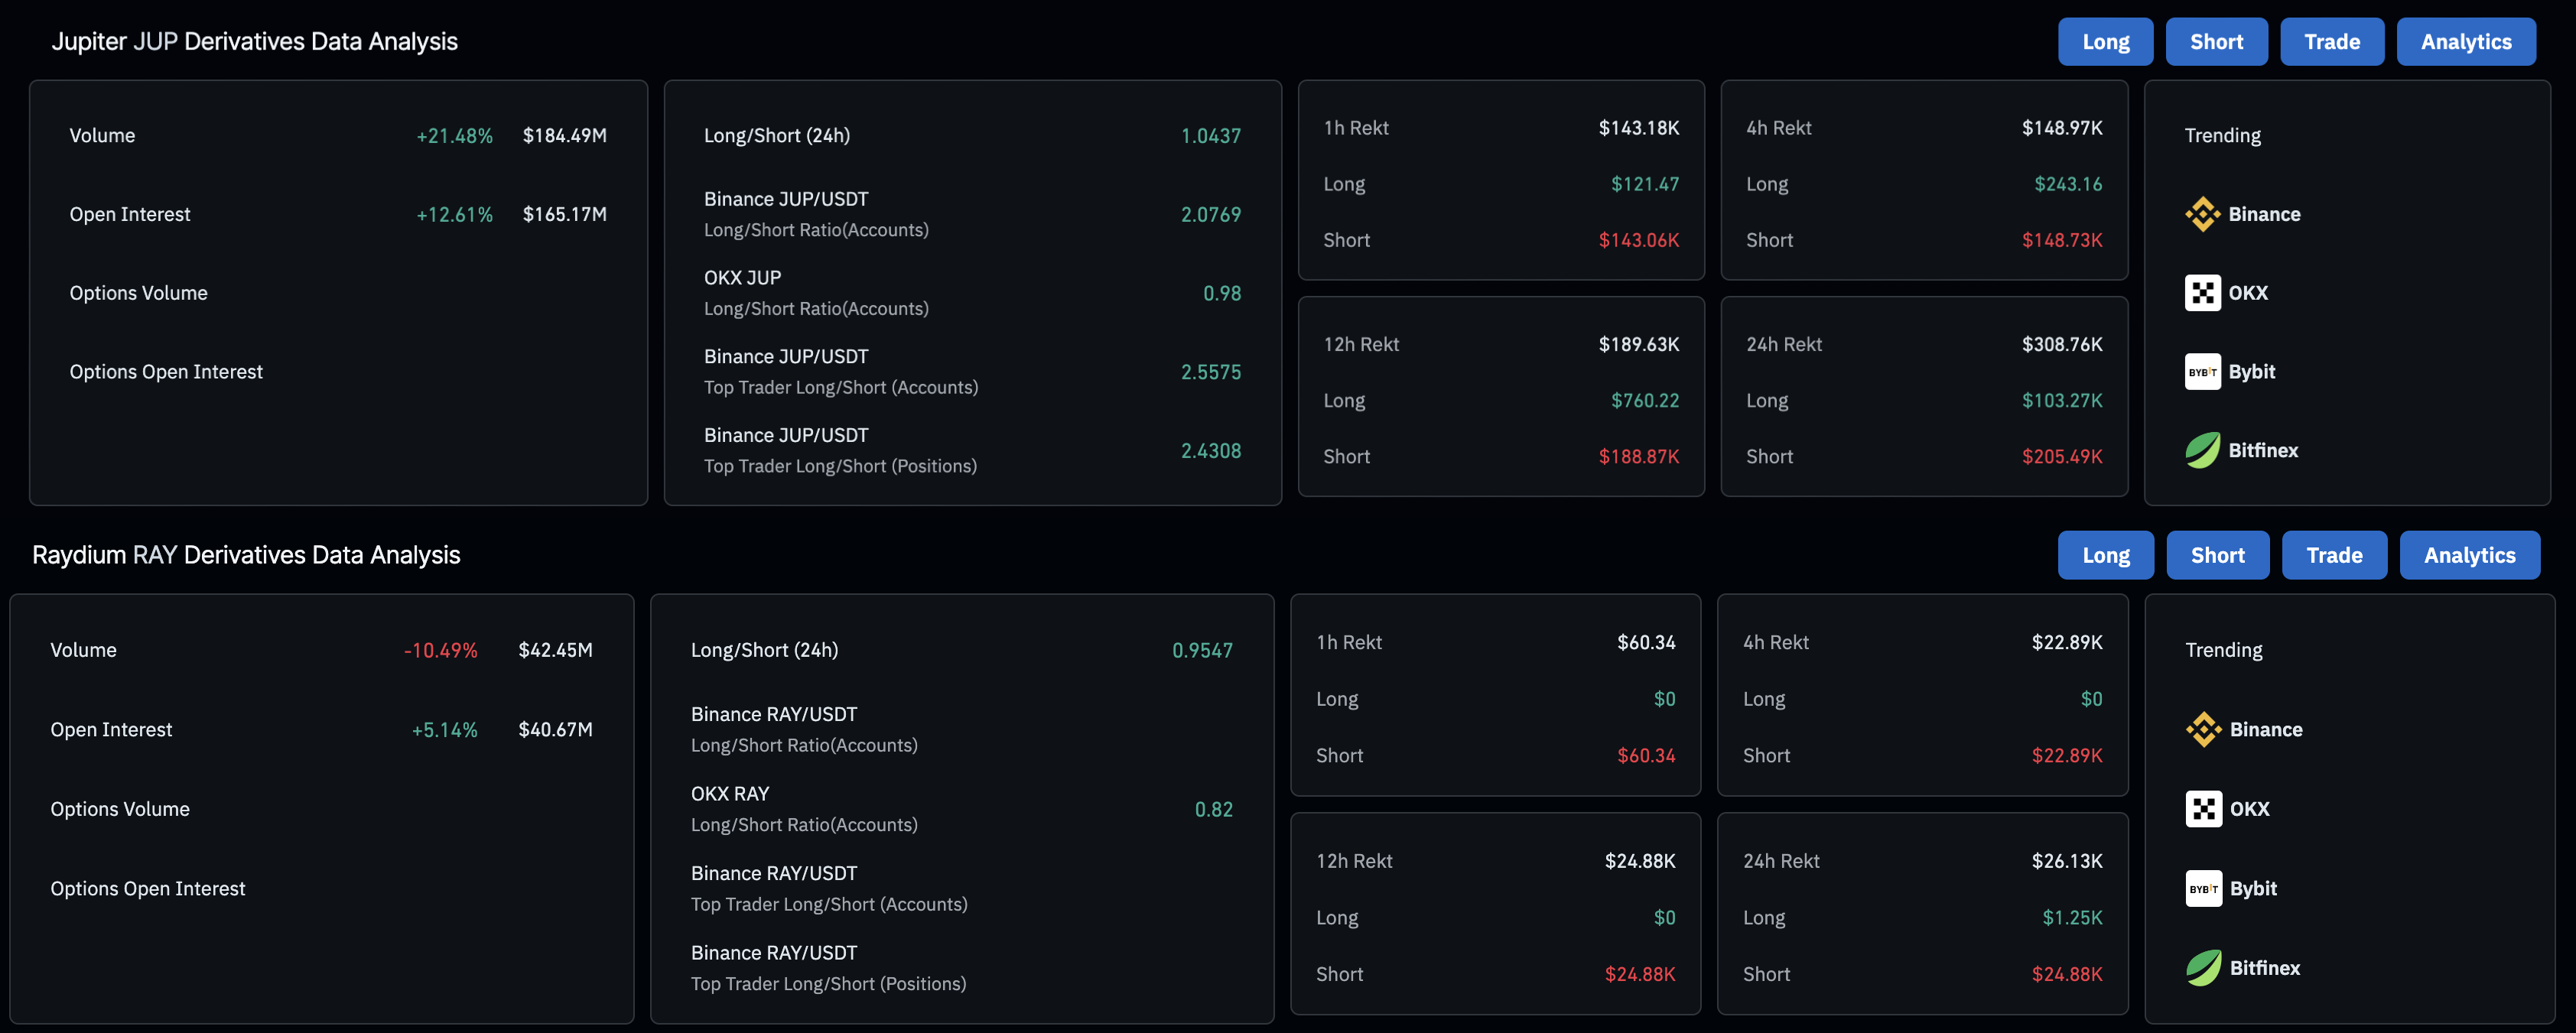
Raydium and Jupiter derivatives. Source: Coinglass
Raydium and Jupiter are poised for further recovery
Raydium edges higher by 4% at press time on Friday, extending the bounce off from the 50-day Exponential Moving Average (EMA) at $3.247. The Solana-based DEX token recovery targets the $3.960 supply zone, acting as the overhead trendline.
A decisive close above this level could extend the rally to the 61.8% Fibonacci retracement level at $4.315, followed by the 78.6% Fibonacci retracement level at $5.874.
The Moving Average Convergence Divergence (MACD) crossed above its signal line on the daily chart, giving a buy signal and indicating a surge in bullish momentum. Additionally, the Relative Strength Index (RSI) at 60 extends the upward trend, indicating further space for growth before reaching overbought levels.
Looking down, if RAY fails to cross above $3.960, a potential reversal could test the 50% Fibonacci retracement level at $3.475.
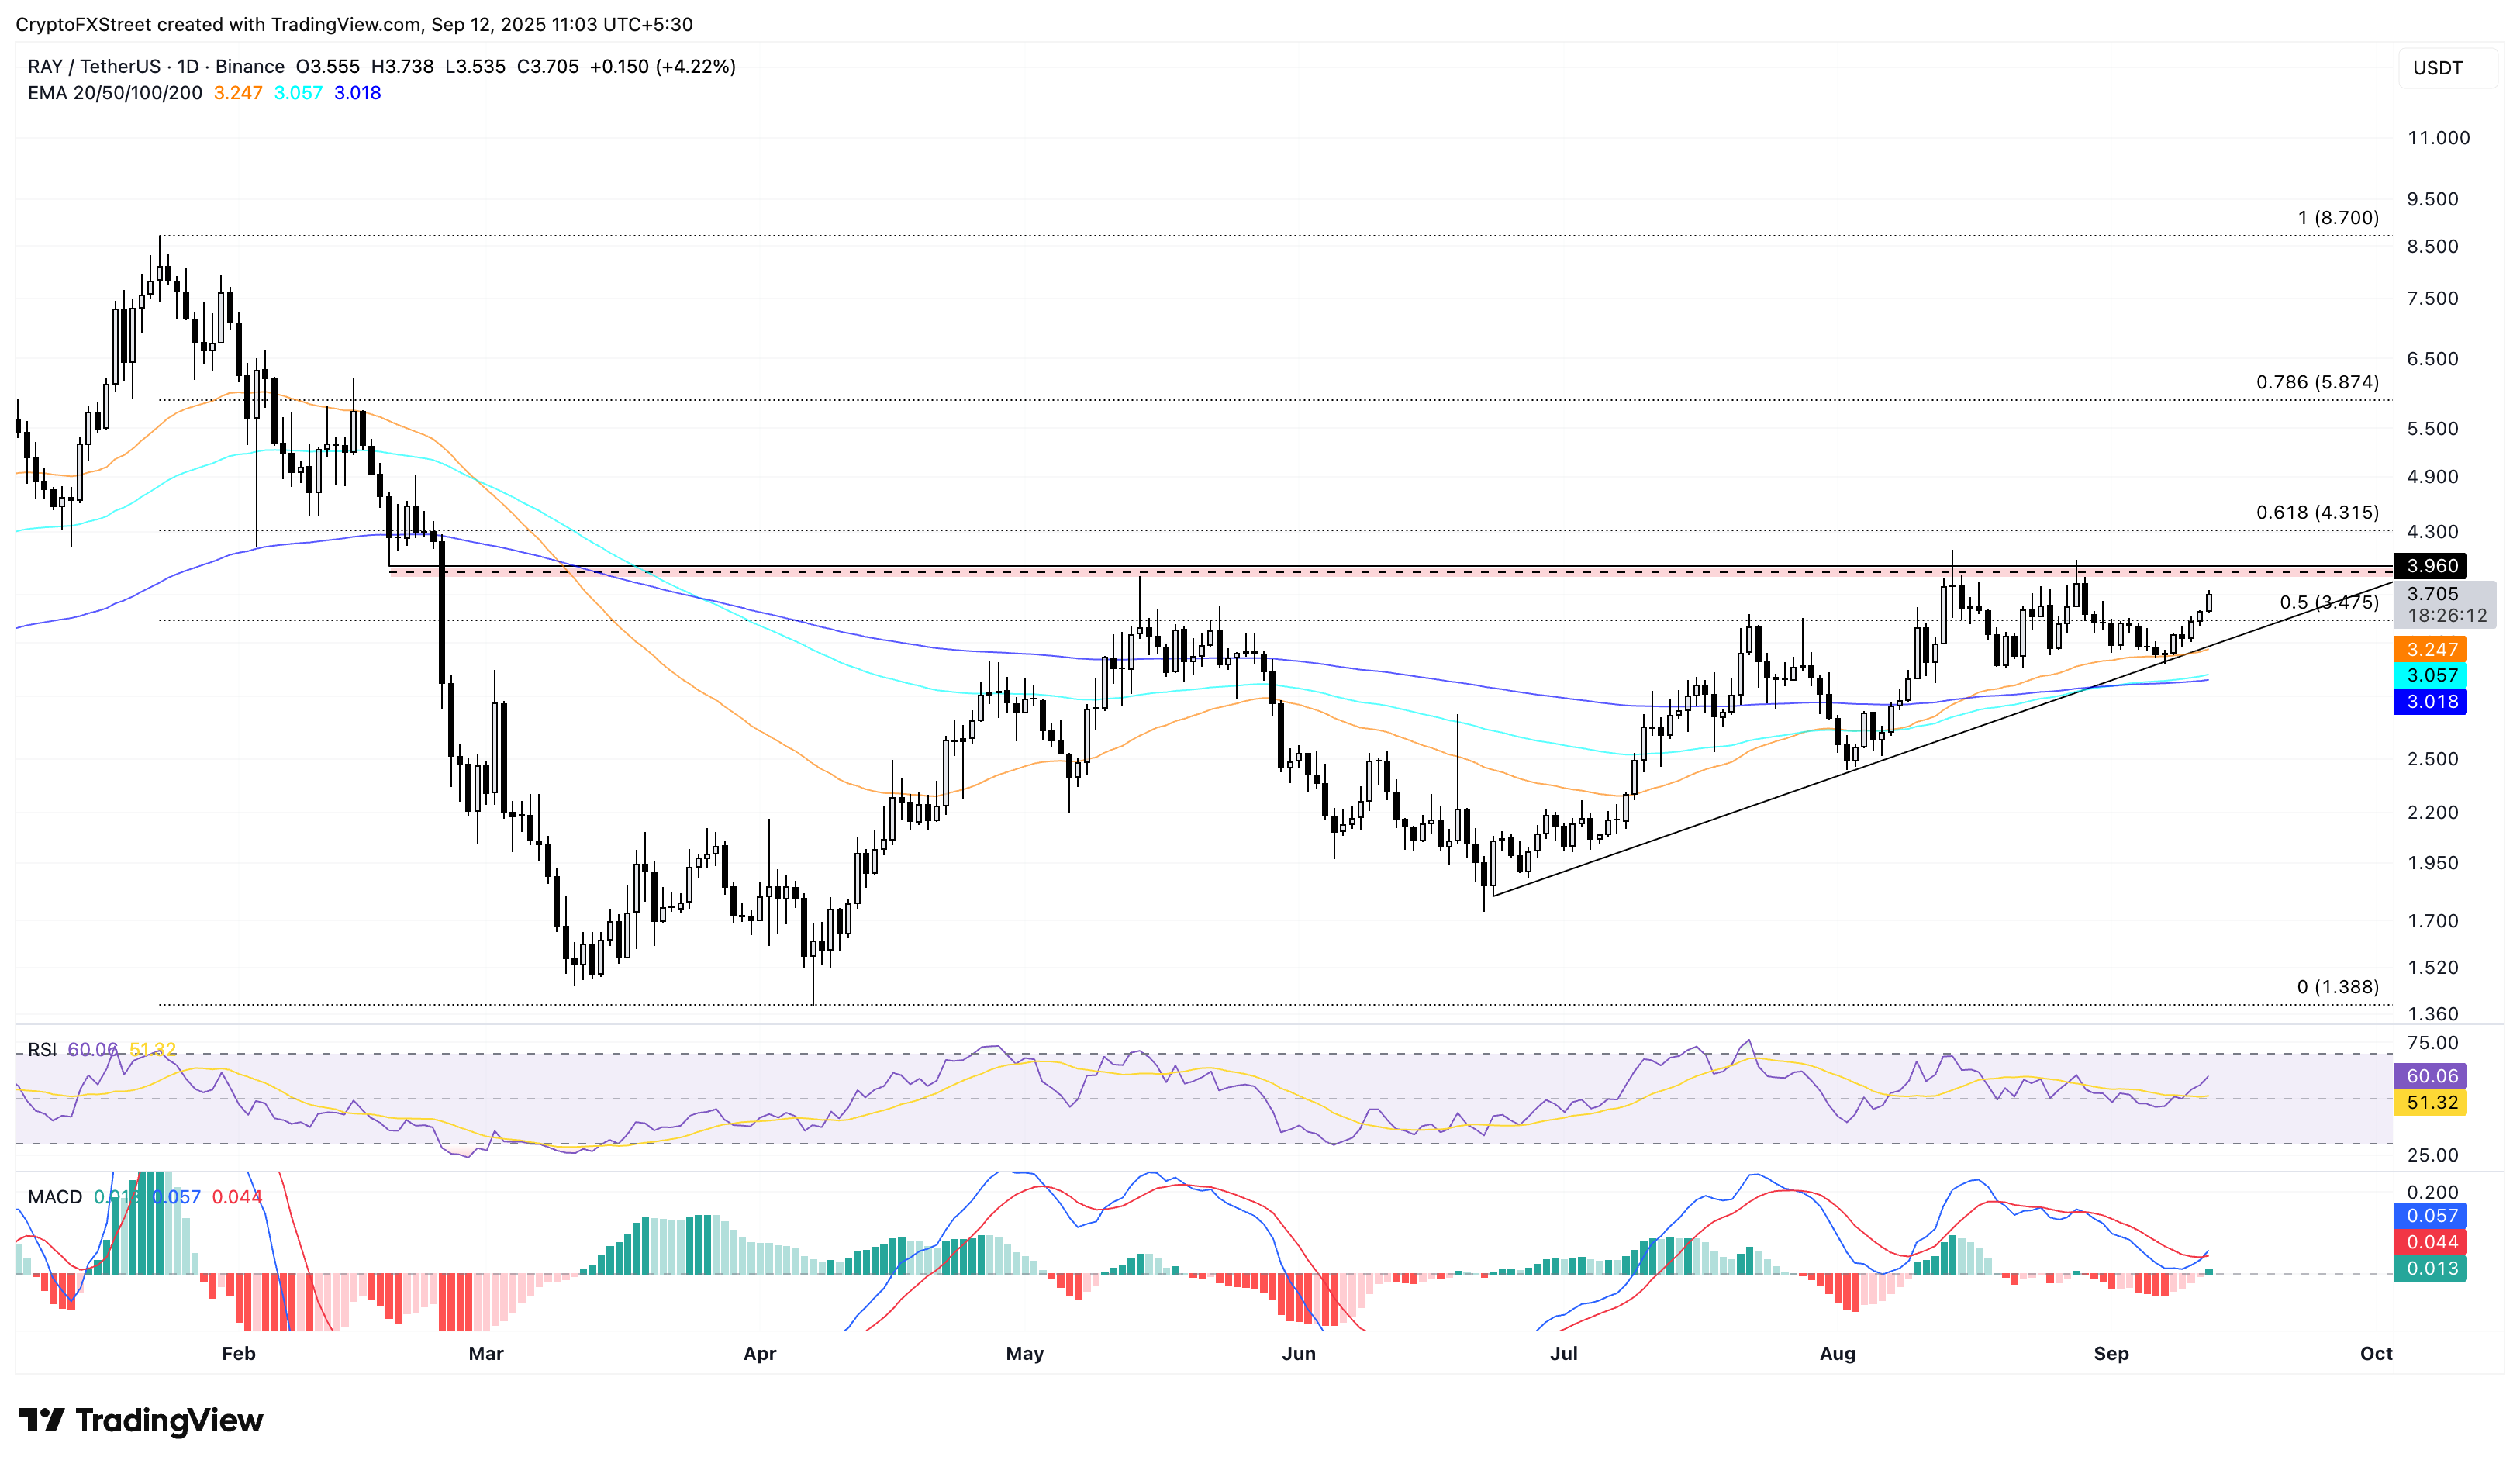
RAY/USDT daily price chart.
On the other hand, Jupiter also maintains a bullish outlook with a 5% surge at press time on the day, marking the sixth consecutive day of gains. The recovery run exceeds the 200-day EMA at $0.5532, with bulls targeting the $0.6339 mark, last tested on July 23.
Adding to the bullish potential, the MACD and signal line rise with successive green histogram bars on the daily chart, showing increased trend momentum. The RSI upsurge to 64 indicates a boost in buying pressure.
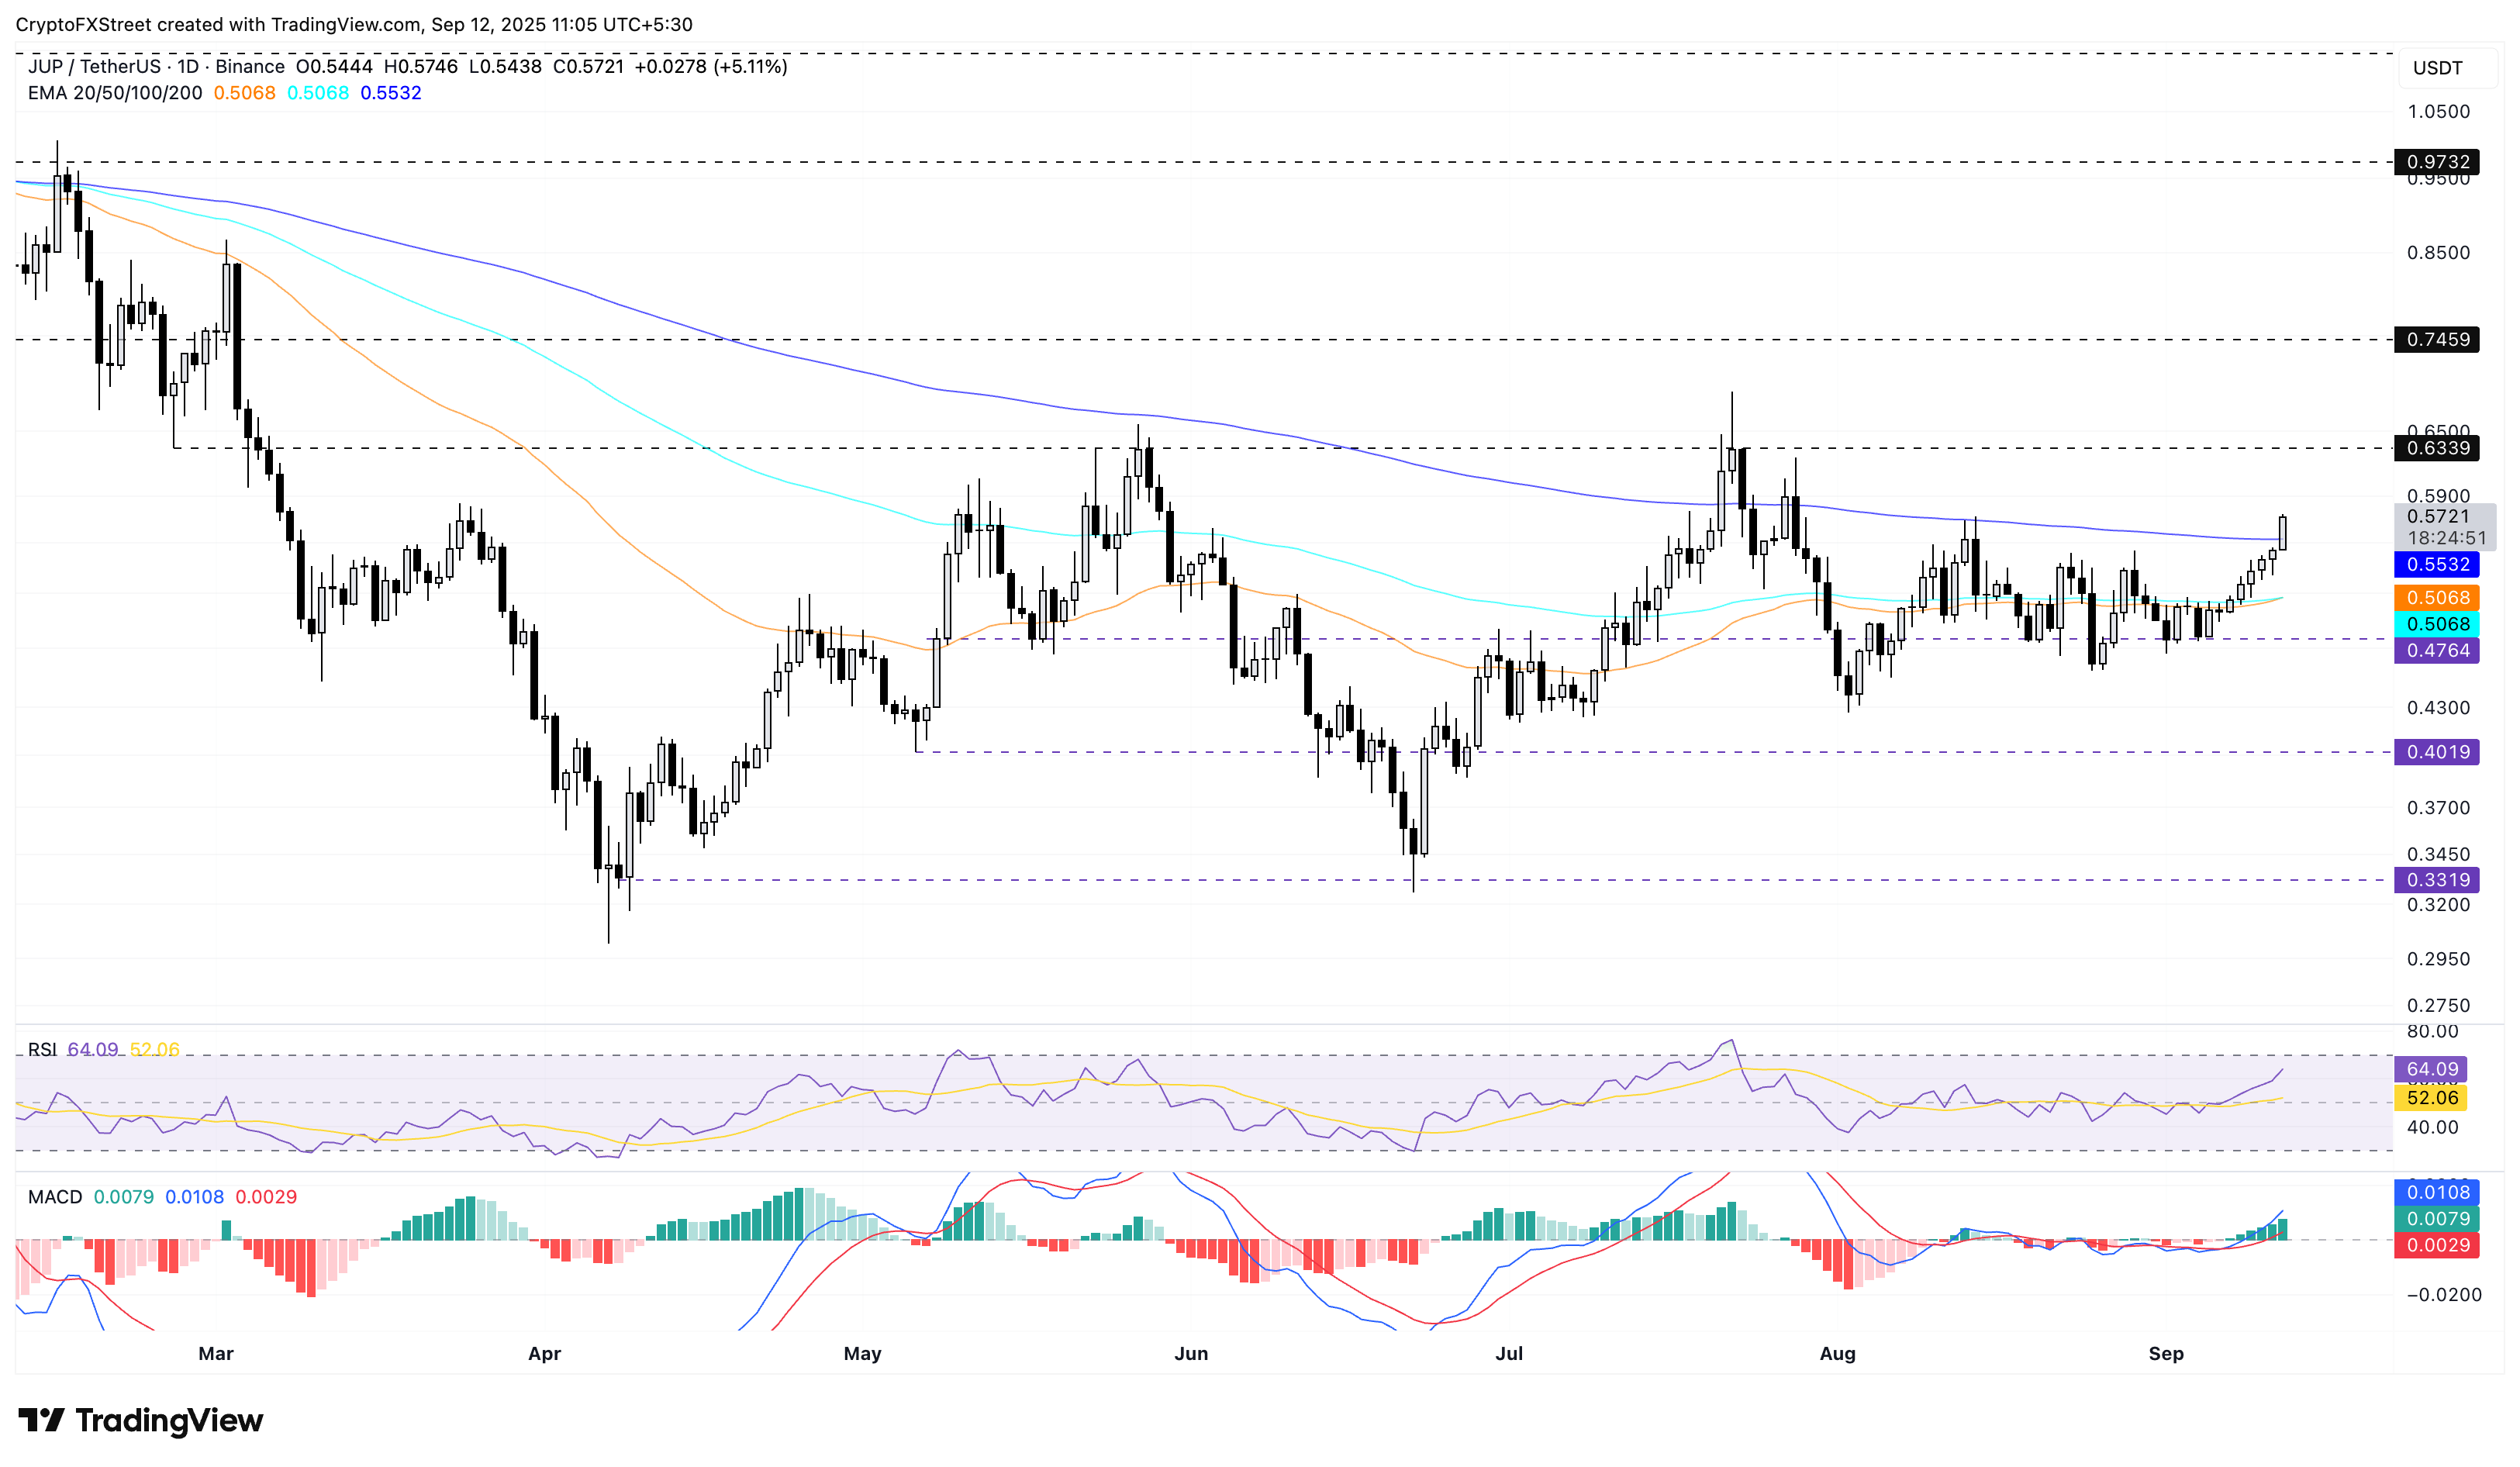
JUP/USDT daily price chart.
On the downside, a reversal under the 200-day EMA would invalidate the bullish potential, which could result in a decline to the 100-day EMA at $0.5068.

FXStreet
超过一百万用户依赖 FXStreet 获取实时市场数据、图表工具、专家洞见和外汇新闻。其全面的经济日历和教育网络研讨会帮助交易者保持信息领先、做出审慎决策。FXStreet 拥有约 60 人的团队,分布在巴塞罗那总部及全球各地区。
Read More


