
Trade The World
Solana Price Forecast: SOL dips below $180 as bearish momentum builds across key metrics
作者 Manish Chhetri
发布日期: 25 Jul 2025 | 修改日期: 25 Jul 2025


POPULAR ARTICLES

Solana (SOL) price extends its losses, trading below $180 at the time of writing on Friday after closing below its key support level the previous day.
- Solana price extends its losses on Friday after closing below its daily support level at $184.13 the previous day.
- CoinGlass data show that more than $57 million was liquidated, with 86.79% of them being longs, in the last 24 hours.
- CryptoQuant data show that SOL’s Spot Taker CVD is negative and decreasing, signaling sell-side dominance.
Solana (SOL) price extends its losses, trading below $180 at the time of writing on Friday after closing below its key support level the previous day. This price correction on SOL has triggered a wave of liquidation exceeding $57 million, with 86.79% of the liquidations being long positions, in the last 24 hours. Adding to this bearish outlook, on-chain data indicate that bears are taking control, suggesting a further correction ahead.
Why is SOL falling?
Solana started the week on a positive note, reaching its February 14 high of $205.34 on Tuesday. However, during the mid-week, it failed to maintain this bullish momentum and declined nearly 12% until Thursday.
This sharp fall in SOL price triggered a wave of liquidation, resulting in a total of $101.38 million in leveraged positions from Wednesday to early Friday, according to Coinglass data. Moreover, in the last 24 hours, more than $57 million positions were liquidated, with 86.79% of them being longs, indicating overly bullish positioning.
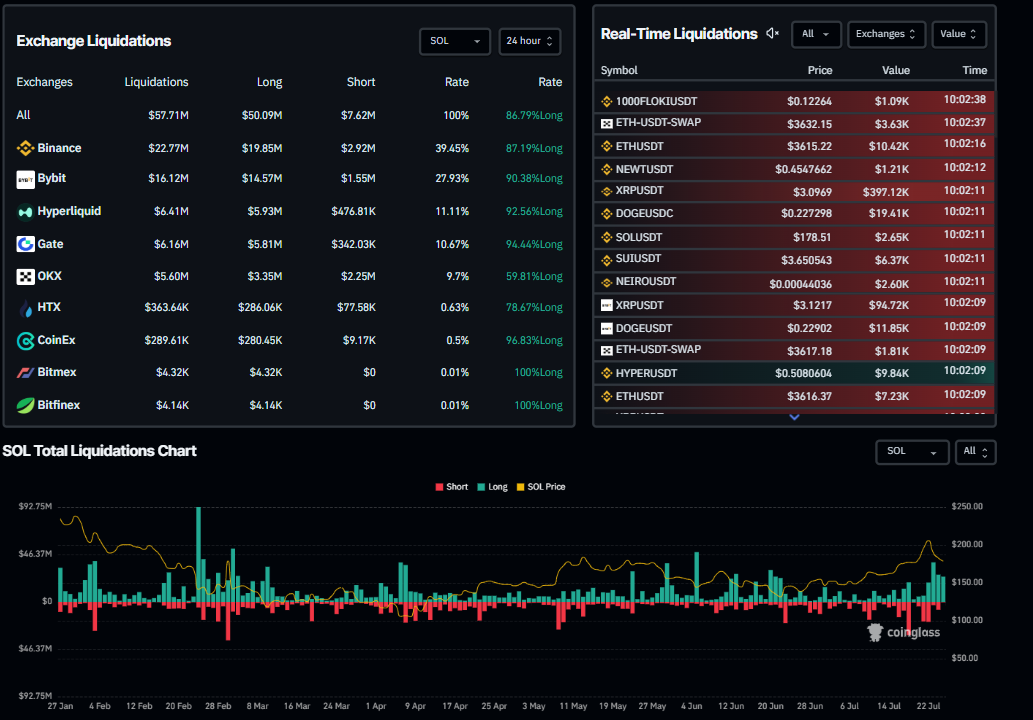
SOL Total Liquidation chart. Source: Coinglass
CryptoQuant data, as illustrated in the graph below, indicates increased selling pressure on SOL. The Taker CVD (Cumulative Volume Delta) for SOL flipped negative on Wednesday, suggesting that bears are taking control of the momentum. This indicator measures the cumulative difference between market buy and sell volumes over a three-month period. When a 90-day CVD is positive and increasing, it suggests the Taker Buy Dominant Phase, while a negative and decreasing value indicates the Taker Sell Dominant Phase. If this ongoing negative trend continues, the SOL price could decline further.
-1753422545900.png)
AVAX Spot Taker CVD chart. Source: CryptoQuant
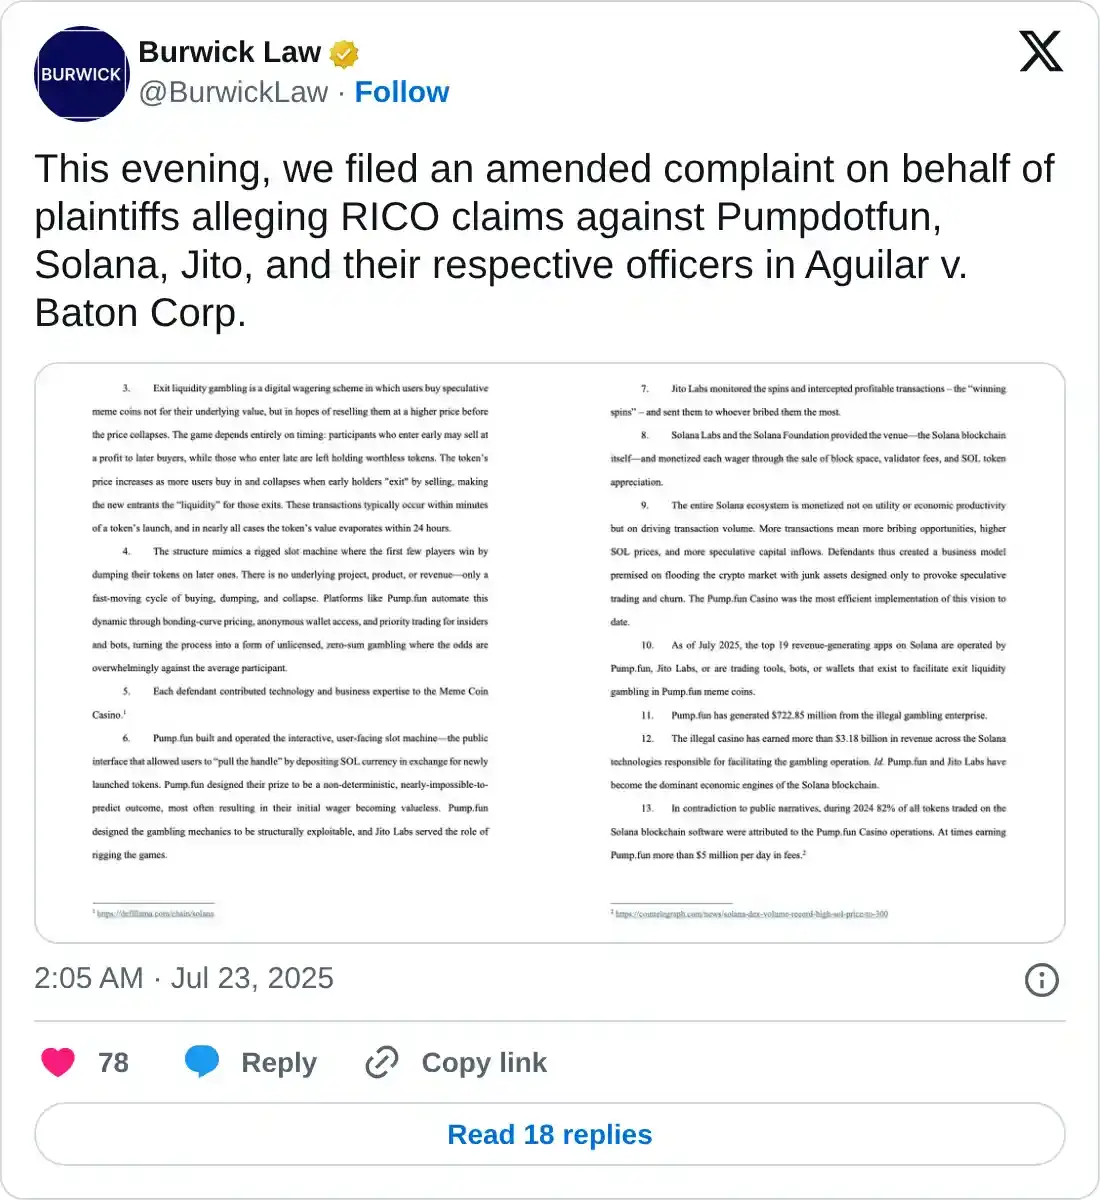
Adding to the bearish narrative, on Wednesday, law firm Burwick Law filed a class-action lawsuit in the Southern District of New York against the Solana-based memecoin creator, Pump.Fun.
Burwick Law said, “We filed an amended complaint on behalf of plaintiffs alleging RICO claims against Pumpdotfun, Solana, Jito, and their respective officers in Aguilar v. Baton Corp.”
The suit describes Pump.Fun as merely the front-facing slot machine cabinet, operated as part of a broader illegal gambling and money transmission scheme engineered and maintained jointly by the Pump.Fun, Jito Labs, Jito Foundation, Solana Labs, and the Solana Foundation.
Solana Price Forecast: SOL bears aiming for $160 mark
Solana price rallied and reached its February 14 high of $205.34 on Tuesday, but faced rejection from this level. It declined by nearly 12% over the next two days, closing below its daily support level at $184.13 on Thursday. At the time of writing on Friday, it continues to trade down at around $178.81.
If SOL continues its pullback, it could extend the decline to retest its next daily support at $160.
The Relative Strength Index (RSI) on the daily chart reads 56, having fallen sharply from its overbought levels on Tuesday, indicating a fading of bullish momentum. Moreover, the Moving Average Convergence Divergence (MACD) indicator is also converging closer together, and the green histogram bars are also falling, further indicating a fading bullish momentum.
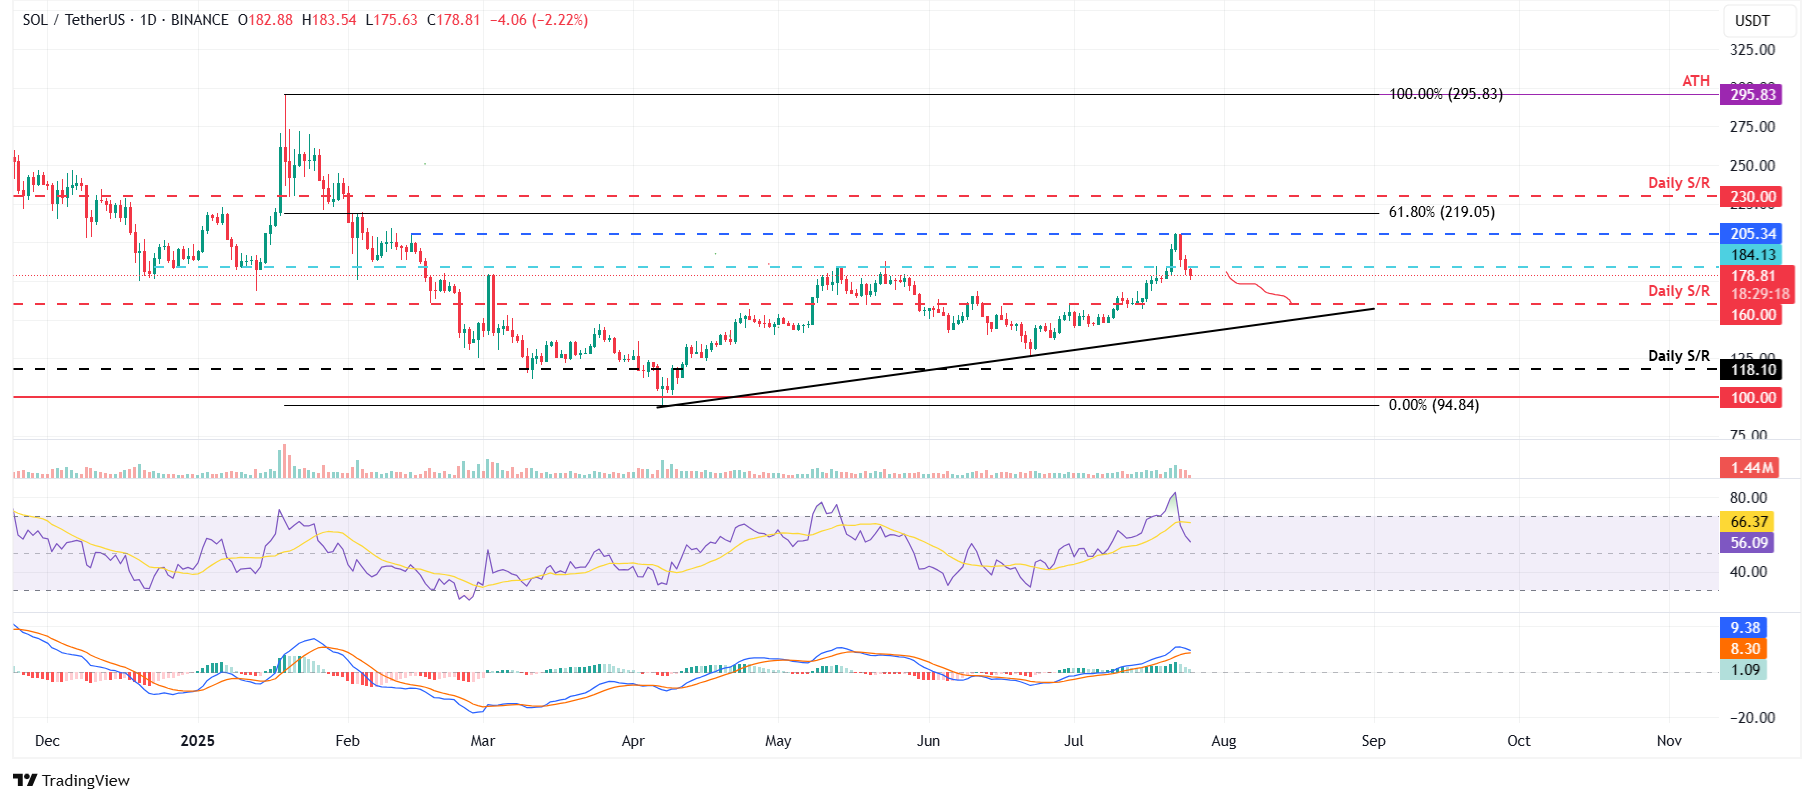
SOL/USDT daily chart
If SOL recovers and closes above the daily resistance at $184.13, it could extend the recovery toward the next resistance at $205.34

FXStreet
超过一百万用户依赖 FXStreet 获取实时市场数据、图表工具、专家洞见和外汇新闻。其全面的经济日历和教育网络研讨会帮助交易者保持信息领先、做出审慎决策。FXStreet 拥有约 60 人的团队,分布在巴塞罗那总部及全球各地区。
Read More


