
Trade The World
Solana Price Forecast: SOL hits key support as sell-off wave cools down
作者 Vishal Dixit
发布日期: 18 Nov 2025 | 修改日期: 18 Nov 2025


POPULAR ARTICLES

Solana (SOL) edges higher by 2% at press time on Tuesday, holding above the $130 mark. The technical outlook for Solana focuses on key support at $126 amid heightened selling pressure.
- Solana holds above $130, aiming for a rebound as RSI flashes oversold conditions.
- Selling pressure declines in the cash and futures markets, as large wallet investors return to the spot market.
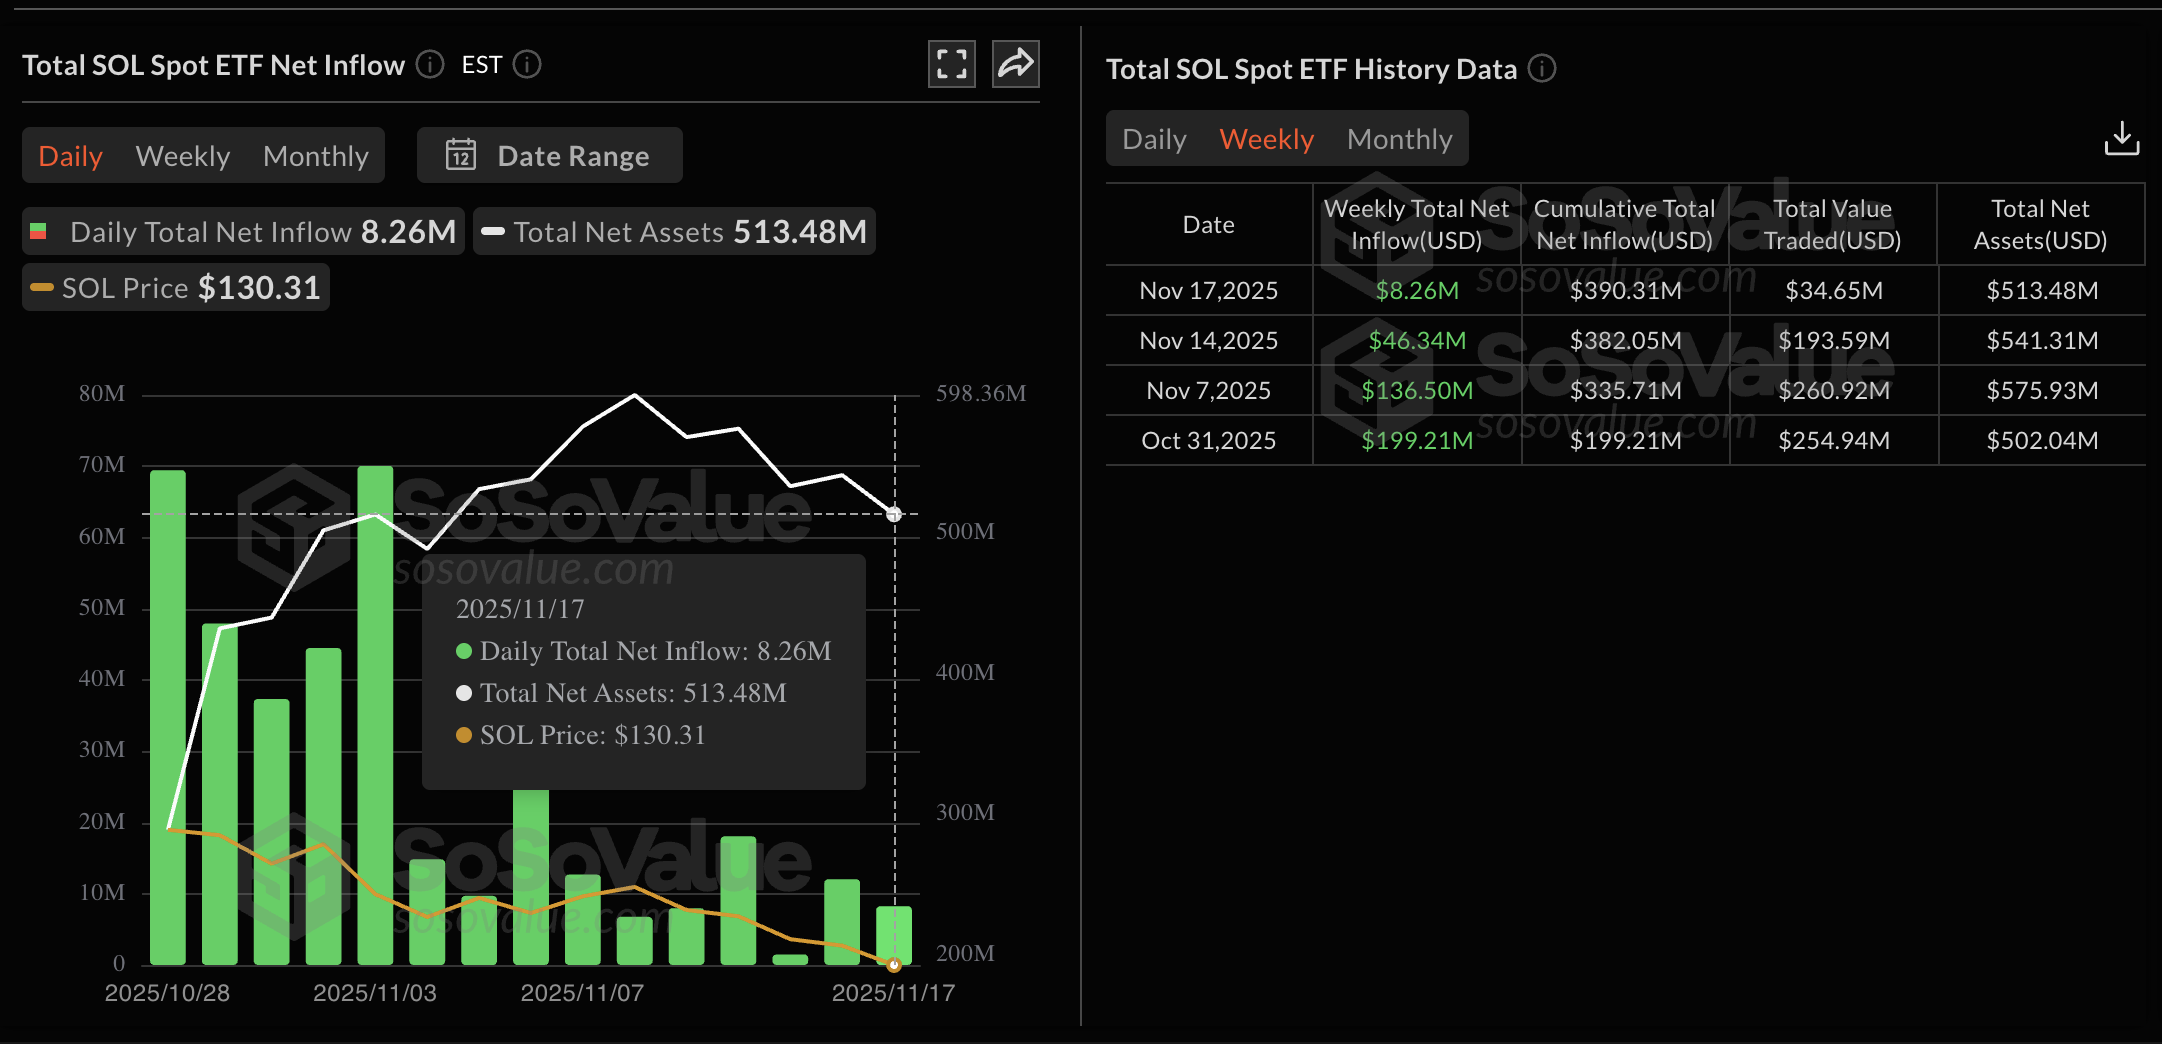
- Institutional demand remains unfazed for Solana as ETF inflows record $8.26 million on Monday.
Solana (SOL) edges higher by 2% at press time on Tuesday, holding above the $130 mark. The technical outlook for Solana focuses on key support at $126 amid heightened selling pressure. However, steady inflows from Solana Exchange Traded Funds (ETFs) and an underlying shift in the spot and futures markets could help SOL rebound.
Dip in Solana shifts investors' sentiment
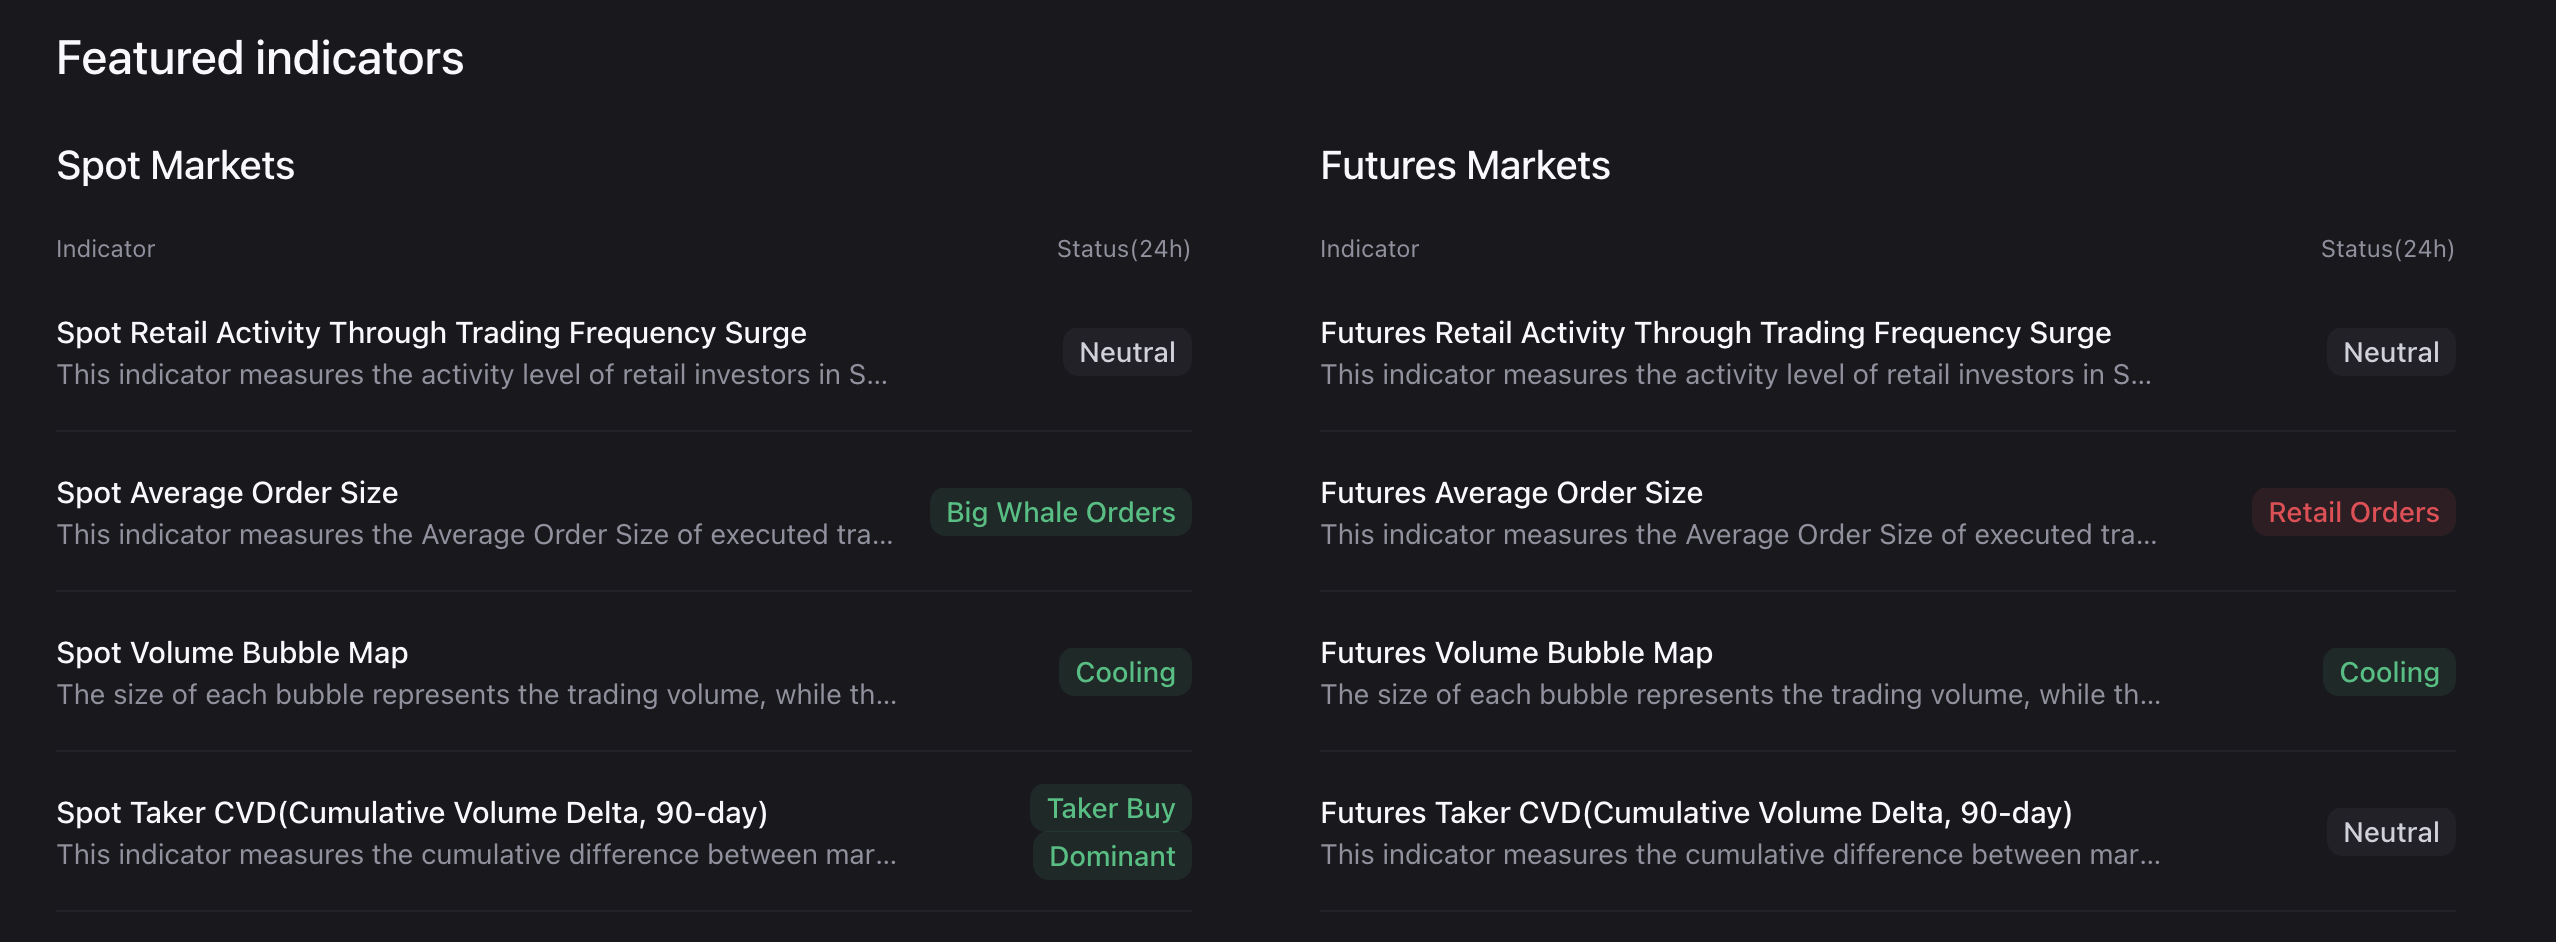
Solana is experiencing a surge in demand from large wallet investors, commonly referred to as whales, who are keen to buy the dip. According to CryptoQuant, the average order size of the executed trades in the SOL spot market indicates large whale orders. Furthermore, the Cumulative Volume Delta (CVD) indicates a positive difference in the market's buy and sell order volume, suggesting buy-side dominance.
At the same time, the volume bubble map, which tracks the difference in trading volume, indicates a decline in both spot and futures markets. This decrease in trading volume, amid a prevailing declining trend, signals reduced selling pressure that could act as dry powder for the subsequent Solana rebound.
Meanwhile, despite Solana being down over 30% from October 28, the institutional demand remains steady. The SOL ETFs recorded a net inflow of $8.25 million on Monday, marking 15 consecutive days of positive flows.
Solana hits a crucial crossroads, preparing for a rebound
Solana holds above the S2 Pivot Point at $128, slightly above the bearish target of $126, marked by the June 22 low, as previously reported by FXStreet. However, the close alignment of these strong supports could absorb the incoming supply, potentially leading to a bounce back.
This potential rebound in SOL could test the $150 psychological level near the $155 supply zone.
Still, the technical indicators on the daily chart tilt bearish, as the Moving Average Convergence Divergence (MACD) continues to extend the declining trend with the signal line.
Even the Relative Strength Index (RSI) at 30 hovers near the oversold boundary, signaling heightened selling pressure. However, extreme oversold conditions, indicated by RSI values below 30, signal a potential reversal as investors shift to buy the dip at undervalued prices.
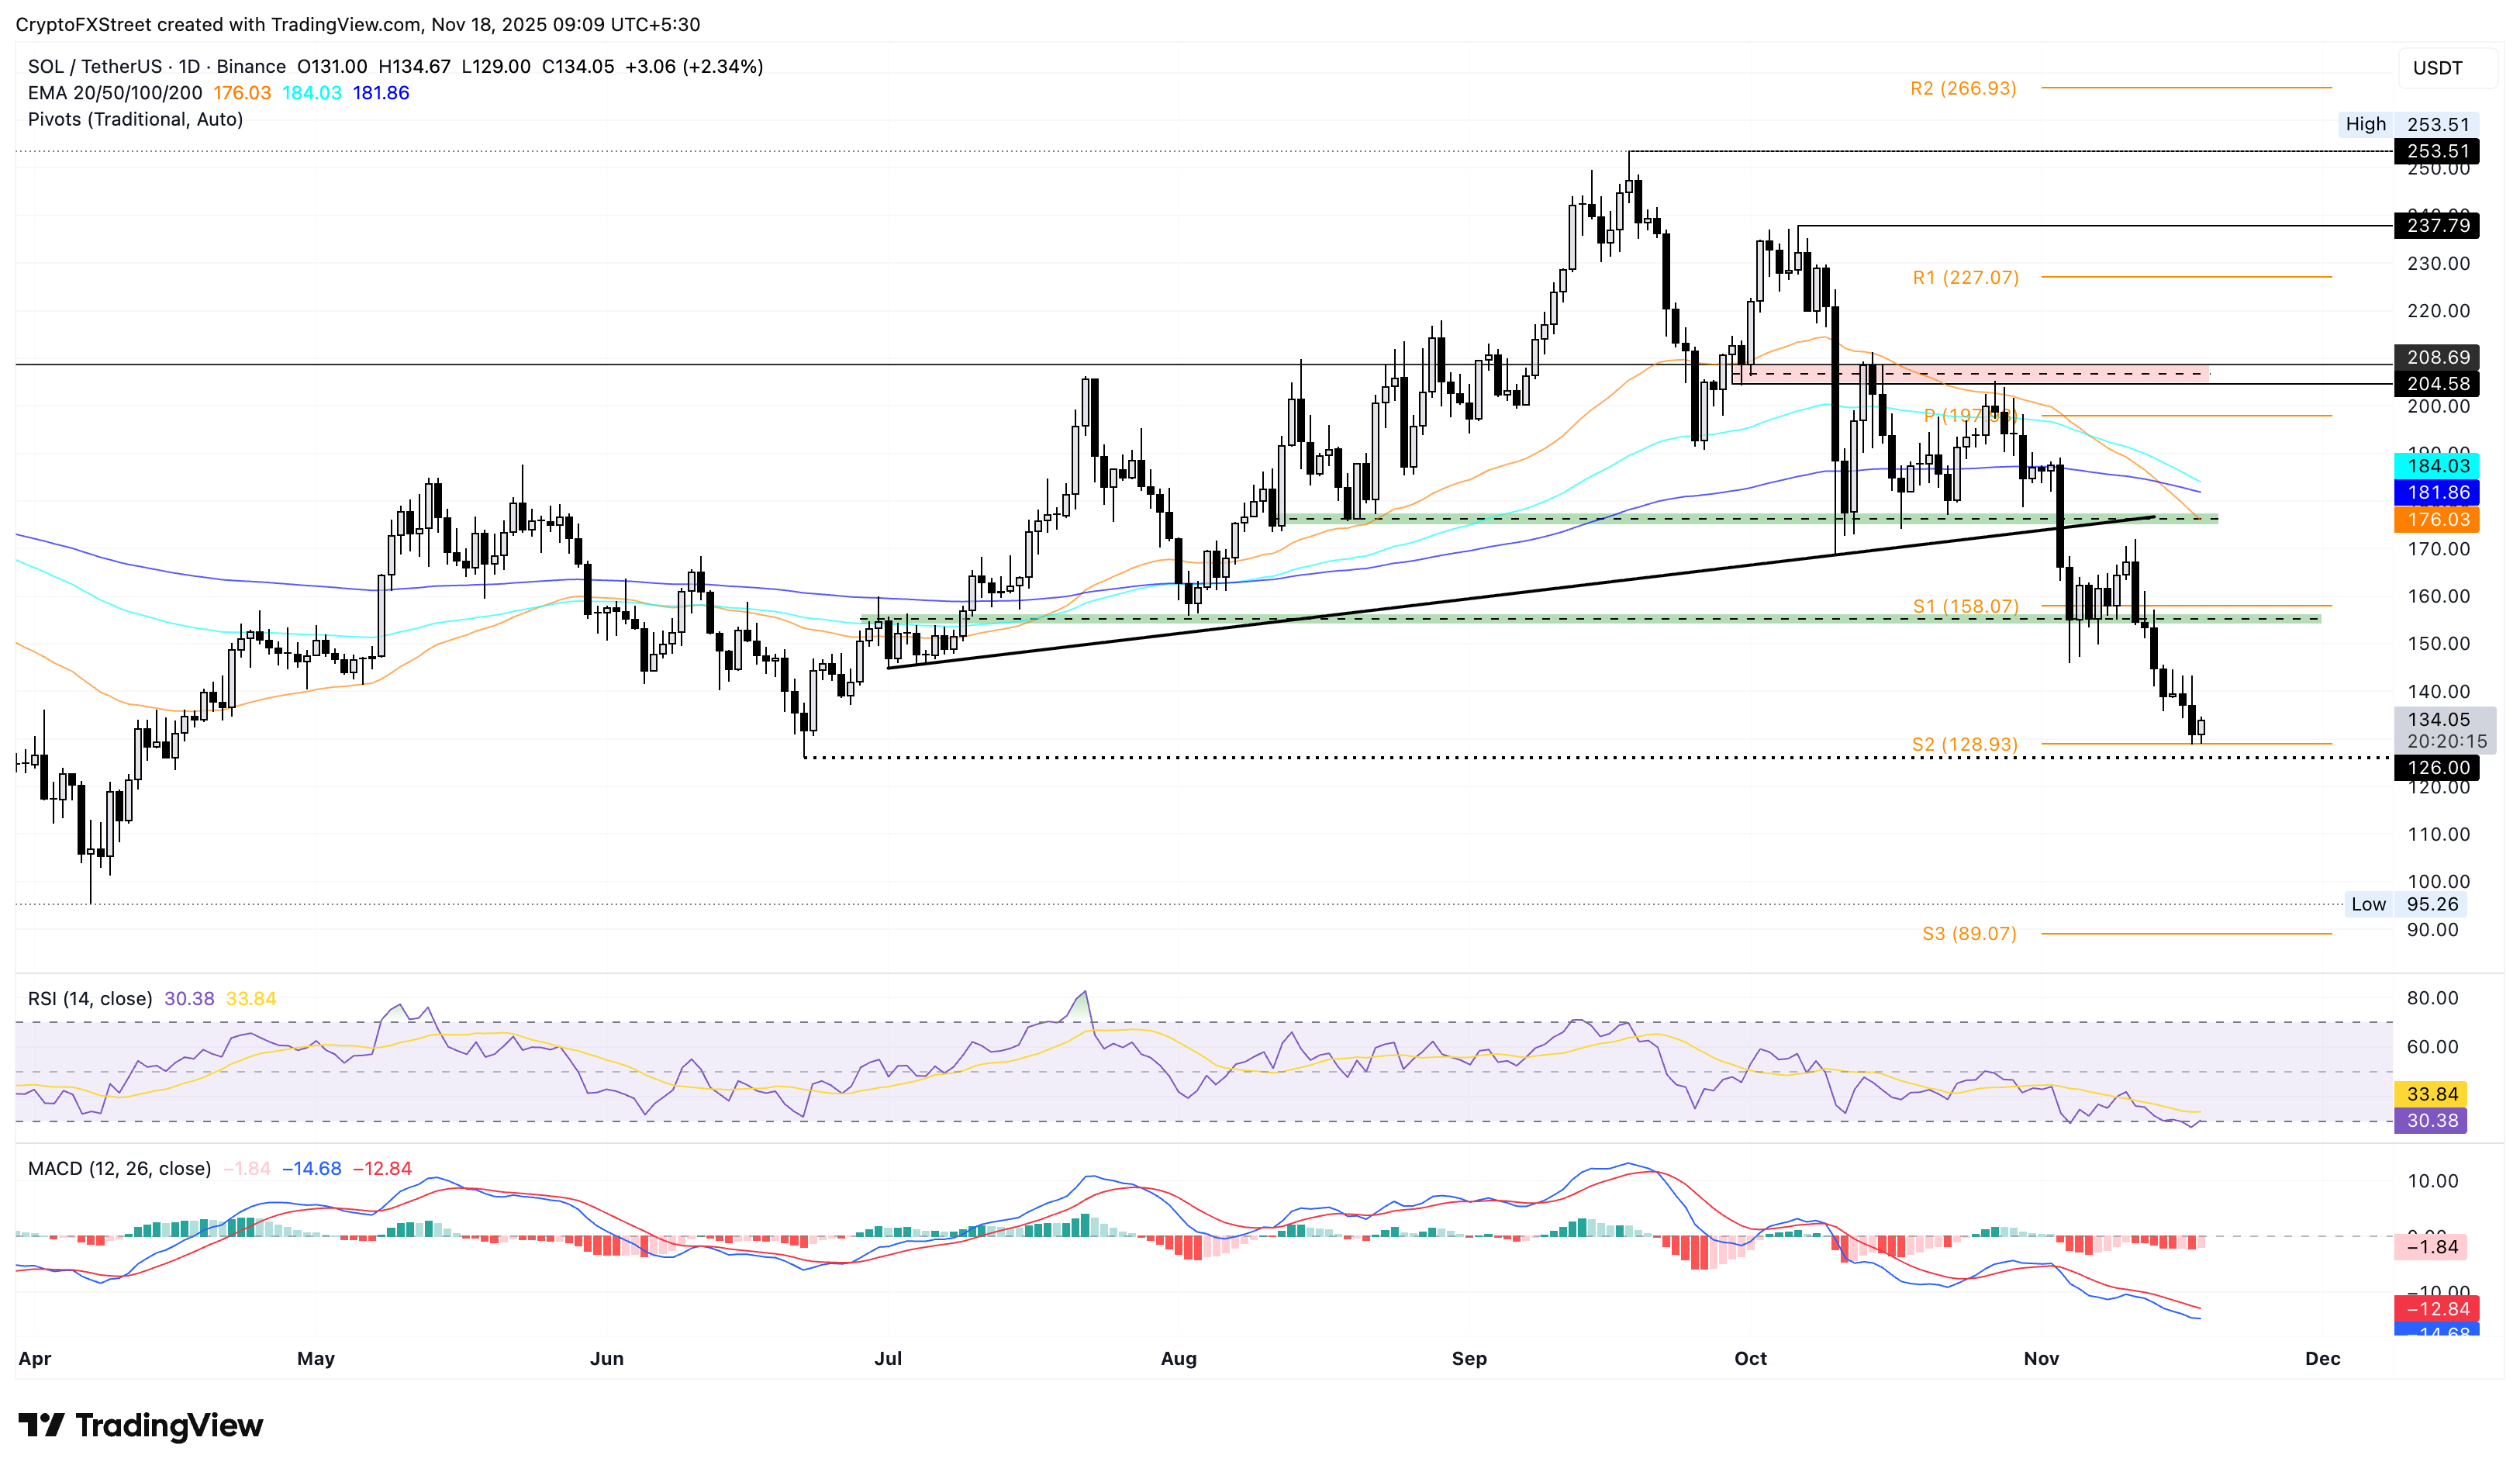
If SOL drops below $126, it would nullify rebound chances and likely test the April 7 low of $95.

FXStreet
超过一百万用户依赖 FXStreet 获取实时市场数据、图表工具、专家洞见和外汇新闻。其全面的经济日历和教育网络研讨会帮助交易者保持信息领先、做出审慎决策。FXStreet 拥有约 60 人的团队,分布在巴塞罗那总部及全球各地区。
Read More


