
Solana rebounds amid ETF inflows, futures data highlights sell-side dominance
作者 Vishal Dixit
发布日期: 21 Jan 2026 | 修改日期: 21 Jan 2026


热门文章

Solana (SOL) rises against headwinds by over 1% at press time on Wednesday, after four consecutive days of losses. Institutional inflows on Tuesday reaffirm steady interest in Solana, while retail sentiment falters, as evidenced by declining Open Interest and massive long liquidations.
- Solana recovers by 1% on Wednesday after a four-day freefall amid persistent downside bias.
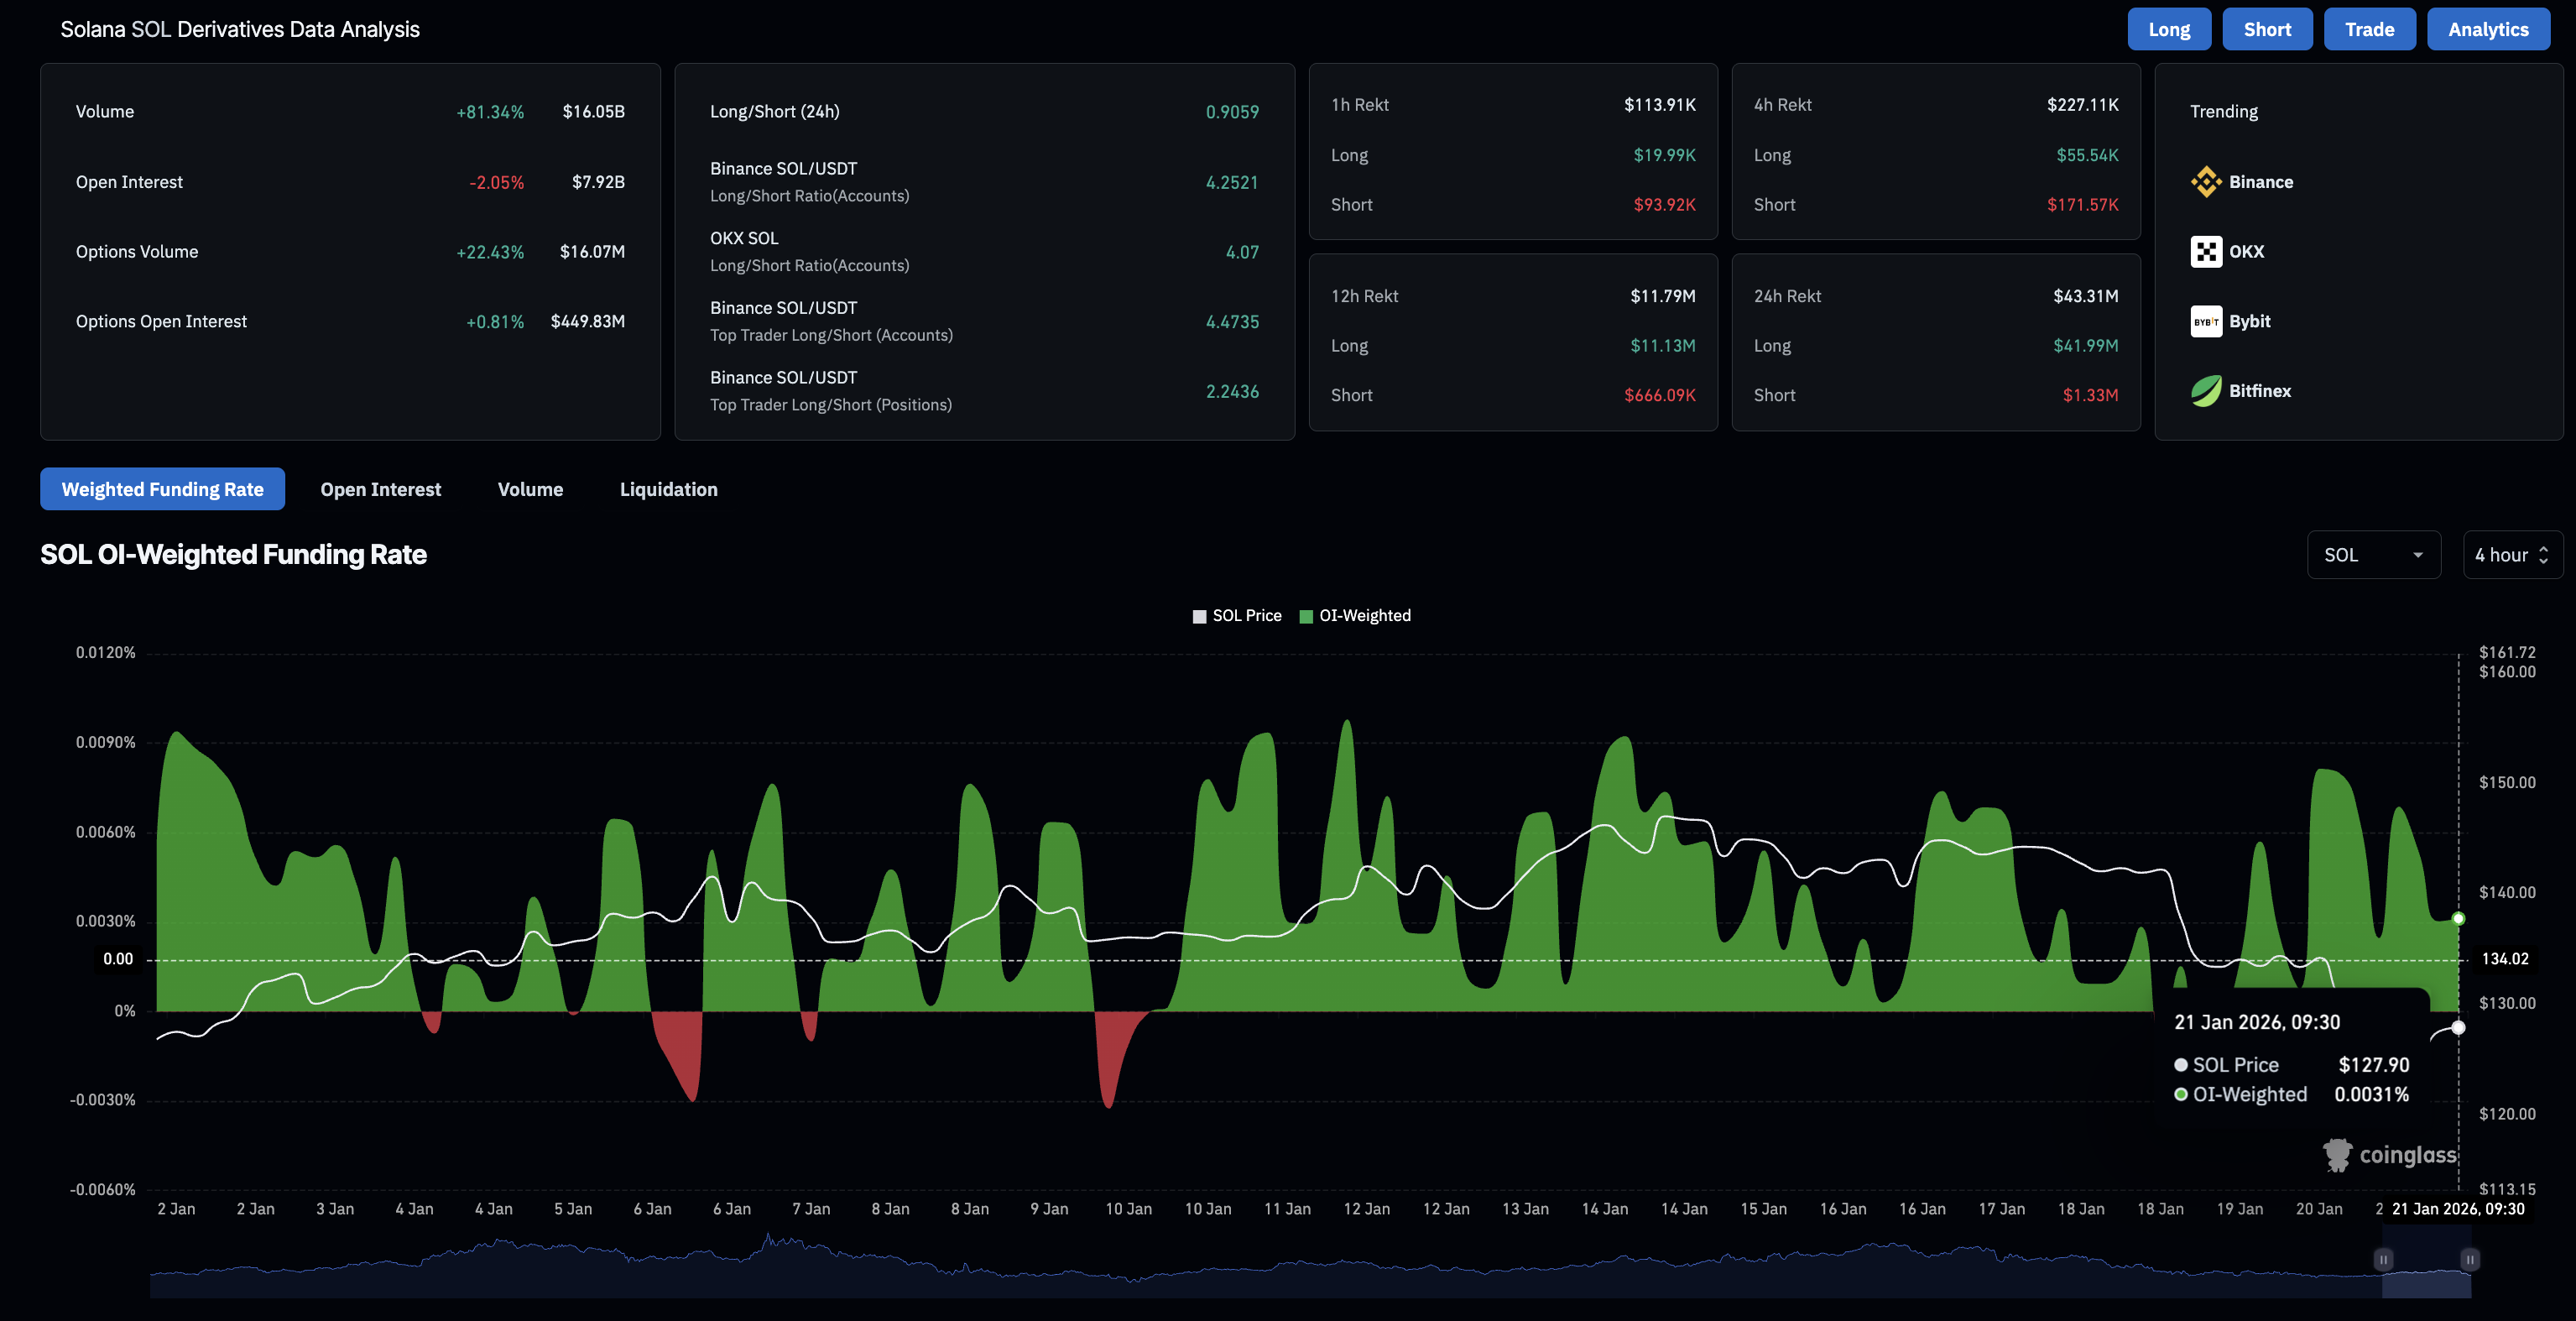
- Nearly $42 million in long liquidation and a 2% drop in Open interest in the last 24 hours signal sell-side dominance in Solana futures.
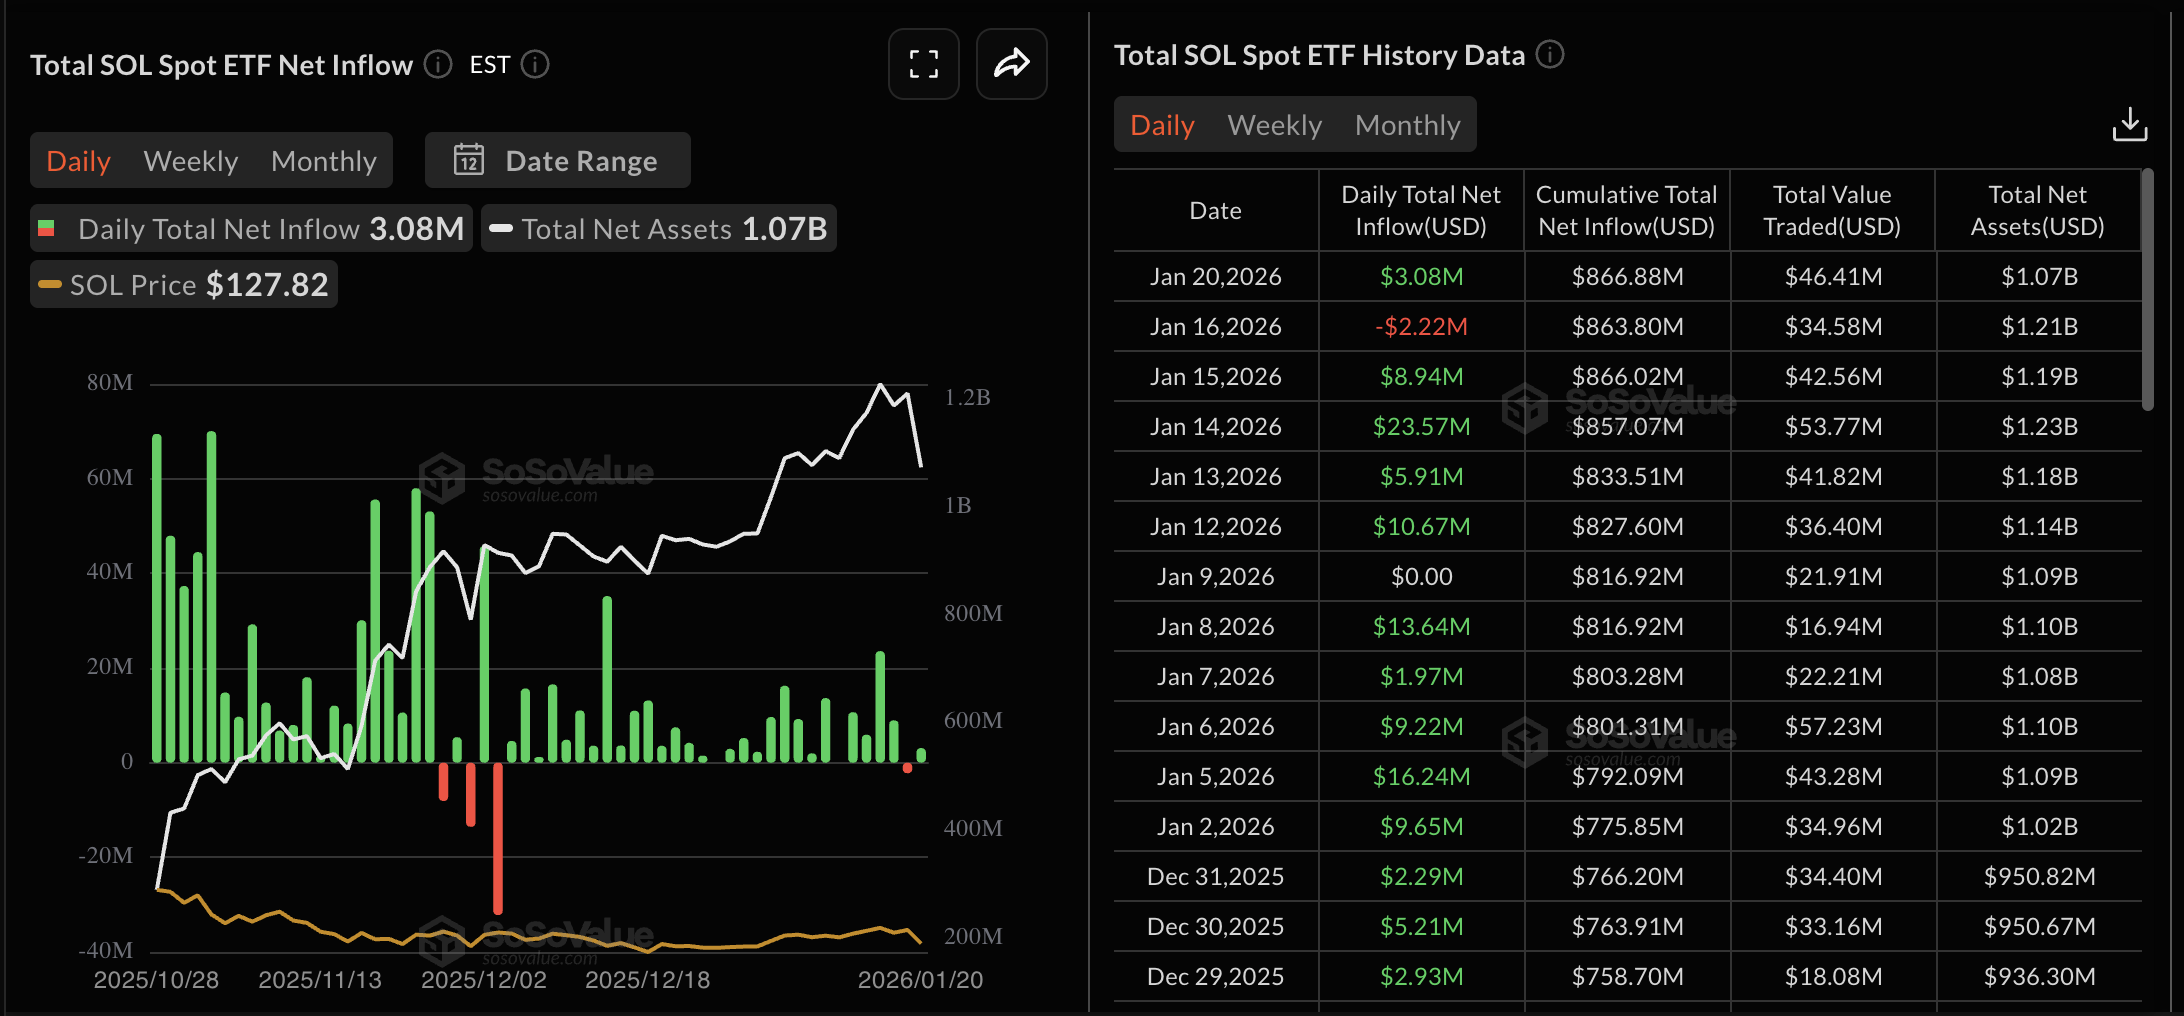
- Solana ETFs recorded a net inflow of over $3 million on Tuesday, suggesting steady institutional interest.
Solana (SOL) rises against headwinds by over 1% at press time on Wednesday, after four consecutive days of losses. Institutional inflows on Tuesday reaffirm steady interest in Solana, while retail sentiment falters, as evidenced by declining Open Interest and massive long liquidations. The technical outlook for Solana focuses on increased selling pressure, shifting momentum, and the potential for a path of least resistance to the downside.
Retail sentiment falters despite ETF inflows
The US spot SOL Exchange Traded Funds (ETFs) on Tuesday recorded $3.80 million in inflows, recovering from $2.22 million in outflows from Friday. This inflow signals steady institutional interest in Solana amid declining crypto and global financial markets.
Meanwhile, the Solana Open Interest (OI) is down 2.05% over the last 24 hours, to $7.92 billion, reflecting a significant decline in the value of outstanding futures contracts, including leverage. In line with reduced capital, long liquidations of $41.99 million in the same timeframe outpaced short liquidations of $1.33 million, wiping out broadly bullish-aligned positions.
The institutional interest could hold Solana in the short term, while a steady decline in market sentiment would increase the likelihood of a sharp correction.
Technical outlook: Will Solana extend its pullback to $100?
Solana trades below $130 at press time on Wednesday, down roughly 7% so far this week amid rising geopolitical tensions driven by US President Donald Trump's tariff threats. The 20-day Exponential Moving Average (EMA) at $135 reverses from the 50-day EMA, signaling renewed short-term selling.
Technical indicators on the daily chart suggest strengthening downward momentum for Solana. The Moving Average Convergence Divergence (MACD) line extends below the red signal line toward the zero line, deepening negative histogram bars. The Relative Strength Index (RSI) stands at 41, below the midline, reinforcing sellers' control.
A downside continuation in Solana could test the support zone between the December 18 low at $116 and the S1 Pivot Point at $112.
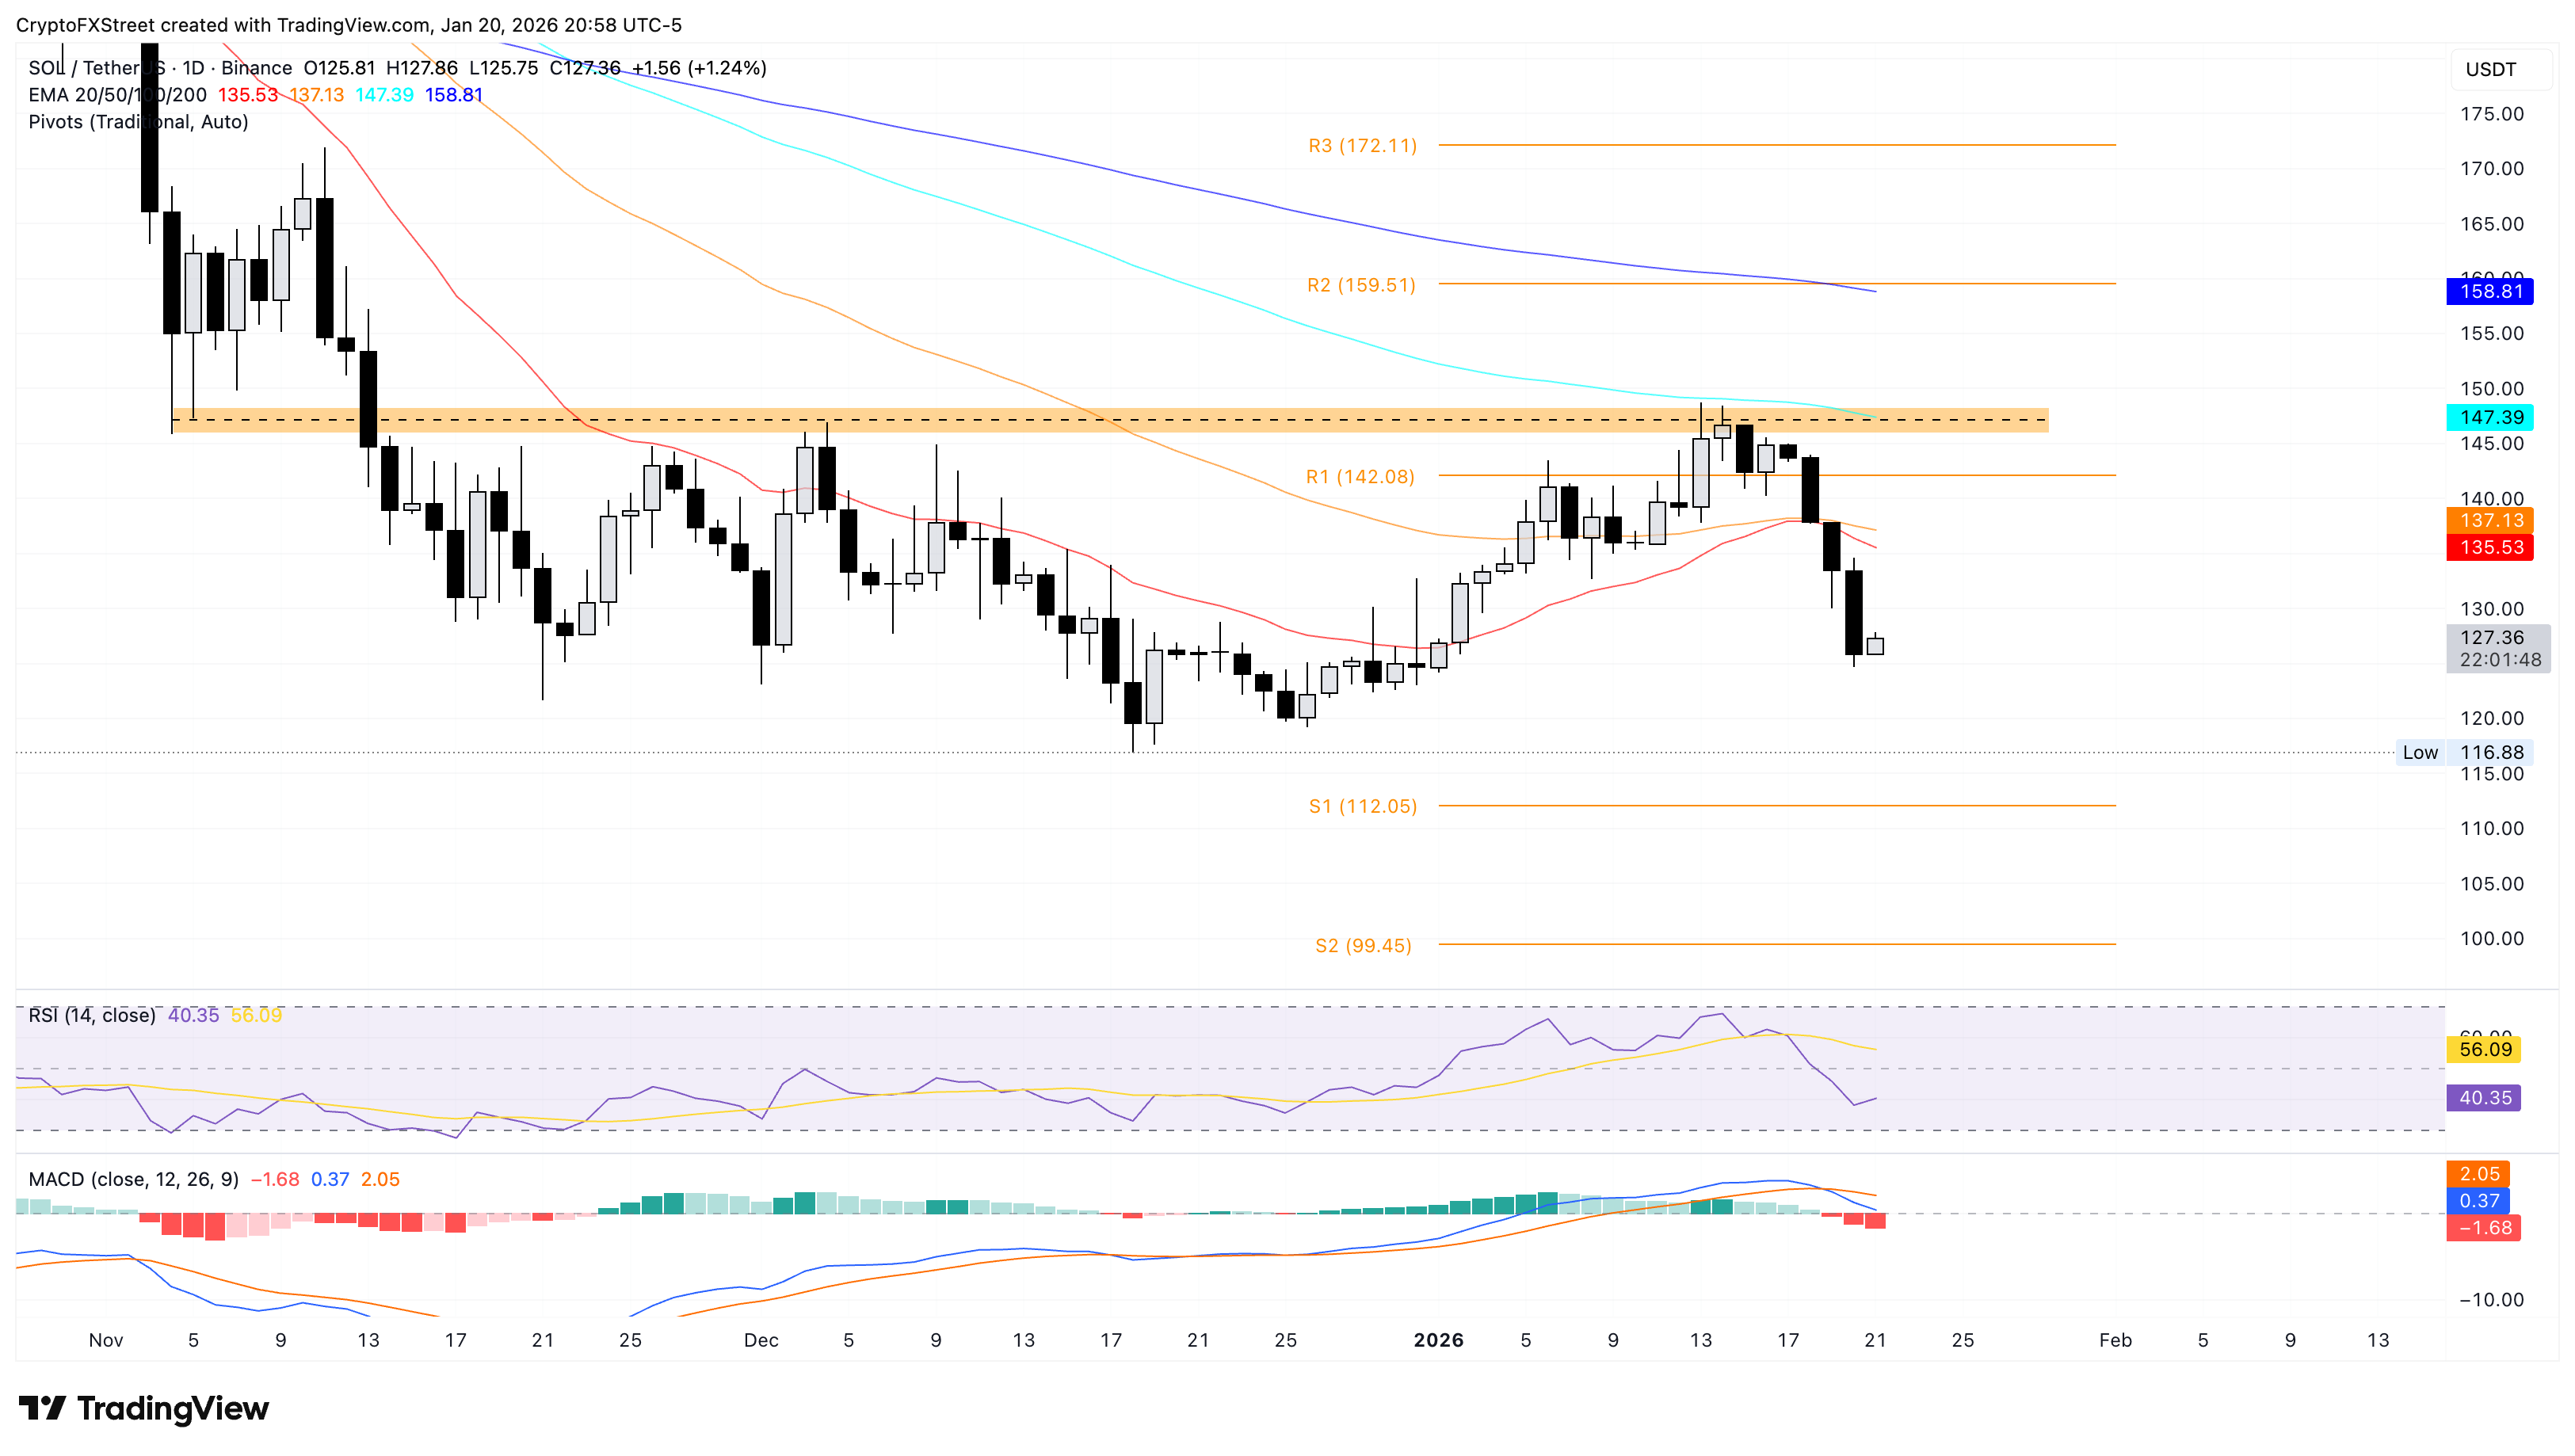
Apart from the 20-day and 50-day EMAs, Solana could face significant headwinds near the $145-$148 resistance zone, which also coincides with the 100-day EMA at $147.
(The technical analysis of this story was written with the help of an AI tool.)

超过一百万用户依赖 FXStreet 获取实时市场数据、图表工具、专家洞见和外汇新闻。其全面的经济日历和教育网络研讨会帮助交易者保持信息领先、做出审慎决策。FXStreet 拥有约 60 人的团队,分布在巴塞罗那总部及全球各地区。
阅读更多


