
Trade The World
Stellar Price Forecast: XLM risks wedge breakdown as Open Interest declines
作者 Vishal Dixit
发布日期: 1 Aug 2025 | 修改日期: 1 Aug 2025


POPULAR ARTICLES

Stellar (XLM) edges lower by 3% at press time on Friday, extending the downtrend for the third consecutive day. Both the derivatives and technical risks further losses as bullish momentum and open interest decline.
- Stellar extends the declining trend for the third consecutive day, risking a wedge breakdown.
- XLM open interest loses over $200 million within two weeks, signaling a sharp decline in traders’ interest.
- The Protocol 23 upgrade, focused on network improvements, goes to the validator vote on August 26.
Stellar (XLM) edges lower by 3% at press time on Friday, extending the downtrend for the third consecutive day. Both the derivatives and technical risks further losses as bullish momentum and open interest decline.
However, the upcoming Protocol 23 upgrade aimed at boosting smart contract development on the Stellar network could pivot the XLM prices.
Validators to vote on Stellar’s Protocol 23 upgrade
The Protocol 23 upgrade for Stellar aims to enhance smart contract functionality with faster and cheaper transactions, thereby attracting institutional players. PayPal’s long-awaited PYUSD, a stablecoin pegged to the US Dollar, could be launched on the Stellar network after the upgrade.
The upgrade was officially launched on the Stellar testnet on July 17 and is scheduled for a vote by the validators on August 26. If approved, the Mainnet voting will be conducted on September 3. Sidelined investors may witness the new protocol upgrade hype driving the buying pressure.
Declining traders’ confidence wipes out over $200 million from XLM Open Interest
The broader cryptocurrency market pullback sputtered the interest in Stellar since its annual high of $0.5206 on July 18. CoinGlass’ data shows the XLM Open Interest (OI) at $351.13 million, down from the $588.33 million peak on July 18. This massive capital outflow of $237 million over the last two weeks indicates a sharp decline in the value of open futures and options contracts, suggesting lowered confidence among traders.
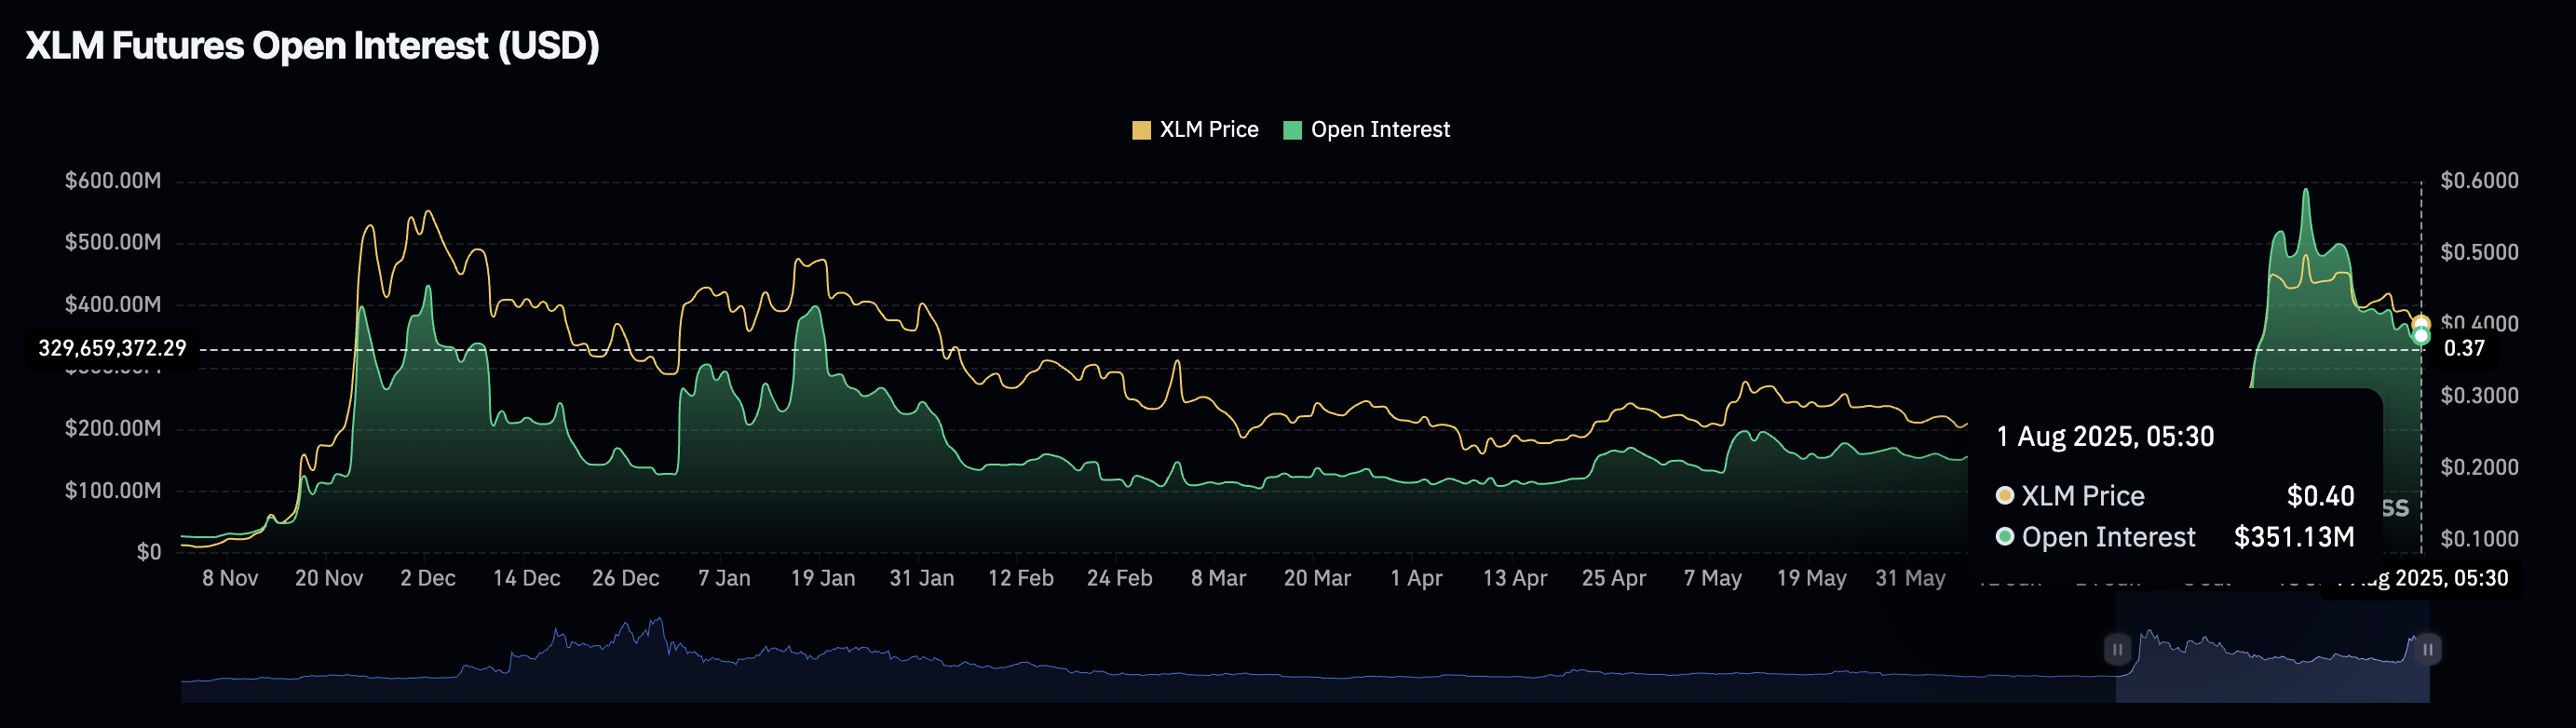
XLM Open Interest. Source: Coinglass
XLM risks wedge breakdown, targets $0.30
XLM is testing the 200-period Exponential Moving Average (EMA) at $0.3862 on the 4-hour chart, underpinned by the declining Relative Strength Index (RSI) at 31 on the same time frame, signaling a surge in selling pressure.
The Moving Average Convergence Divergence (MACD) indicator on this chart, characterized by the successive growth of red histogram bars, indicates increased bearish momentum.
It is worth noting that the price action on the 4-hour chart has formed a wedge pattern by two converging trendlines (the resistance trendline is formed by connecting July 18 and July 27 peaks, while the support trendline is extrapolated over July 15 and July 24 lows).
If XLM closes decisively below the 200-period EMA at $0.3862, it could test a support trendline at $0.3732. Below the trendline, a potential breakdown trend could test the S2 pivot level at $0.3533, followed by the S3 pivot level at $0.3056.
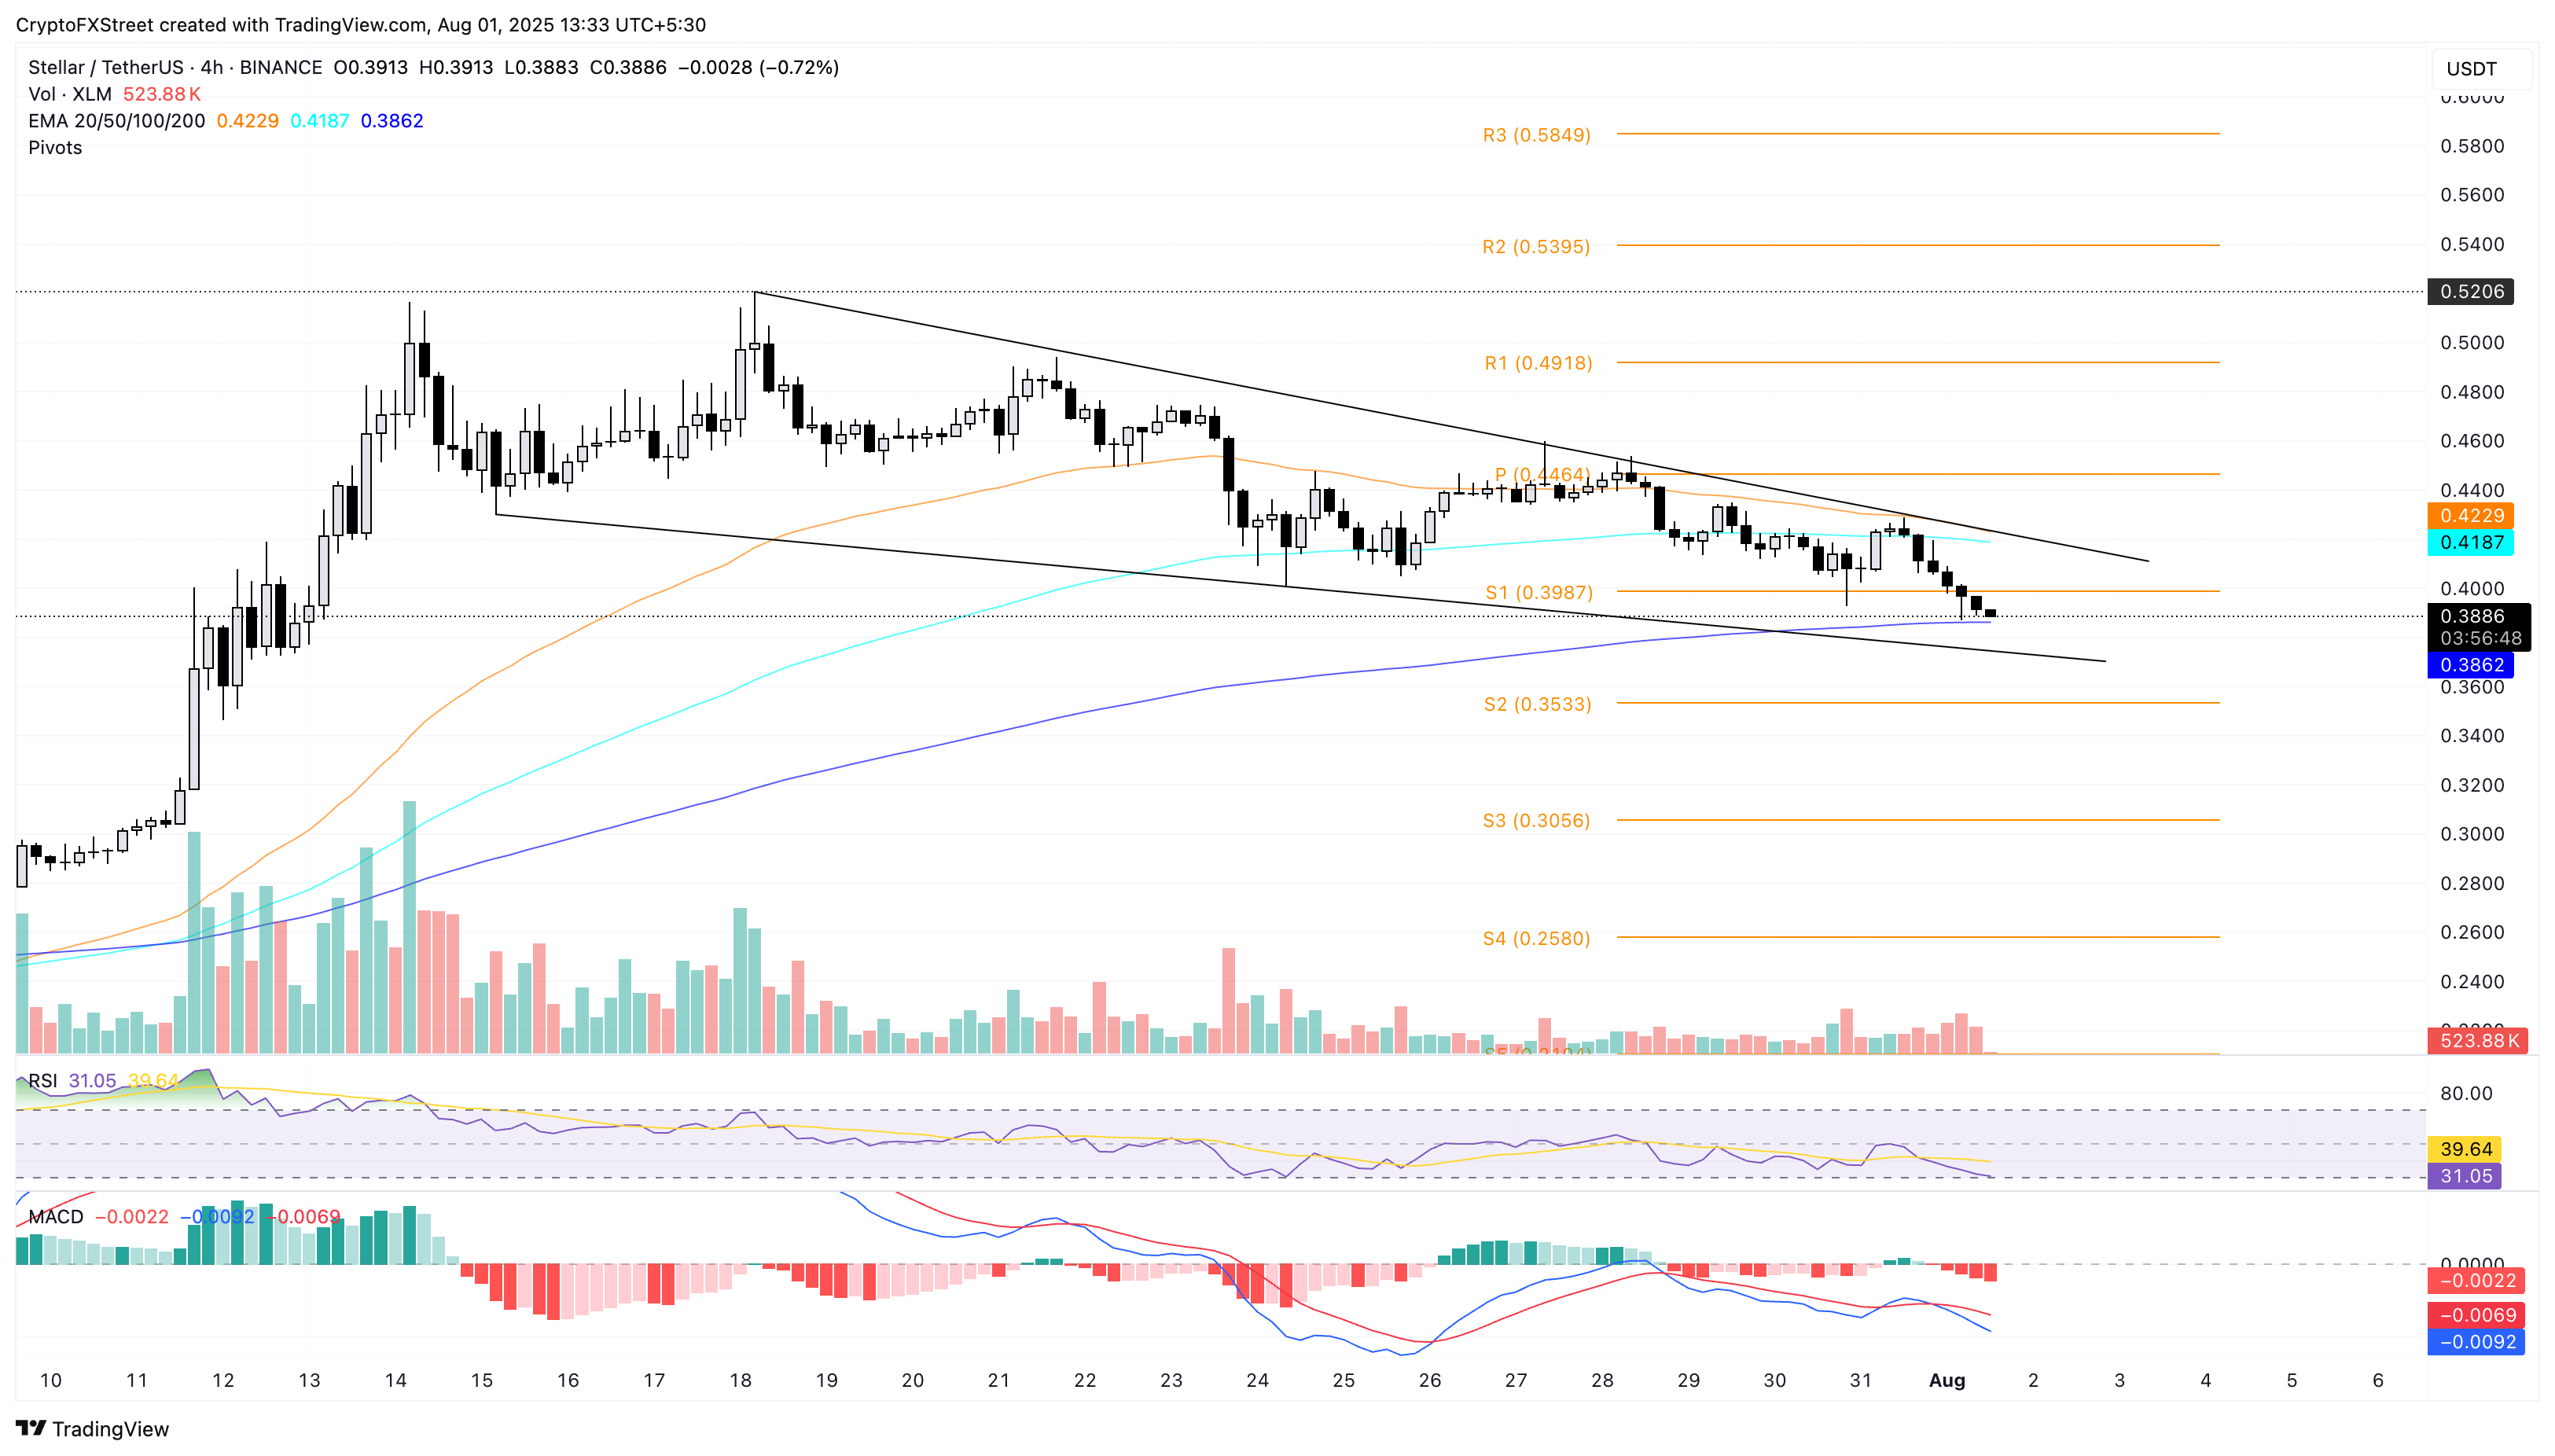
XLM/USDT daily price chart.
Looking up, a potential bounce back from the 200-period EMA could extend the reversal run to the 100-period EMA at $0.4187.

FXStreet
超过一百万用户依赖 FXStreet 获取实时市场数据、图表工具、专家洞见和外汇新闻。其全面的经济日历和教育网络研讨会帮助交易者保持信息领先、做出审慎决策。FXStreet 拥有约 60 人的团队,分布在巴塞罗那总部及全球各地区。
Read More


