


- Bitcoin is up over 2% on Monday within a triangle pattern, crossing the $90,000 mark.
- Ethereum reclaims the $3,000 mark on Monday with a 3% rise, targeting the 50-day EMA at $3,134.
- XRP records a near 2% rise as momentum indicators suggest a decline in selling pressure.
Bitcoin (BTC), Ethereum (ETH), and Ripple (XRP) record roughly 3% gains on Monday, regaining strength mid-holiday season. Despite thin liquidity in the holiday season, BTC and major altcoins are regaining strength as US President Donald Trump pushes peace talks between Russia and Ukraine. The technical outlook for Bitcoin, Ethereum, and Ripple gradually shifts bullish as selling pressure wanes.
Bitcoin regains strength as the US pushes for a Ukraine-Russia ceasefire
Bitcoin starts the week on a bullish note amid US President Donald Trump's efforts for a truce between Ukraine and Russia. In recent talks on a possible peace deal with the Ukrainian President Volodymyr Zelensky, Trump remarked that he made “a lot of progress." Still, there is no breakthrough on the matter of critical territory settlement, which might take several more weeks.
Bitcoin gains over 2% at press time on Monday, rising above $90,000. The intraday recovery hints at a potential bullish Marubozu candle, with bulls targeting the 50-day Exponential Moving Average (EMA) at $92,202.
Furthermore, BTC trades within a symmetrical triangle pattern formed by two converging trendlines on the daily chart. The overhead resistance trendline near the 50-day EMA connects the November 15 and December 9 highs.
If Bitcoin secures a decisive close above $92,202, it would confirm the breakout of the triangle pattern. In such a case, the November 15 high at $96,846 and the 200-day EMA at $101,029 could serve as potential resistance levels.
The Relative Strength Index (RSI) at 53 is pointing upwards after crossing the halfway line, suggesting that buying pressure is on the rise. Additionally, the Moving Average Convergence Divergence (MACD) is approaching the zero line, indicating that bullish momentum is strengthening.
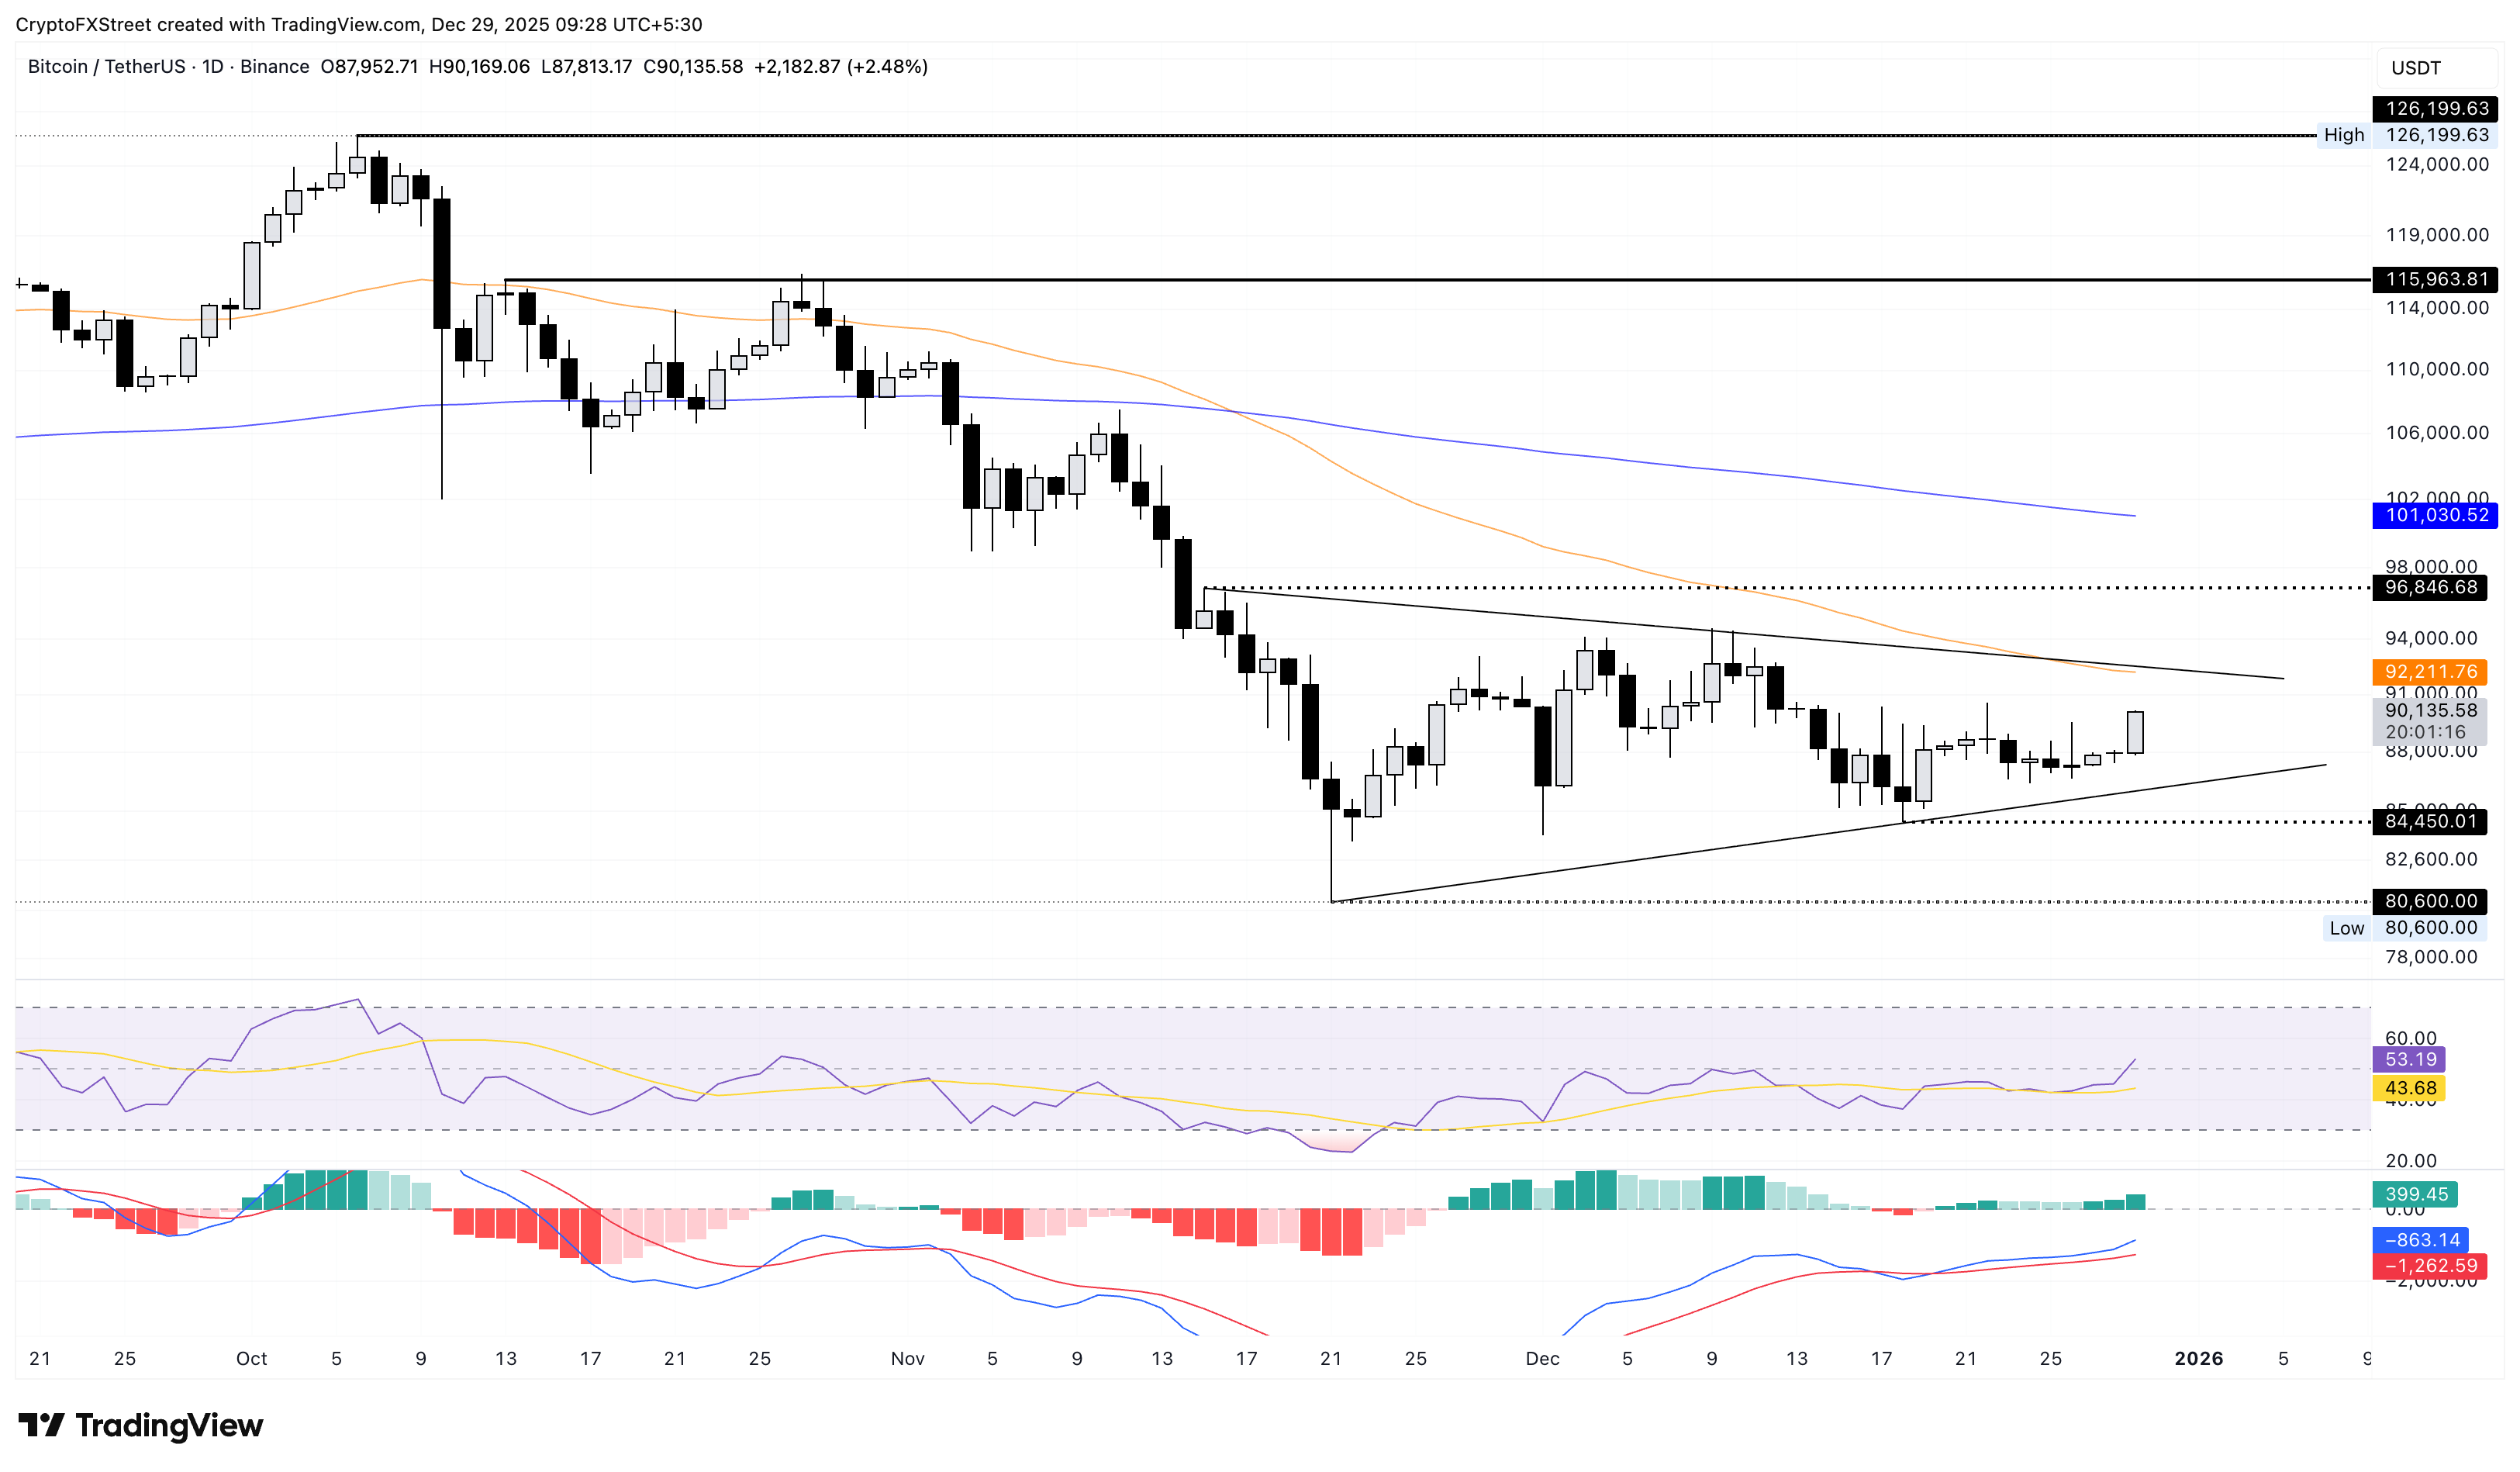
Looking down, if BTC slips below the support trendline near $86,250, it would mark a bearish breakout of the triangle pattern. The November 21 and December 18 lows at $84,450 and $80,600, respectively, could serve as support levels.
Ethereum crosses above $3,000, aiming to exceed the 50-day EMA
Ethereum trades above $3,000, marking its fourth consecutive day in an uptrend. At the time of writing, ETH is up over 3%, approaching the 50-day EMA at $3,136.
If ETH exceeds this moving average, it could extend the rally to the 200-day EMA at $3,374, signaling an 11% upside from current prices.
Similar to BTC, the momentum indicators on the daily chart signal a renewed strength in Ethereum. The RSI is at 51, crossing the midline, indicating rising buying pressure. The additional room on the upside suggests growth potential before reaching overbought levels.
At the same time, the MACD diverges to the upside from its signal line, avoiding a crossover. This indicates that bullish momentum in Ethereum persists.
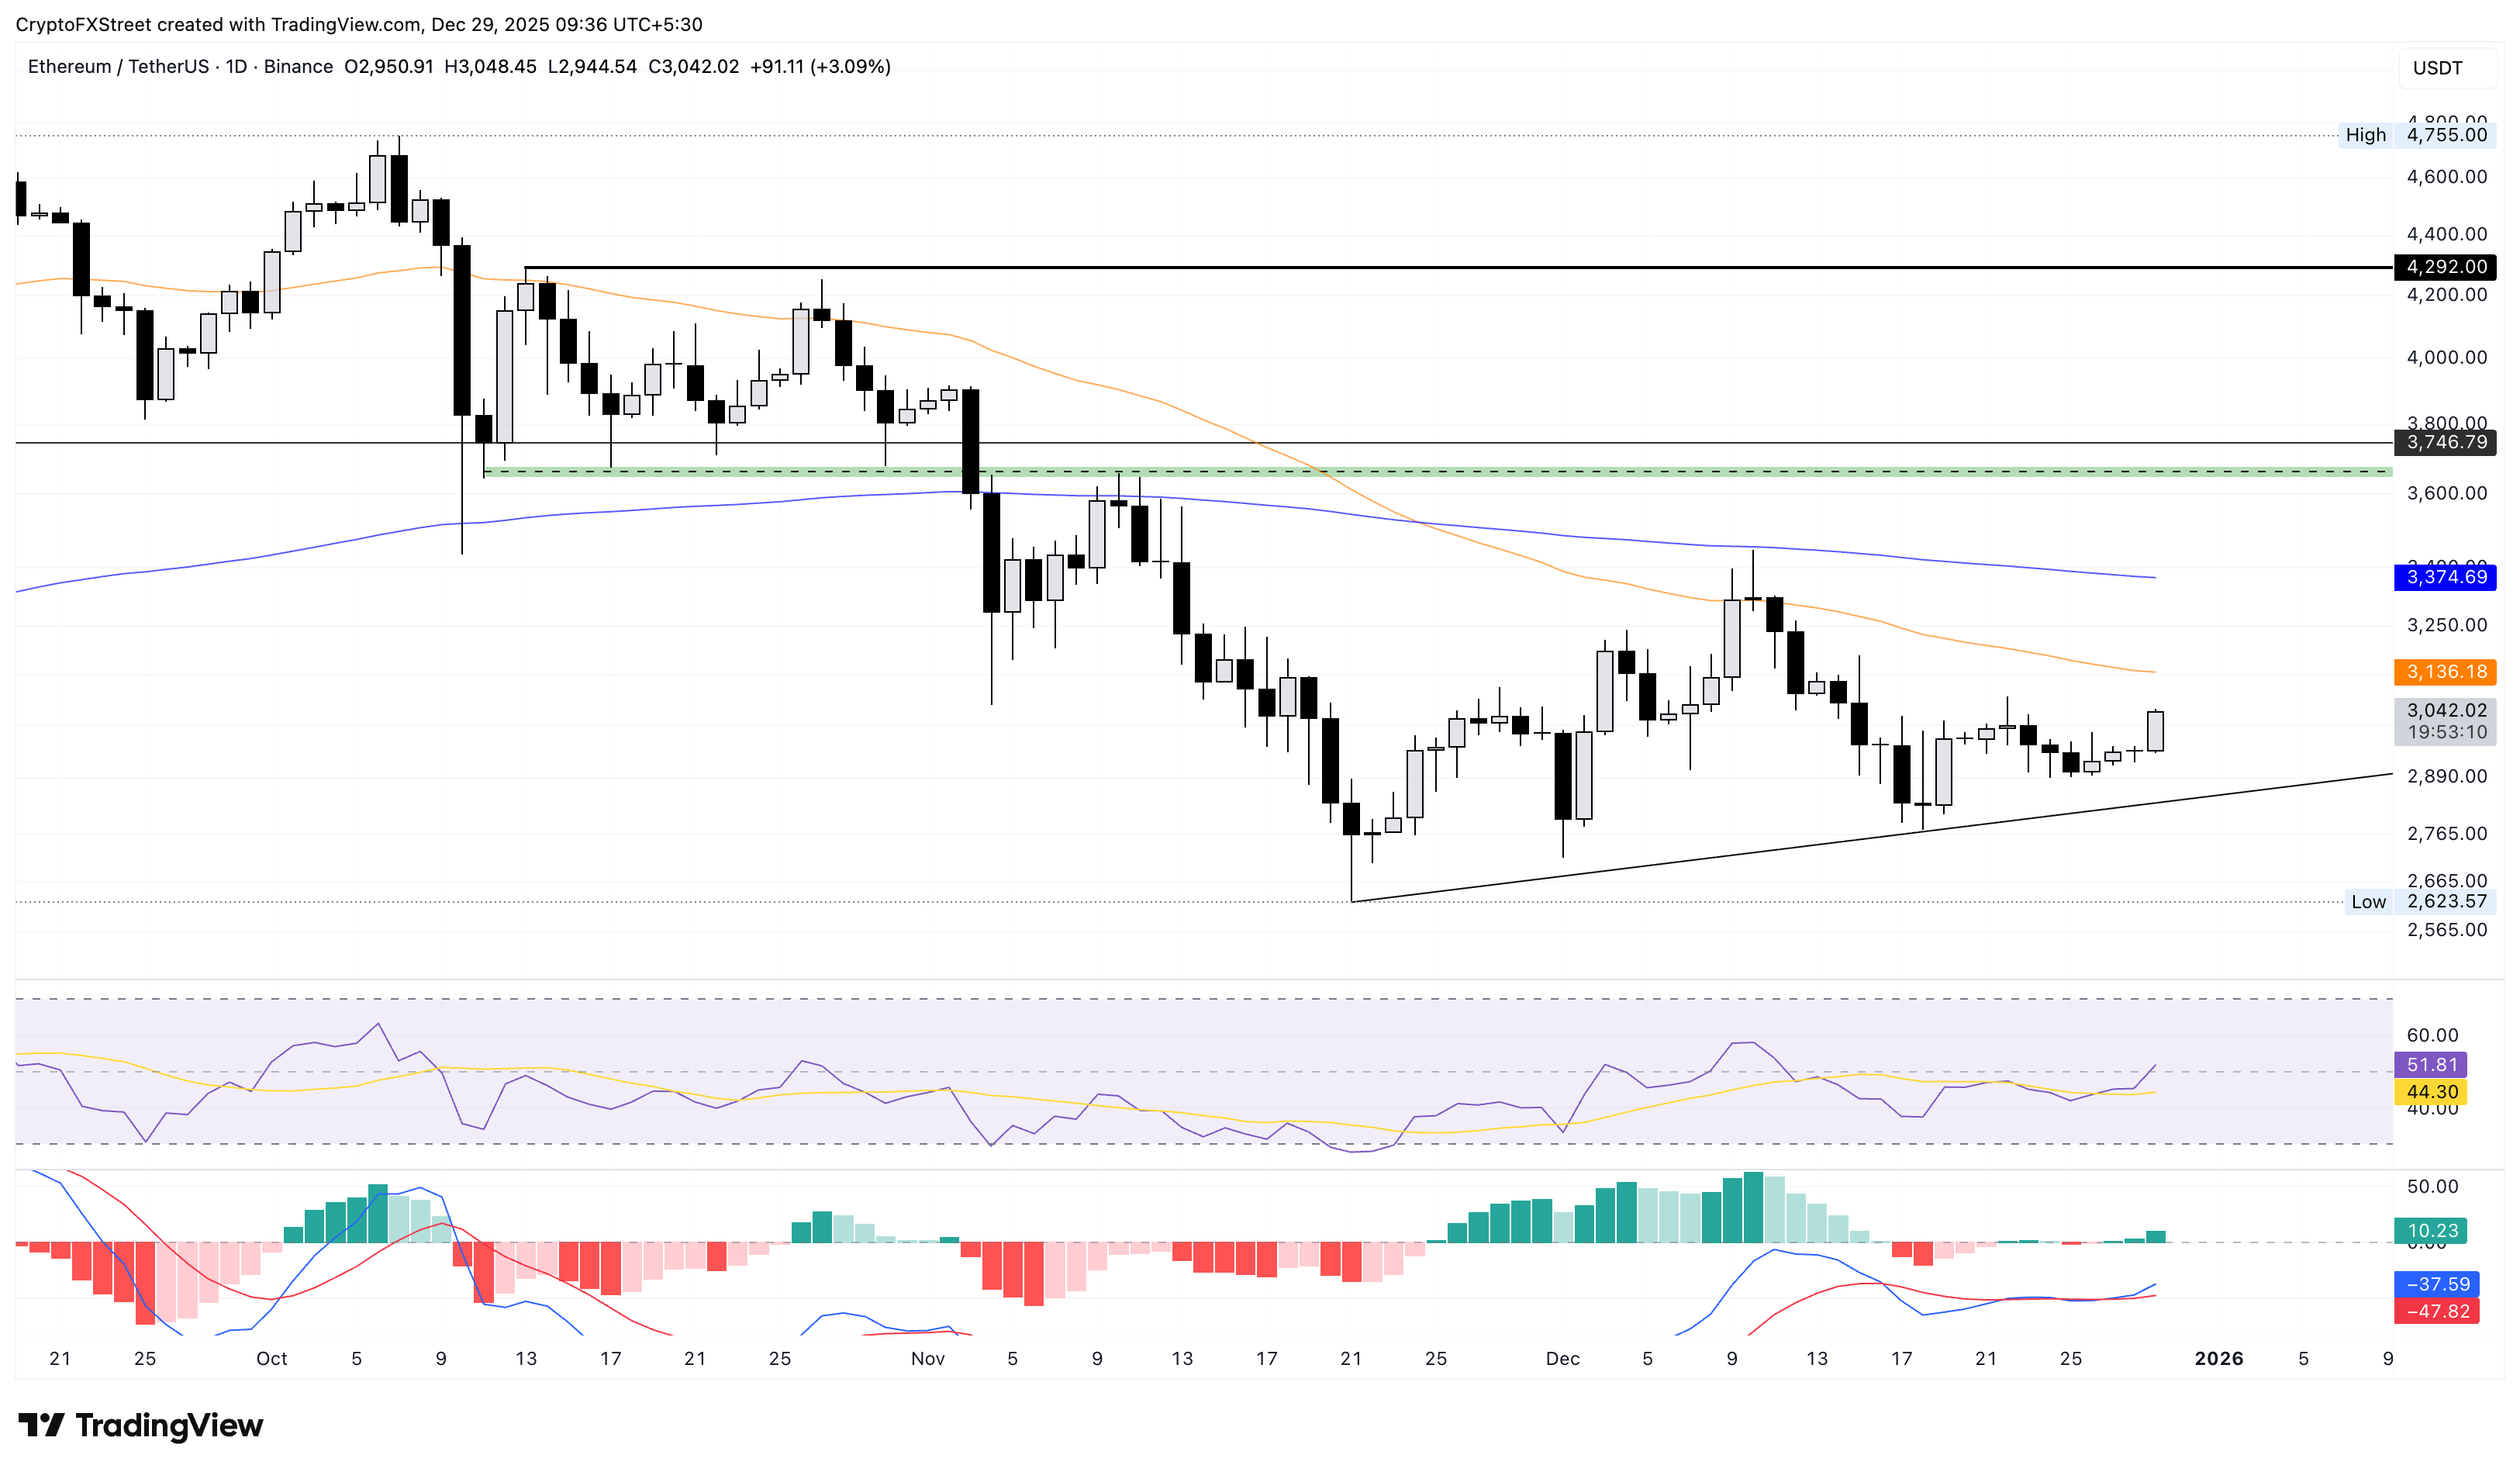
Looking down, the major altcoin could test a local support trendline, connecting the November 21 and December 18 lows, near $2,850.
XRP recovers within a falling wedge, targeting the $2 breakout
Ripple is up over 2% by press time on Monday, approaching the resistance trendline of a falling wedge pattern on the daily logarithmic chart, near $1.94. If XRP successfully clears this trendline, it could aim for the 50-day EMA at $2.06.
The RSI is at 45, inching toward the midline and indicating a drop in selling pressure. Meanwhile, the MACD extends an upward trend after crossing above the signal line on Saturday, indicating a renewed bullish momentum.
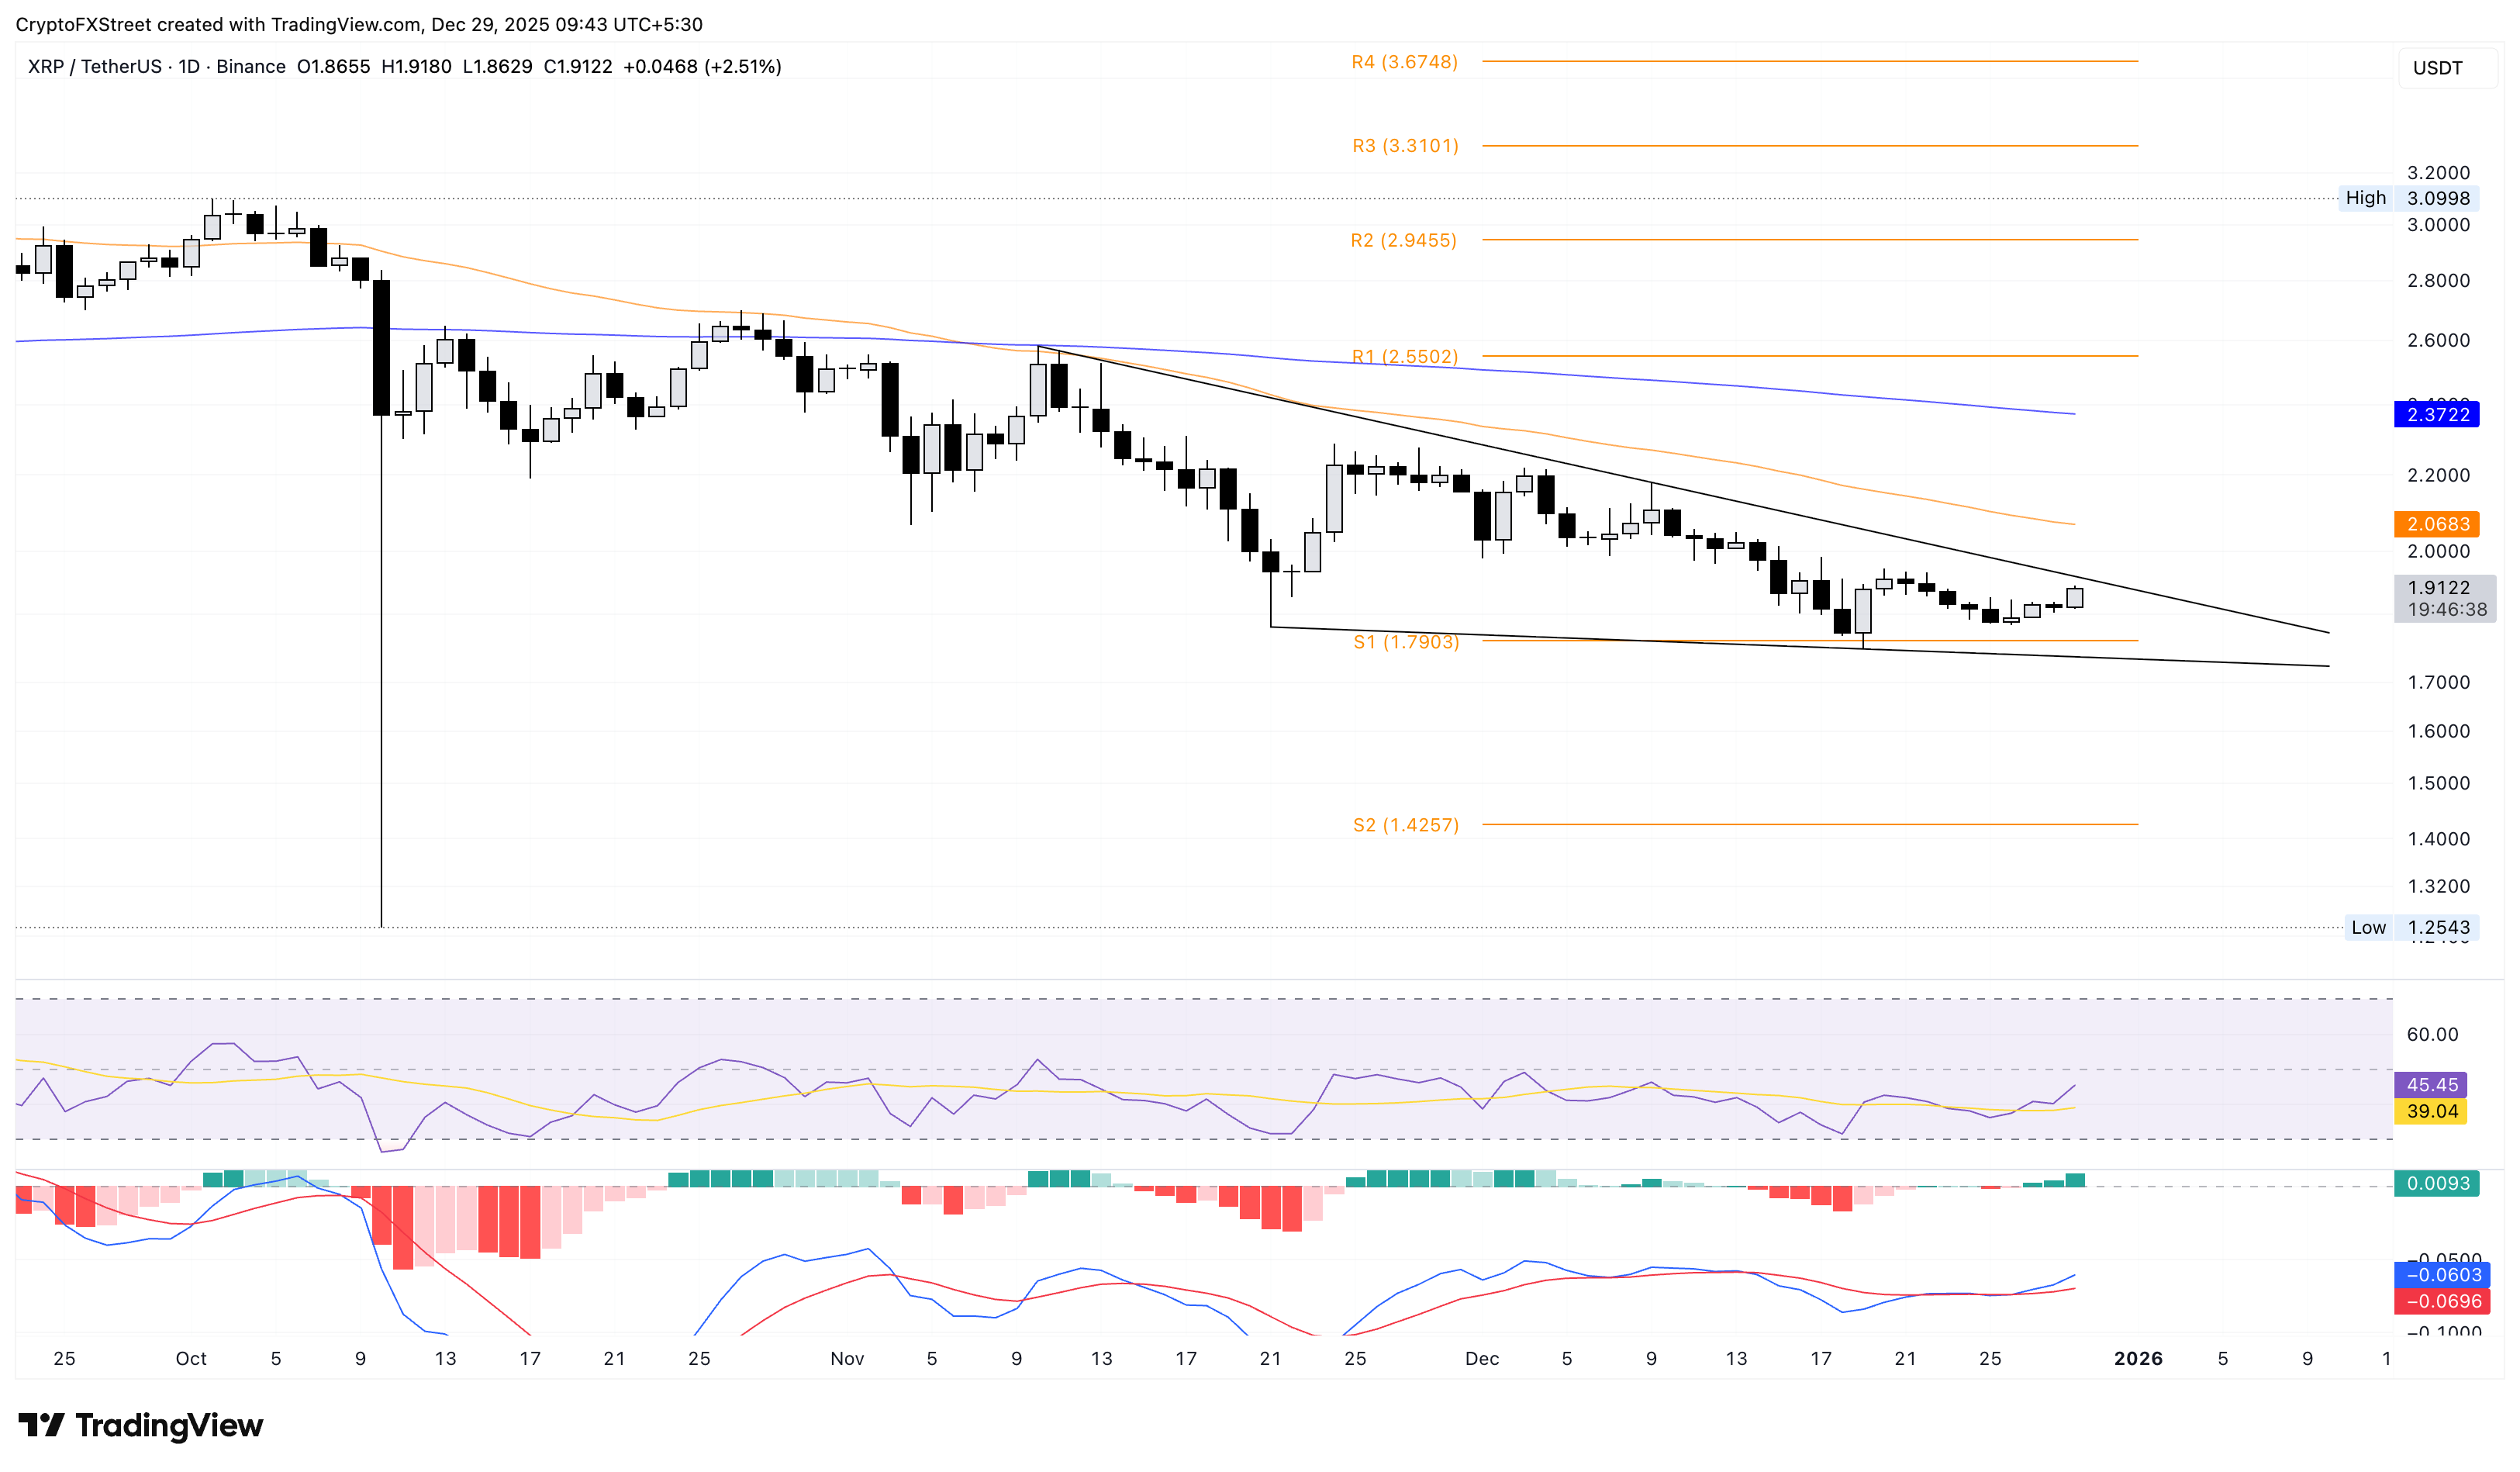
On the flip side, if XRP reverses below $1.90, it could target the S1 Pivot Point at $1.79.


