
Trade The World
Top 3 Price Prediction: Bitcoin, Ethereum, Ripple – BTC, ETH and XRP gear up for a fresh rally
作者 Manish Chhetri
发布日期: 19 Sep 2025 | 修改日期: 19 Sep 2025


POPULAR ARTICLES

Bitcoin (BTC) price trades above $117,000 on Friday, with bulls setting sights on $120,000. Ethereum (ETH) and Ripple (XRP) are following BTC’s lead and hold above key support levels, and are aiming for a fresh bullish leg in the upcoming days.
- Bitcoin price trades above $117,000 on Friday, with bulls setting sights on $120,000.
- Ethereum price hovers above $4,600 after rebounding from a key support level earlier this week.
- Ripple price rebounds after retesting a key level, opening the door for a potential fresh bullish leg.
Bitcoin (BTC) price trades above $117,000 on Friday, with bulls setting sights on $120,000. Ethereum (ETH) and Ripple (XRP) are following BTC’s lead and hold above key support levels, and are aiming for a fresh bullish leg in the upcoming days.
Bitcoin bulls set sights on the $120,000
Bitcoin price broke above the 50-day Exponential Moving Average (EMA) on September 10 and rallied 2.43% over the next six days, closing above the $116,000 resistance level on Tuesday. BTC faced a slight rejection on Wednesday, retested, and found support around $116,000, rallying slightly the next day. At the time of writing on Friday, it trades at around $117,000.
If BTC continues its upward momentum, it could extend the rally toward the psychological level of $120,000.
The Relative Strength Index (RSI) on the daily chart reads 61, remaining steady above the midline and reflecting bullish momentum. The Moving Average Convergence (MACD) indicator on the same chart displayed a bullish crossover on September 6, which remains in effect, indicating sustained bullish momentum and an upward trend ahead.
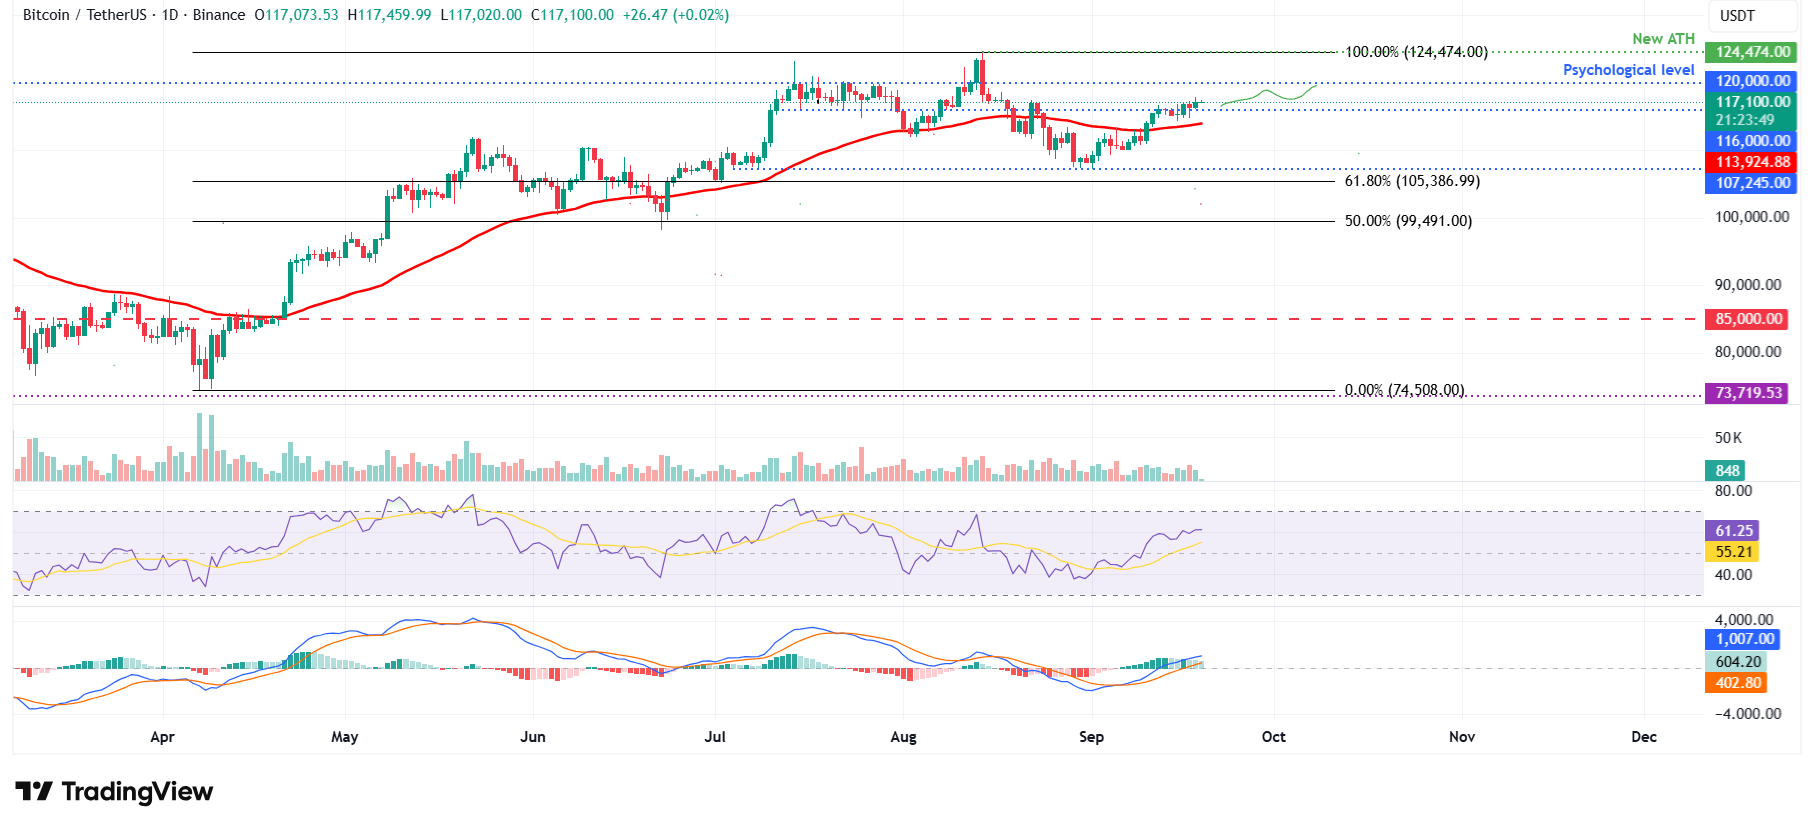
BTC/USDT daily chart
On the contrary, if BTC corrects and closes below the $116,000 support level, it could extend the decline toward the 50-day Exponential Moving Average (EMA) at $113,924.
Ethereum is poised for a rally toward its record high at $4,956
Ethereum price broke above the upper consolidation boundary at $4,488 on September 12 and rallied by 5.68%. However, it failed to maintain its upward momentum and declined 4.53% in the next four days, retesting its upper consolidation level at $4,488 on Tuesday. ETH rebounded by 1.98% on Wednesday from this support level and hovered around $4,500 the next day. As of Friday, it continues to stabilize at around $4,500.
If the support at $4,488 continues to hold, ETH could extend the recovery toward its record high at $4,956.
The RSI on the daily chart reads 57, remaining steady above the midline and reflecting slight bullish momentum. However, the MACD lines are converging, indicating indecisiveness among traders.
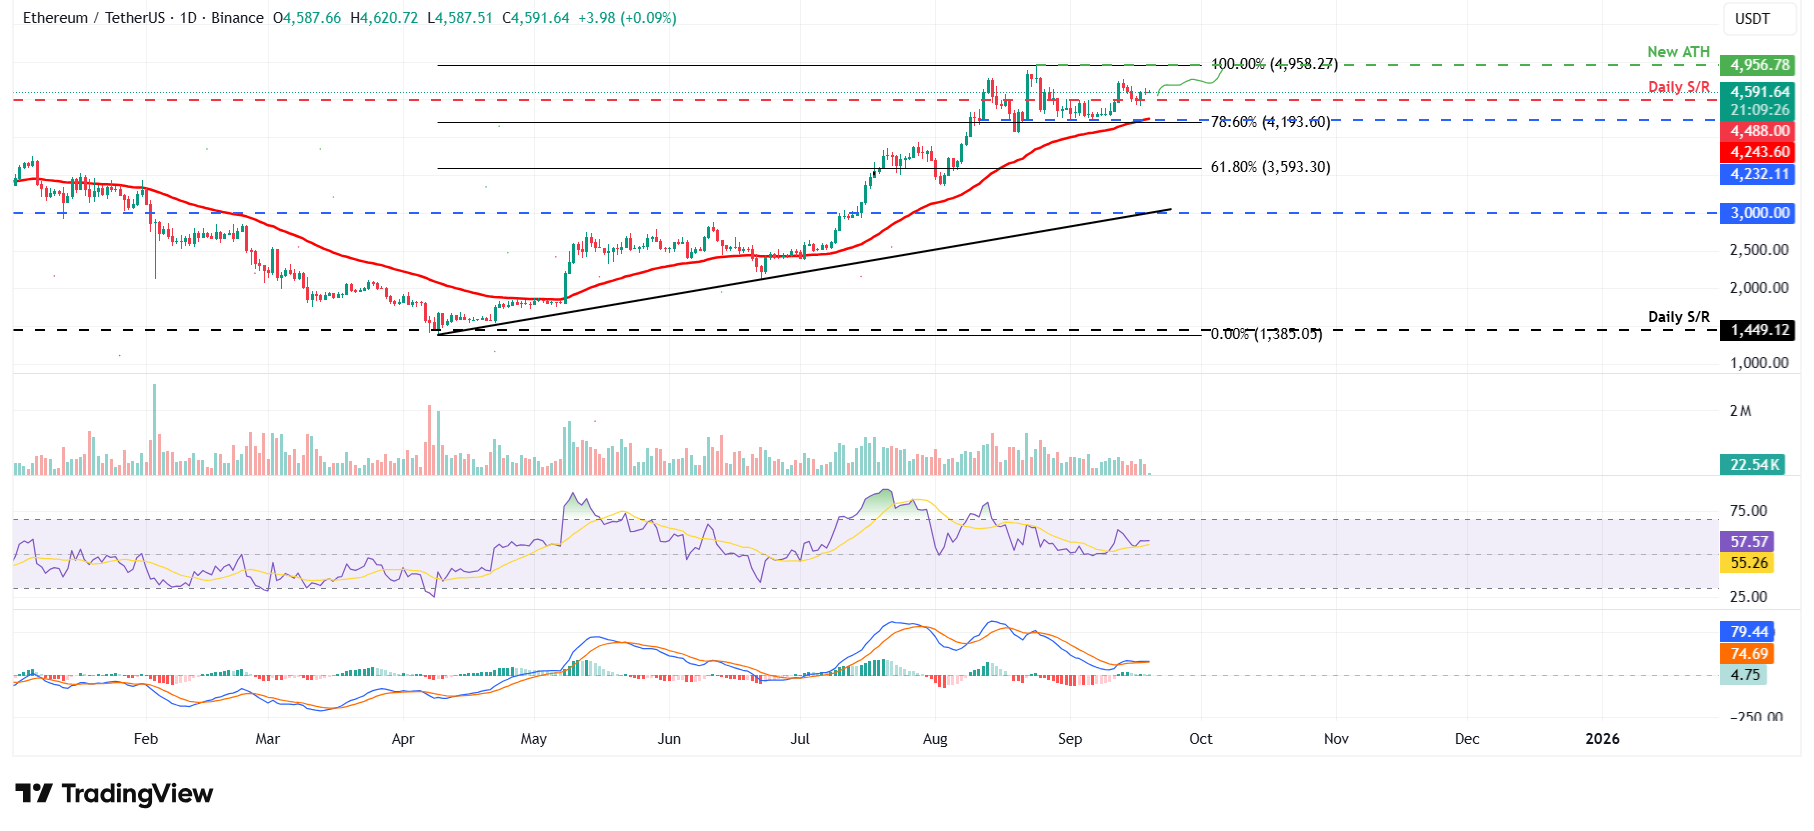
ETH/USDT daily chart
However, if ETH closes below the $4,488 level, it could extend the decline toward the lower boundary at $4,232, which coincides with the 50-day EMA.
XRP descending wedge breakout in play
XRP price broke above the falling wedge pattern (drawn by connecting multiple highs and lows with two trendlines since mid-July) on September 11; a breakout of this pattern favors the bulls. XRP rallied 2.5% in the next two days. However, it declined by 3.4% until Monday, retesting its breakout point around $2.99, and rebounded by 3% the next two days. At the time of writing on Friday, it hovers around $3.06.
If XRP continues its upward momentum, it could extend the rally toward its daily resistance at $3.40.
The RSI on the daily chart reads 55, above its neutral level of 50, indicating slight bullish momentum. Like Bitcoin, XRP’s MACD indicator also supports the bullish view.
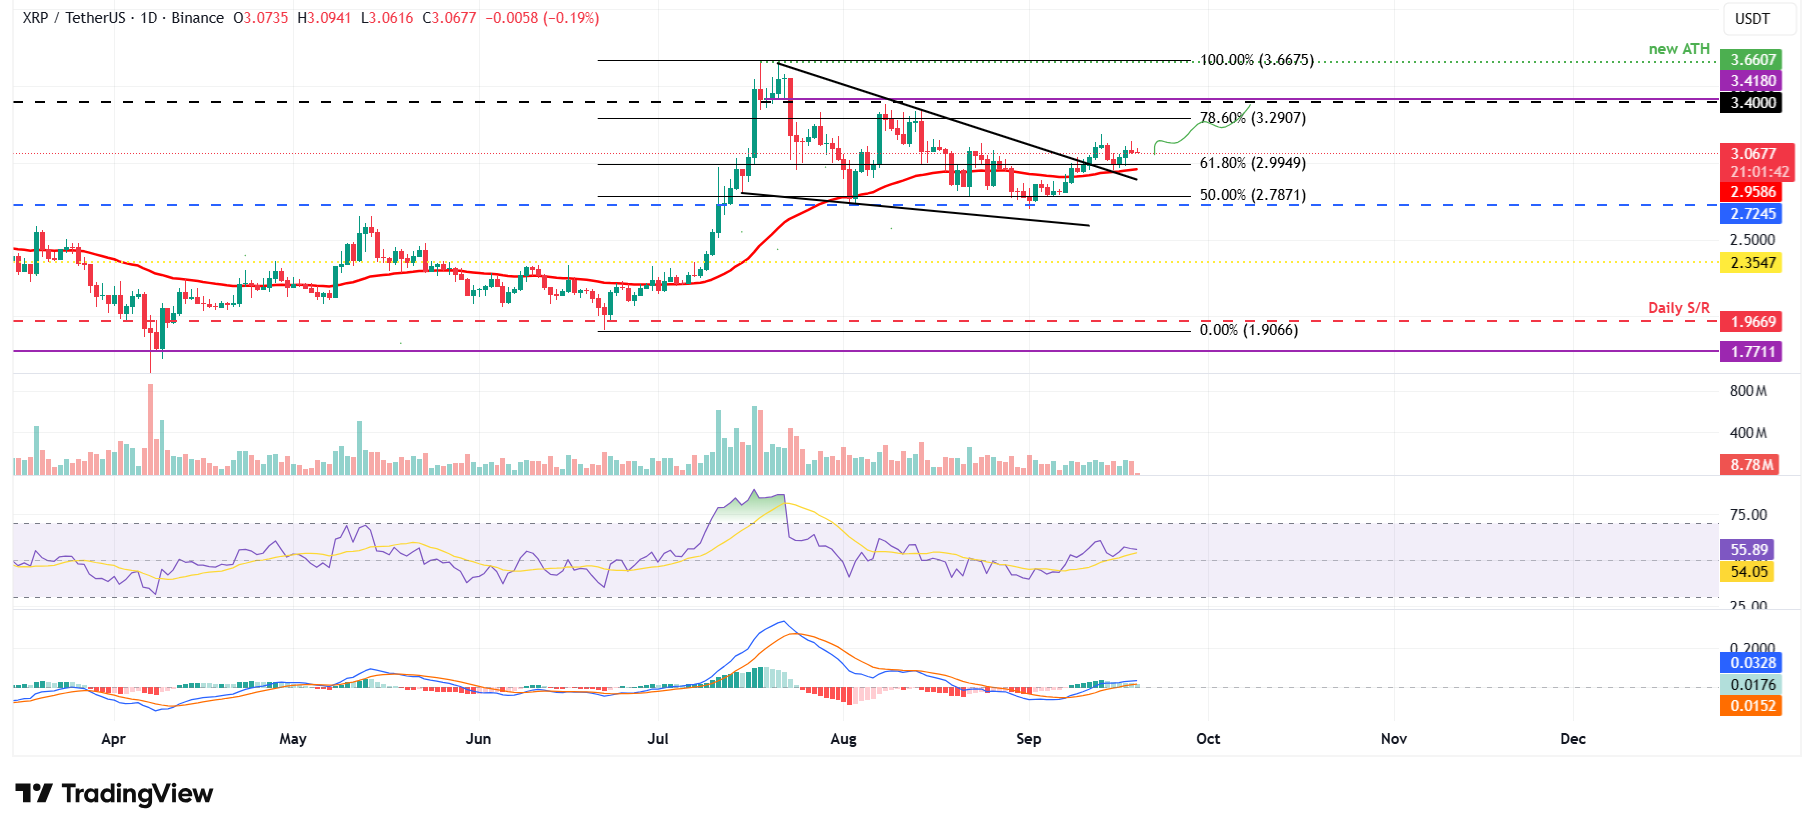
XRP/USDT daily chart
On the other hand, if XRP faces a correction, it could extend the decline toward its 50-day EMA at $2.95.
Bitcoin, altcoins, stablecoins FAQs
Bitcoin is the largest cryptocurrency by market capitalization, a virtual currency designed to serve as money. This form of payment cannot be controlled by any one person, group, or entity, which eliminates the need for third-party participation during financial transactions.
Altcoins are any cryptocurrency apart from Bitcoin, but some also regard Ethereum as a non-altcoin because it is from these two cryptocurrencies that forking happens. If this is true, then Litecoin is the first altcoin, forked from the Bitcoin protocol and, therefore, an “improved” version of it.
Stablecoins are cryptocurrencies designed to have a stable price, with their value backed by a reserve of the asset it represents. To achieve this, the value of any one stablecoin is pegged to a commodity or financial instrument, such as the US Dollar (USD), with its supply regulated by an algorithm or demand. The main goal of stablecoins is to provide an on/off-ramp for investors willing to trade and invest in cryptocurrencies. Stablecoins also allow investors to store value since cryptocurrencies, in general, are subject to volatility.
Bitcoin dominance is the ratio of Bitcoin's market capitalization to the total market capitalization of all cryptocurrencies combined. It provides a clear picture of Bitcoin’s interest among investors. A high BTC dominance typically happens before and during a bull run, in which investors resort to investing in relatively stable and high market capitalization cryptocurrency like Bitcoin. A drop in BTC dominance usually means that investors are moving their capital and/or profits to altcoins in a quest for higher returns, which usually triggers an explosion of altcoin rallies.

FXStreet
超过一百万用户依赖 FXStreet 获取实时市场数据、图表工具、专家洞见和外汇新闻。其全面的经济日历和教育网络研讨会帮助交易者保持信息领先、做出审慎决策。FXStreet 拥有约 60 人的团队,分布在巴塞罗那总部及全球各地区。
Read More


