
Trade The World
Top 3 Price Prediction: Bitcoin, Ethereum, Ripple – Can BTC, ETH, and XRP hold key support levels?
作者 Manish Chhetri
发布日期: 17 Nov 2025 | 修改日期: 17 Nov 2025


POPULAR ARTICLES

Bitcoin (BTC), Ethereum (ETH), and Ripple (XRP) begin the week on a cautious note, trading near their respective support levels. Market sentiment remains fragile following last week’s volatility, with BTC, ETH, and XRP correcting by nearly 10%, 14%, and 7%, respectively.
- Bitcoin price retests its key support at $94,253, if holds could suggest a recovery ahead.
- Ethereum trades near $3,144 on Monday, stabilizing after retesting the crucial $3,017 support level over the weekend.
- XRP steadies around $2.23, pausing after a 6% correction in the previous week.
Bitcoin (BTC), Ethereum (ETH), and Ripple (XRP) begin the week on a cautious note, trading near their respective support levels. Market sentiment remains fragile following last week’s volatility, with BTC, ETH, and XRP correcting by nearly 10%, 14%, and 7%, respectively. If these three cryptocurrencies hold their support levels, BTC, ETH, and XRP could extend their recoveries.
Bitcoin price finds support around a key level
Bitcoin price faced rejection at the 38.20% Fibonacci retracement level at $106,453 (drawn from the April 7 low of $74,508 to the all-time high of $126,299 set on October 6) last week and declined nearly 10%. At the time of writing on Monday, BTC hovers around $95,300.
If BTC finds support around the 61.8% Fibonacci retracement level at $94,253, it could extend the recovery toward the 38.20% Fibonacci retracement level at $106,453.
The Relative Strength Index (RSI) on the daily chart is 33, rebounding from oversold territory, suggesting fading bearish momentum. For the recovery rally to be sustained, the RSI must move above its neutral level.
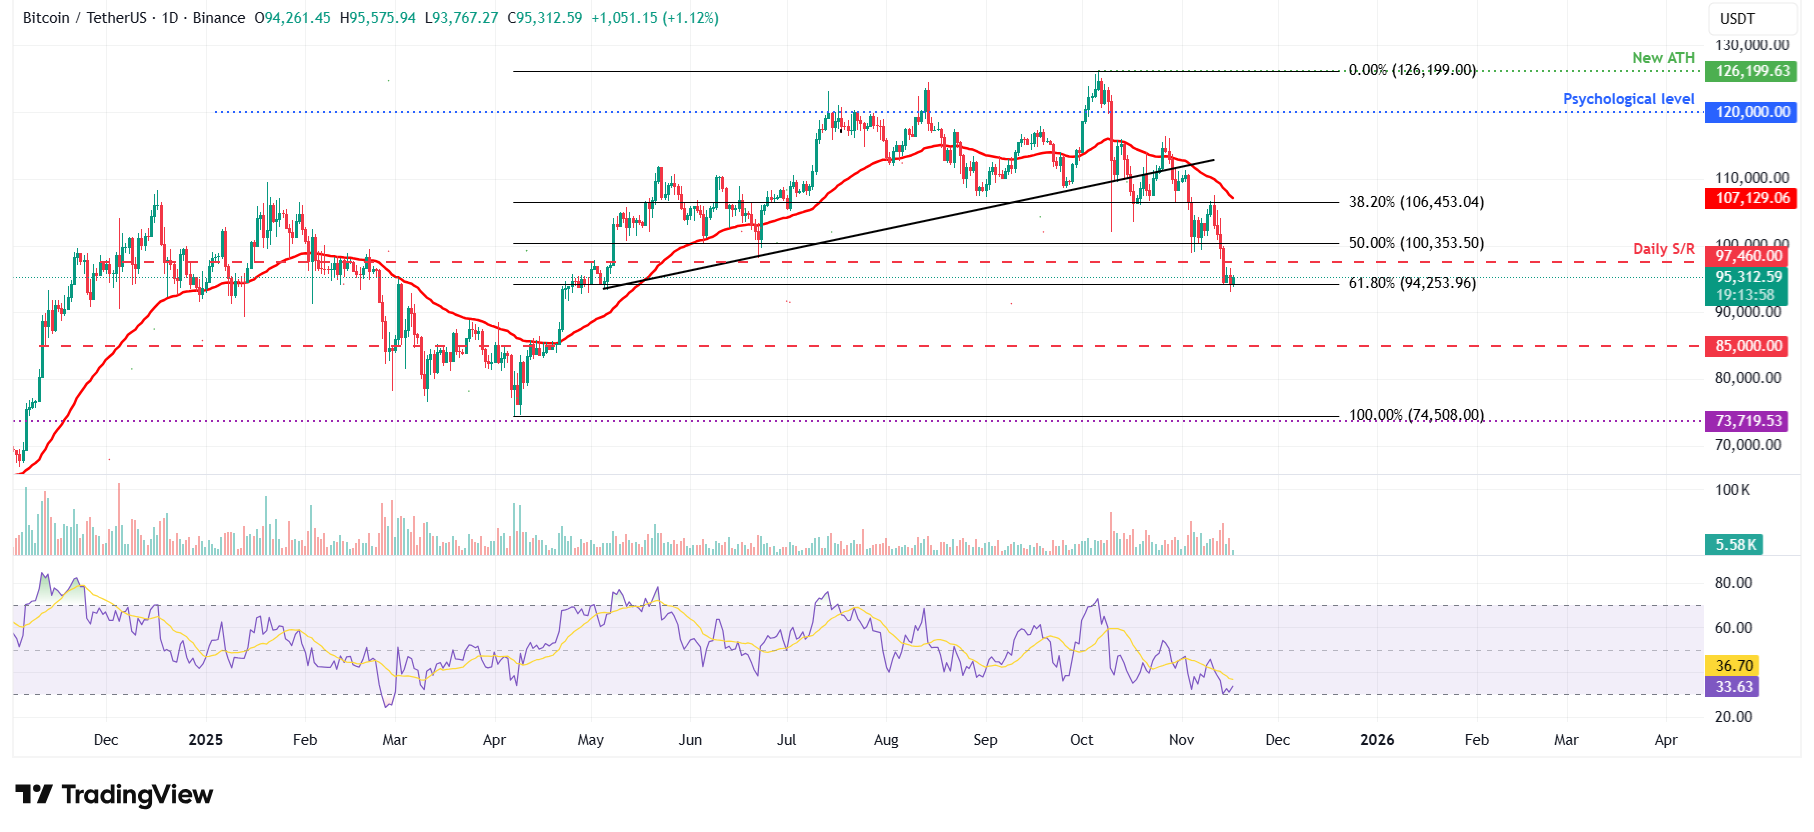
On the other hand, if BTC closes below the $94,253 support level, it could extend the decline toward the key psychological level of $90,000.
Ethereum could recover if the key level holds
Ethereum price faced rejection at the previous broken trendline around $3,592 last week and declined by nearly 14%. At the time of writing on Monday, ETH hovers around $3,100.
If ETH finds support around $3,017, it could extend the recovery toward the key resistance level at $3,592.
Like Bitcoin, Ethereum’s RSI is rebounding from oversold territory, suggesting fading bearish momentum and early signs of recovery.
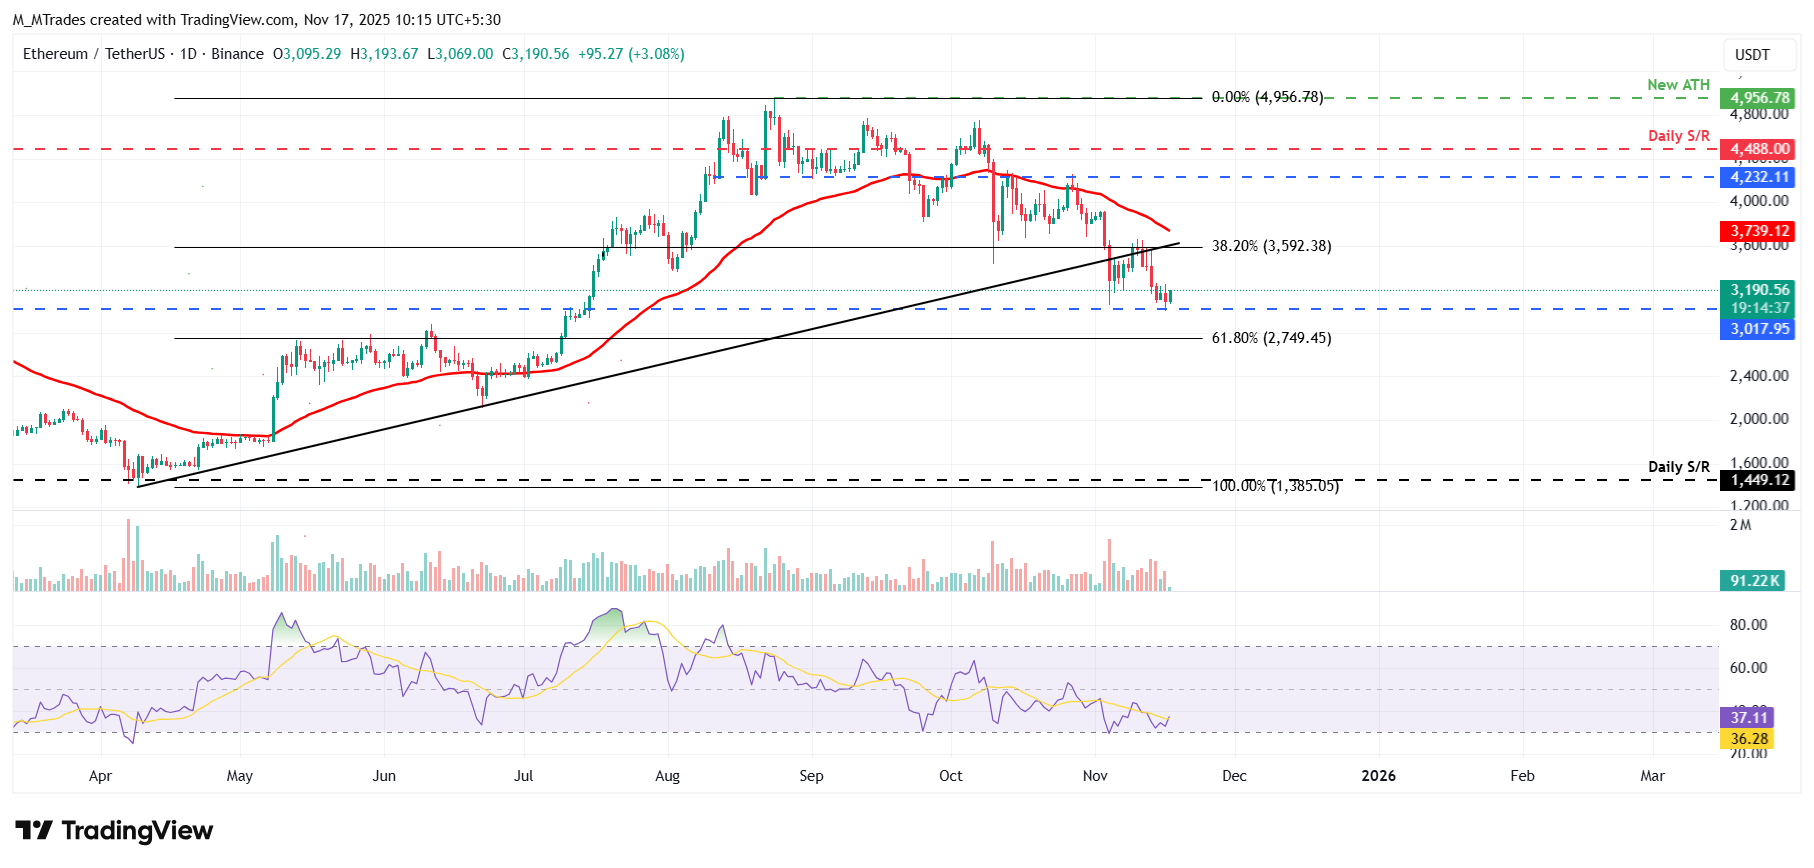
However, if ETH closes below $3,017, it could extend the decline toward the next key support at $2,749.
XRP faces rejection from the 50-day EMA
XRP price found rejection from the 50-day EMA at $2.49 last week and declined nearly 7%. At the time of writing on Monday, XRP hovers around $2.25.
If XRP continues its recovery, it could extend the rally toward the 50-day EMA at $2.49.
The RSI on the daily chart is 42, near its neutral level of 50, suggesting fading bearish momentum. For the recovery rally to be sustained, the RSI must move above the neutral level.
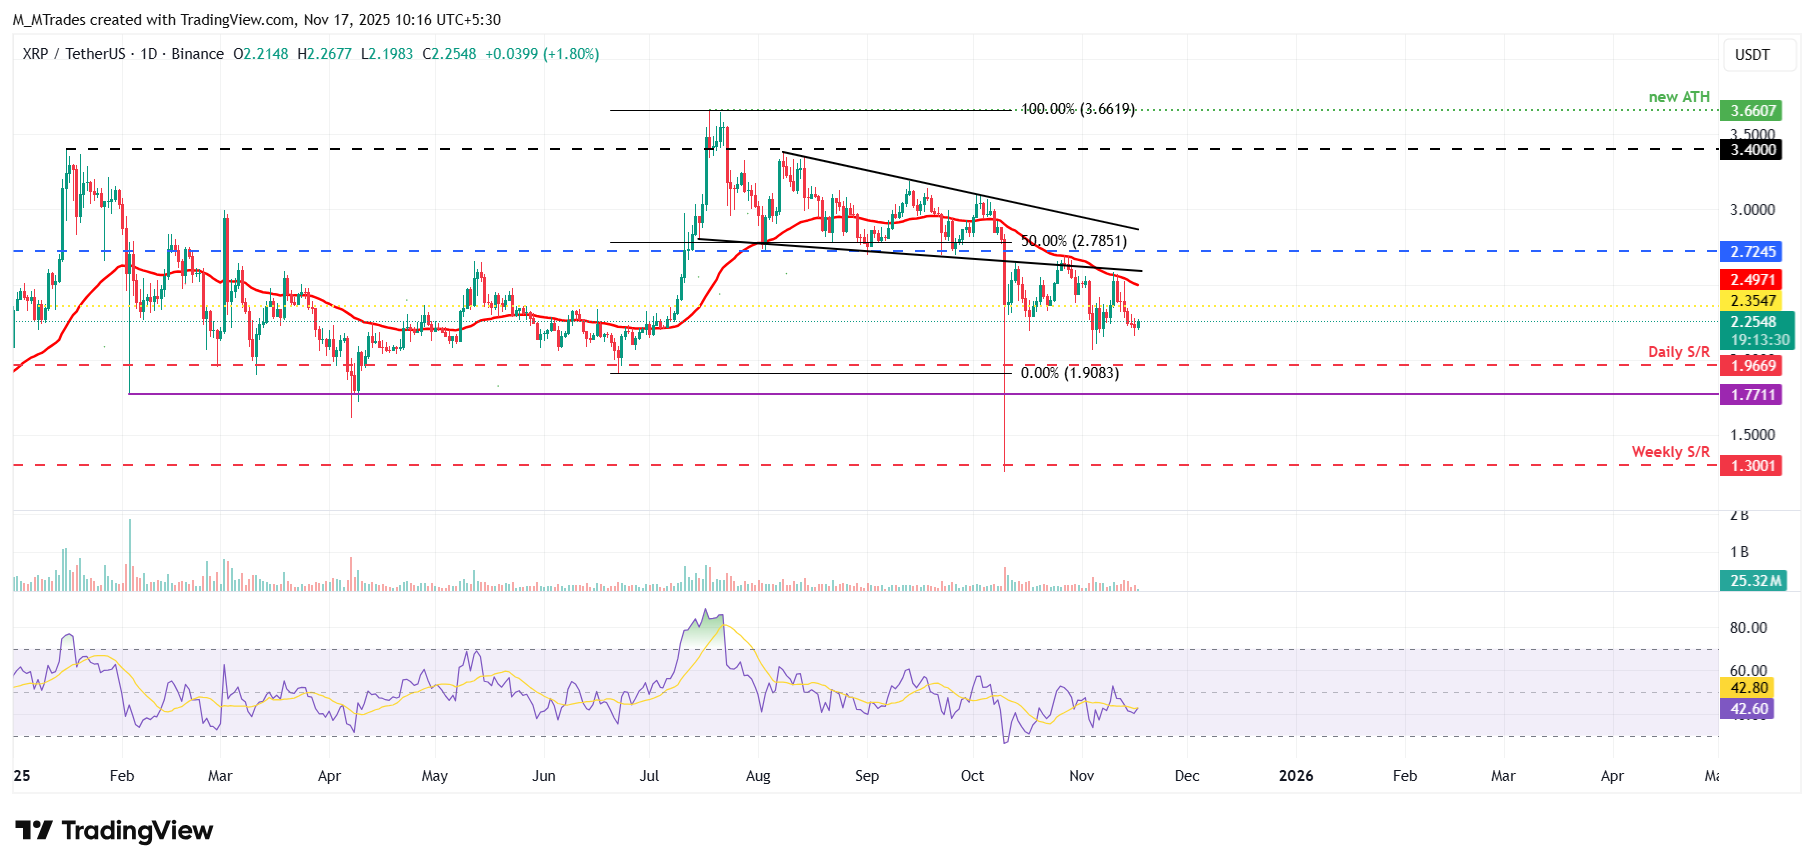
However, if XRP continues its correction, it could extend the decline toward the next daily support at $1.96.
Cryptocurrency metrics FAQs
The developer or creator of each cryptocurrency decides on the total number of tokens that can be minted or issued. Only a certain number of these assets can be minted by mining, staking or other mechanisms. This is defined by the algorithm of the underlying blockchain technology. On the other hand, circulating supply can also be decreased via actions such as burning tokens, or mistakenly sending assets to addresses of other incompatible blockchains.
Market capitalization is the result of multiplying the circulating supply of a certain asset by the asset’s current market value.
Trading volume refers to the total number of tokens for a specific asset that has been transacted or exchanged between buyers and sellers within set trading hours, for example, 24 hours. It is used to gauge market sentiment, this metric combines all volumes on centralized exchanges and decentralized exchanges. Increasing trading volume often denotes the demand for a certain asset as more people are buying and selling the cryptocurrency.
Funding rates are a concept designed to encourage traders to take positions and ensure perpetual contract prices match spot markets. It defines a mechanism by exchanges to ensure that future prices and index prices periodic payments regularly converge. When the funding rate is positive, the price of the perpetual contract is higher than the mark price. This means traders who are bullish and have opened long positions pay traders who are in short positions. On the other hand, a negative funding rate means perpetual prices are below the mark price, and hence traders with short positions pay traders who have opened long positions.

FXStreet
超过一百万用户依赖 FXStreet 获取实时市场数据、图表工具、专家洞见和外汇新闻。其全面的经济日历和教育网络研讨会帮助交易者保持信息领先、做出审慎决策。FXStreet 拥有约 60 人的团队,分布在巴塞罗那总部及全球各地区。
Read More


