
Trade The World
Top Crypto Losers: Starknet, Telcoin and MYX Finance extend losses as Bitcoin dips below $86,000
作者 Manish Chhetri
发布日期: 21 Nov 2025 | 修改日期: 21 Nov 2025


POPULAR ARTICLES

Starknet (STRK), Telcoin (TEL) and MYX Finance (MYX) continued to face selling pressure on Friday as Bitcoin (BTC) slipped below $86,000, dragging smaller cryptocurrencies down. According to the CoinGecko data, STRK, TEL, and MYX have corrected by more than 18% over the last 24 hours.
- Starknet price trades in red on Friday after falling more the 10% in the previous day.
- Telcoin price slips below $0.005, extending losses.
- MYX Finance trades below $2.47 after being rejected by the 50-day EMA earlier this week.
Starknet (STRK), Telcoin (TEL) and MYX Finance (MYX) continued to face selling pressure on Friday as Bitcoin (BTC) slipped below $86,000, dragging smaller cryptocurrencies down. According to the CoinGecko data, STRK, TEL, and MYX have corrected by more than 18% over the last 24 hours. The technical outlook for these altcoins suggests further losses as the broader bearish sentiment dominates the crypto market.
Starknet faces rejection from the key resistance zone
Starknet price retested the 61.8% Fibonacci retracement level at $0.26 (drawn from January 21 high of $0.40 to the October low at $0.03) on Wednesday and declined 10.36% the next day. At the time of writing on Friday, STRK continues to trade down at $0.22.
If STRK continues its correction, it could extend the decline toward the daily support at $0.15.
The Relative Strength Index (RSI) on the daily chart stands at 63, having pulled back from the overbought zone earlier this week and signaling a fading bullish momentum. If the RSI drops below the neutral 50 level, STRK could be at risk of a deeper correction.
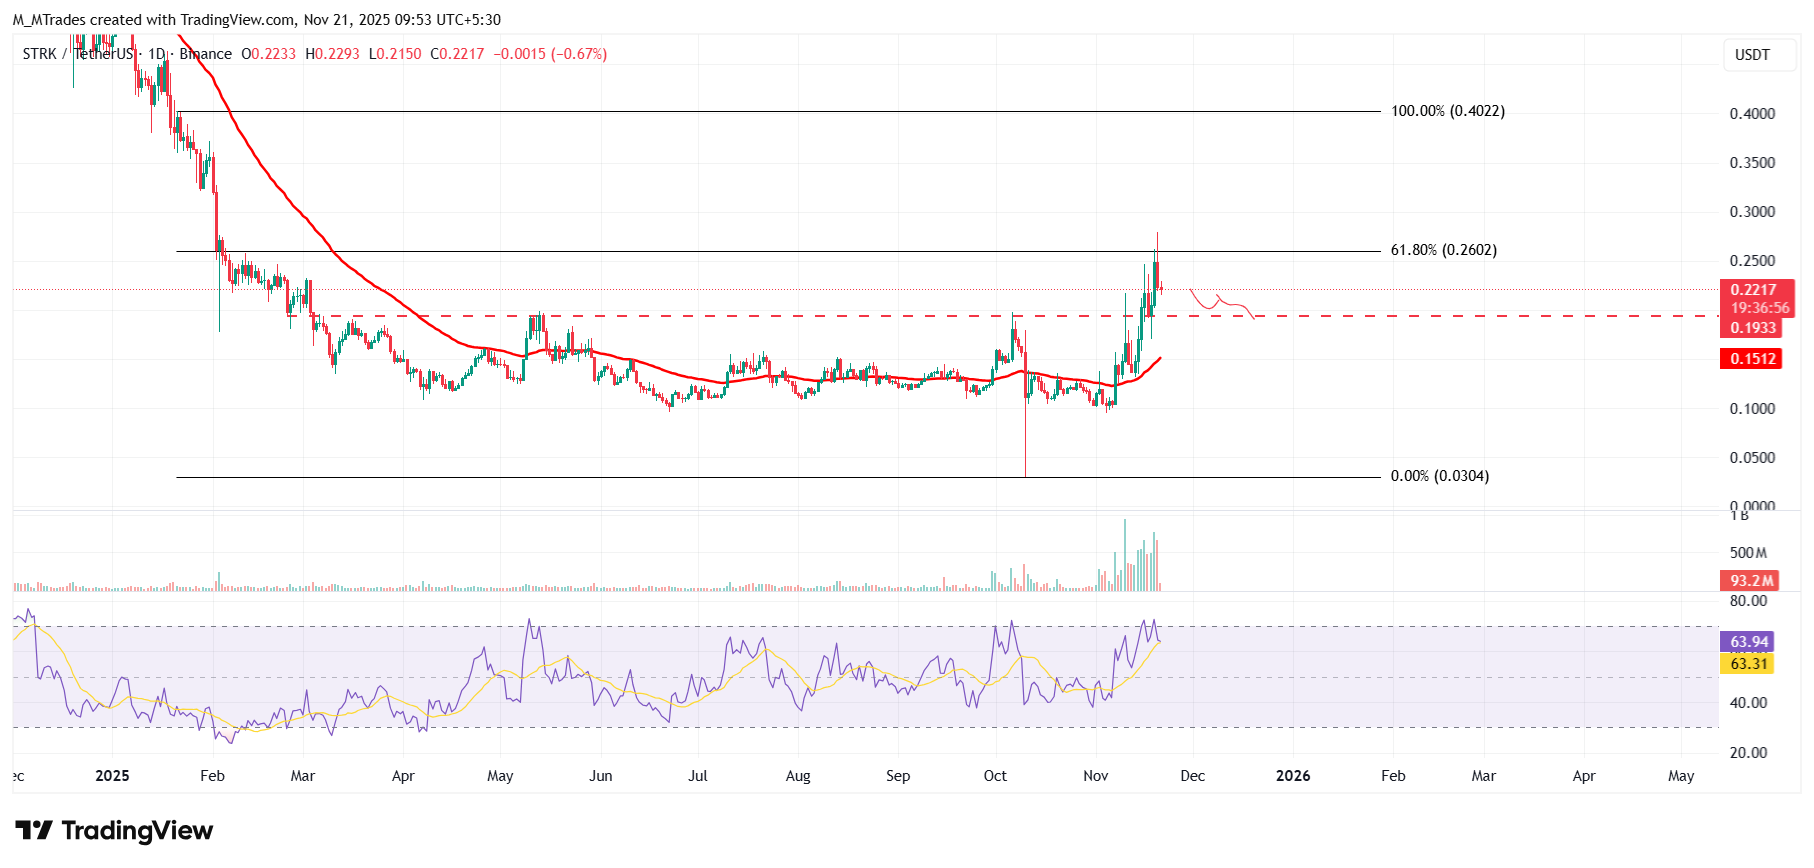
On the other hand, if STRK recovers, it could extend the recovery toward the 61.8% Fibonacci level at $0.26.
Telcoin slips below $0.005, as bears tighten control
Telcoin's price faced rejection at the daily resistance of $0.007 on Tuesday and declined by more than 21% over the next two days. At the time of writing on Friday, TEL continues to trade down at $0.005.
If TEL continues its pullback, it could extend the decline toward the 50-day Exponential Moving Average (EMA) at $0.004.
The RSI on the daily chart stands at 54, having pulled back from the overbought zone earlier this week and signaling a fading bullish momentum. If the RSI drops below the neutral 50 level, Telcoin could be at risk of a deeper correction.
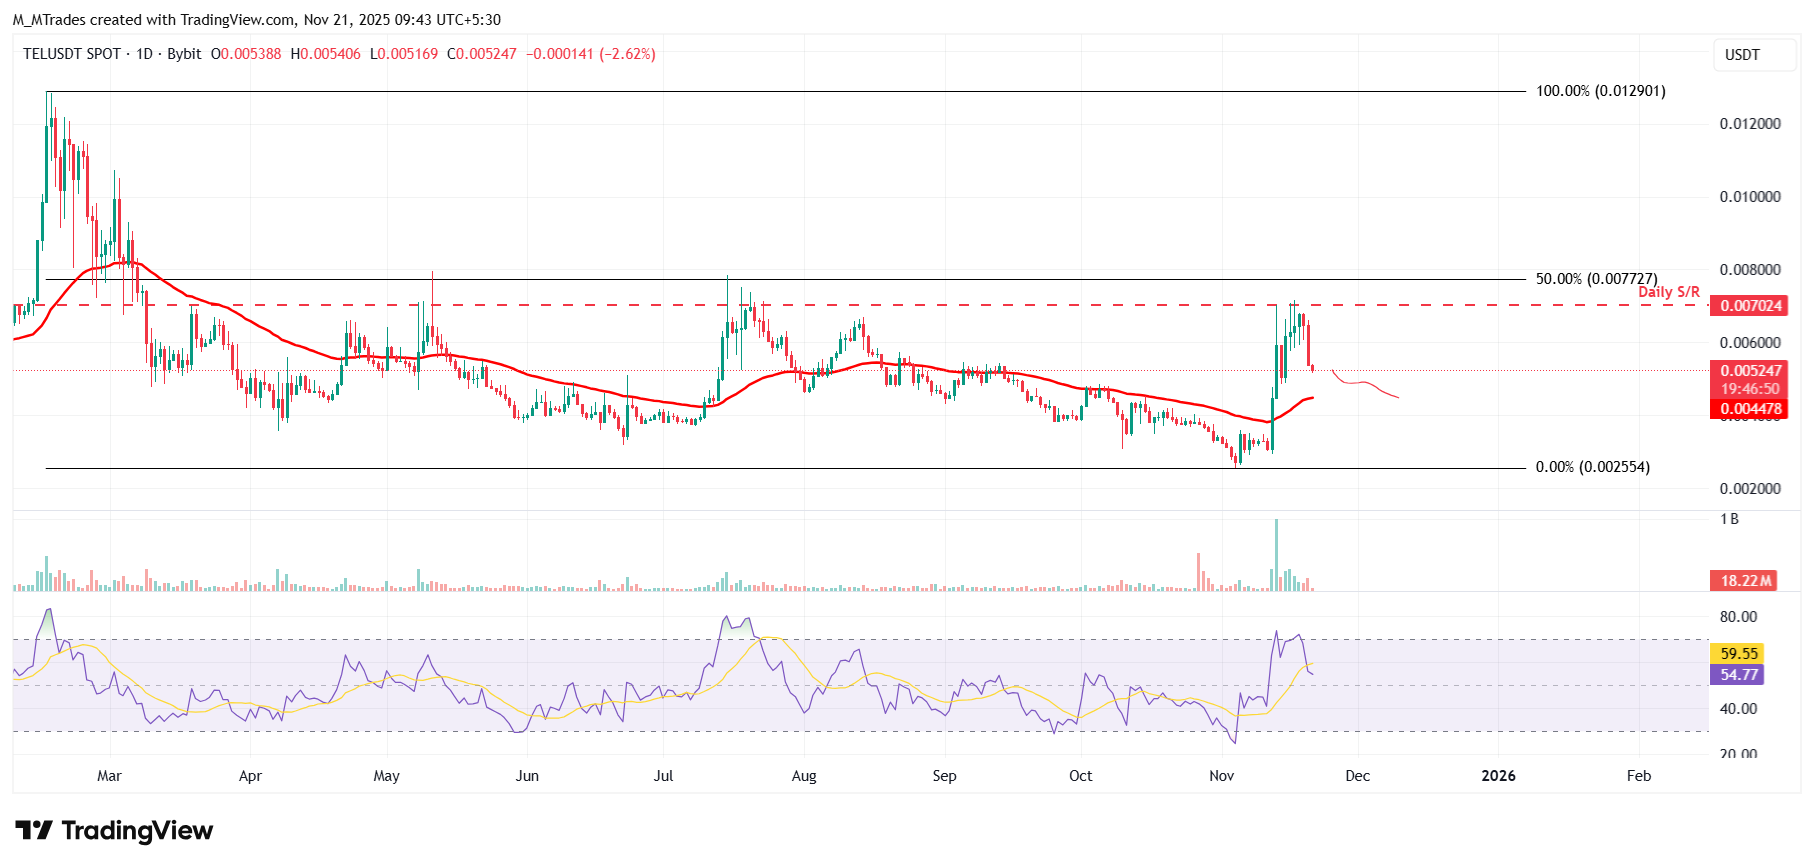
However, if TEL recovers, it could extend the rally toward the daily resistance at $0.007.
MYX Finance shows bearish signs in the momentum indicator
MYX Finance price faced rejection from the 50-day EMA at $3.49 on Wednesday and declined 17% the next day. This 50-day EMA roughly coincides with the daily resistance at $3.36, making this a key resistance zone. At the time of writing on Friday, MYX is trading red at around $2.49.
If MYX continues its correction, it could extend the decline toward the November 3 low of $1.69.
The RSI reads 45, below its neutral level of 50, indicating bearish momentum gaining traction.
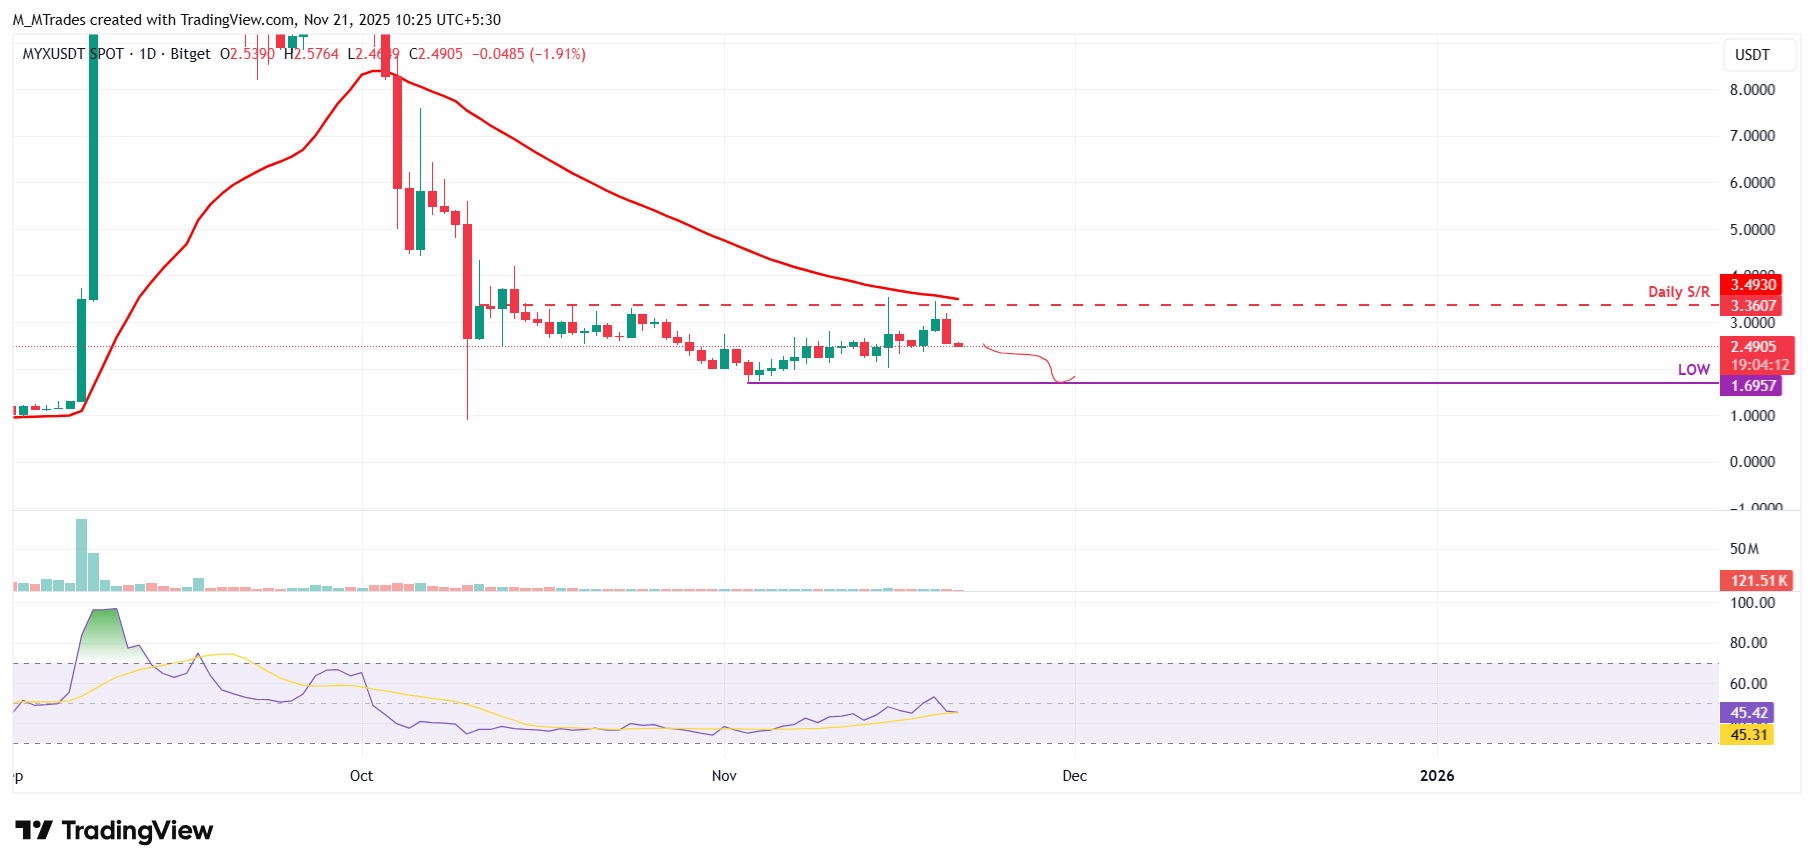
If MYX recovers, it could extend the recovery toward the 50-day EMA at $3.49.

FXStreet
超过一百万用户依赖 FXStreet 获取实时市场数据、图表工具、专家洞见和外汇新闻。其全面的经济日历和教育网络研讨会帮助交易者保持信息领先、做出审慎决策。FXStreet 拥有约 60 人的团队,分布在巴塞罗那总部及全球各地区。
Read More


