
Trade The World
USD/CAD Price Forecast: Falls toward lower ascending channel boundary near 1.4000
作者 Akhtar Faruqui
发布日期: 27 Nov 2025 | 修改日期: 27 Nov 2025


POPULAR ARTICLES

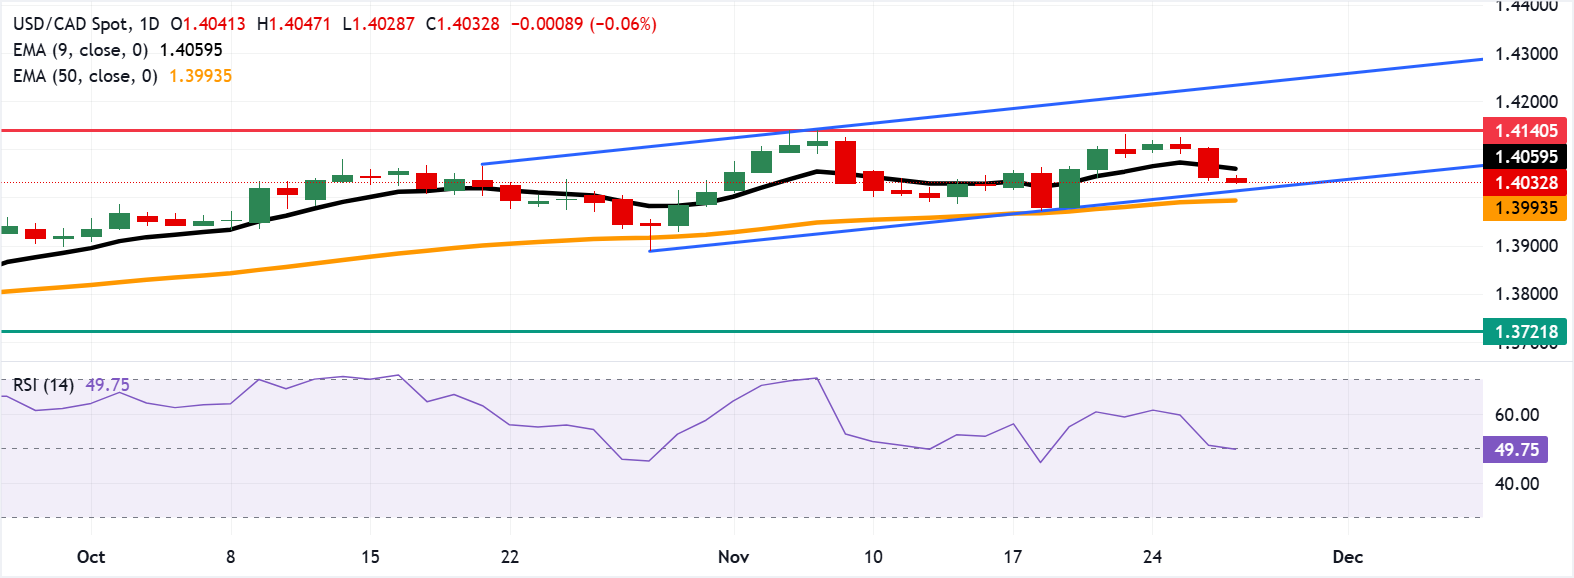
USD/CAD extends its losses for the third successive session, trading around 1.4030 during the Asian hours on Thursday. The daily chart’s technical setup reflects a persistent bullish bias, with the pair remaining within its ascending channel pattern.
- USD/CAD may find a primary barrier at the nine-day EMA of 1.4059.
- The 14-day Relative Strength Index has slipped to a neutral 49.00, indicating a fading bullish impulse.
- The primary support lies around the ascending channel’s lower boundary at 1.4020.
USD/CAD extends its losses for the third successive session, trading around 1.4030 during the Asian hours on Thursday. The daily chart’s technical setup reflects a persistent bullish bias, with the pair remaining within its ascending channel pattern.
The USD/CAD pair holds above the rising 50-day Exponential Moving Average (EMA) at 1.3990, while the nine-day EMA at 1.4059 caps the topside. This keeps the broader bias supported by the medium-term average, yet near-term momentum is constrained under the short-term gauge.
The 14-day Relative Strength Index (RSI) at 49.00 (neutral) has eased from previous readings, signaling a waning bullish impulse. RSI near its midline reinforces a balanced backdrop, so a decisive move through either moving average would be needed to set direction.
The USD/CAD pair may find the immediate resistance at the nine-day EMA of 1.4059. A break above this level would improve the short-term price momentum and lead the pair to test the seven-month high of 1.4140, reached on November 5. Further advances above this level would support the pair to explore the region around the upper boundary of the ascending channel at 1.4240.
On the downside, the initial support appears at the ascending channel’s lower boundary around 1.4020, followed by the psychological level of 1.4000 and the 50-day EMA of 1.3990. A break below this confluence support zone would weaken the bullish bias and put downward pressure on the USD/CAD pair to navigate the region around the four-month low of 1.3721.
(The technical analysis of this story was written with the help of an AI tool)
Canadian Dollar Price Today
The table below shows the percentage change of Canadian Dollar (CAD) against listed major currencies today. Canadian Dollar was the strongest against the US Dollar.
| USD | EUR | GBP | JPY | CAD | AUD | NZD | CHF | |
|---|---|---|---|---|---|---|---|---|
| USD | -0.09% | -0.20% | -0.36% | -0.07% | -0.27% | -0.58% | -0.12% | |
| EUR | 0.09% | -0.11% | -0.27% | 0.02% | -0.18% | -0.49% | -0.03% | |
| GBP | 0.20% | 0.11% | -0.17% | 0.13% | -0.09% | -0.39% | 0.08% | |
| JPY | 0.36% | 0.27% | 0.17% | 0.27% | 0.09% | -0.25% | 0.24% | |
| CAD | 0.07% | -0.02% | -0.13% | -0.27% | -0.18% | -0.49% | -0.05% | |
| AUD | 0.27% | 0.18% | 0.09% | -0.09% | 0.18% | -0.31% | 0.15% | |
| NZD | 0.58% | 0.49% | 0.39% | 0.25% | 0.49% | 0.31% | 0.46% | |
| CHF | 0.12% | 0.03% | -0.08% | -0.24% | 0.05% | -0.15% | -0.46% |
The heat map shows percentage changes of major currencies against each other. The base currency is picked from the left column, while the quote currency is picked from the top row. For example, if you pick the Canadian Dollar from the left column and move along the horizontal line to the US Dollar, the percentage change displayed in the box will represent CAD (base)/USD (quote).

FXStreet
超过一百万用户依赖 FXStreet 获取实时市场数据、图表工具、专家洞见和外汇新闻。其全面的经济日历和教育网络研讨会帮助交易者保持信息领先、做出审慎决策。FXStreet 拥有约 60 人的团队,分布在巴塞罗那总部及全球各地区。
Read More


