

Worldcoin Price Forecast: WLD surges 20% amid DeFi integration, growing demand
- Worldcoin extends gains by 20%, testing resistance at $0.40 on Tuesday.
- The integration of DeFi aggregator Oko Trade with the World App introduces trading incentives for WLD users.
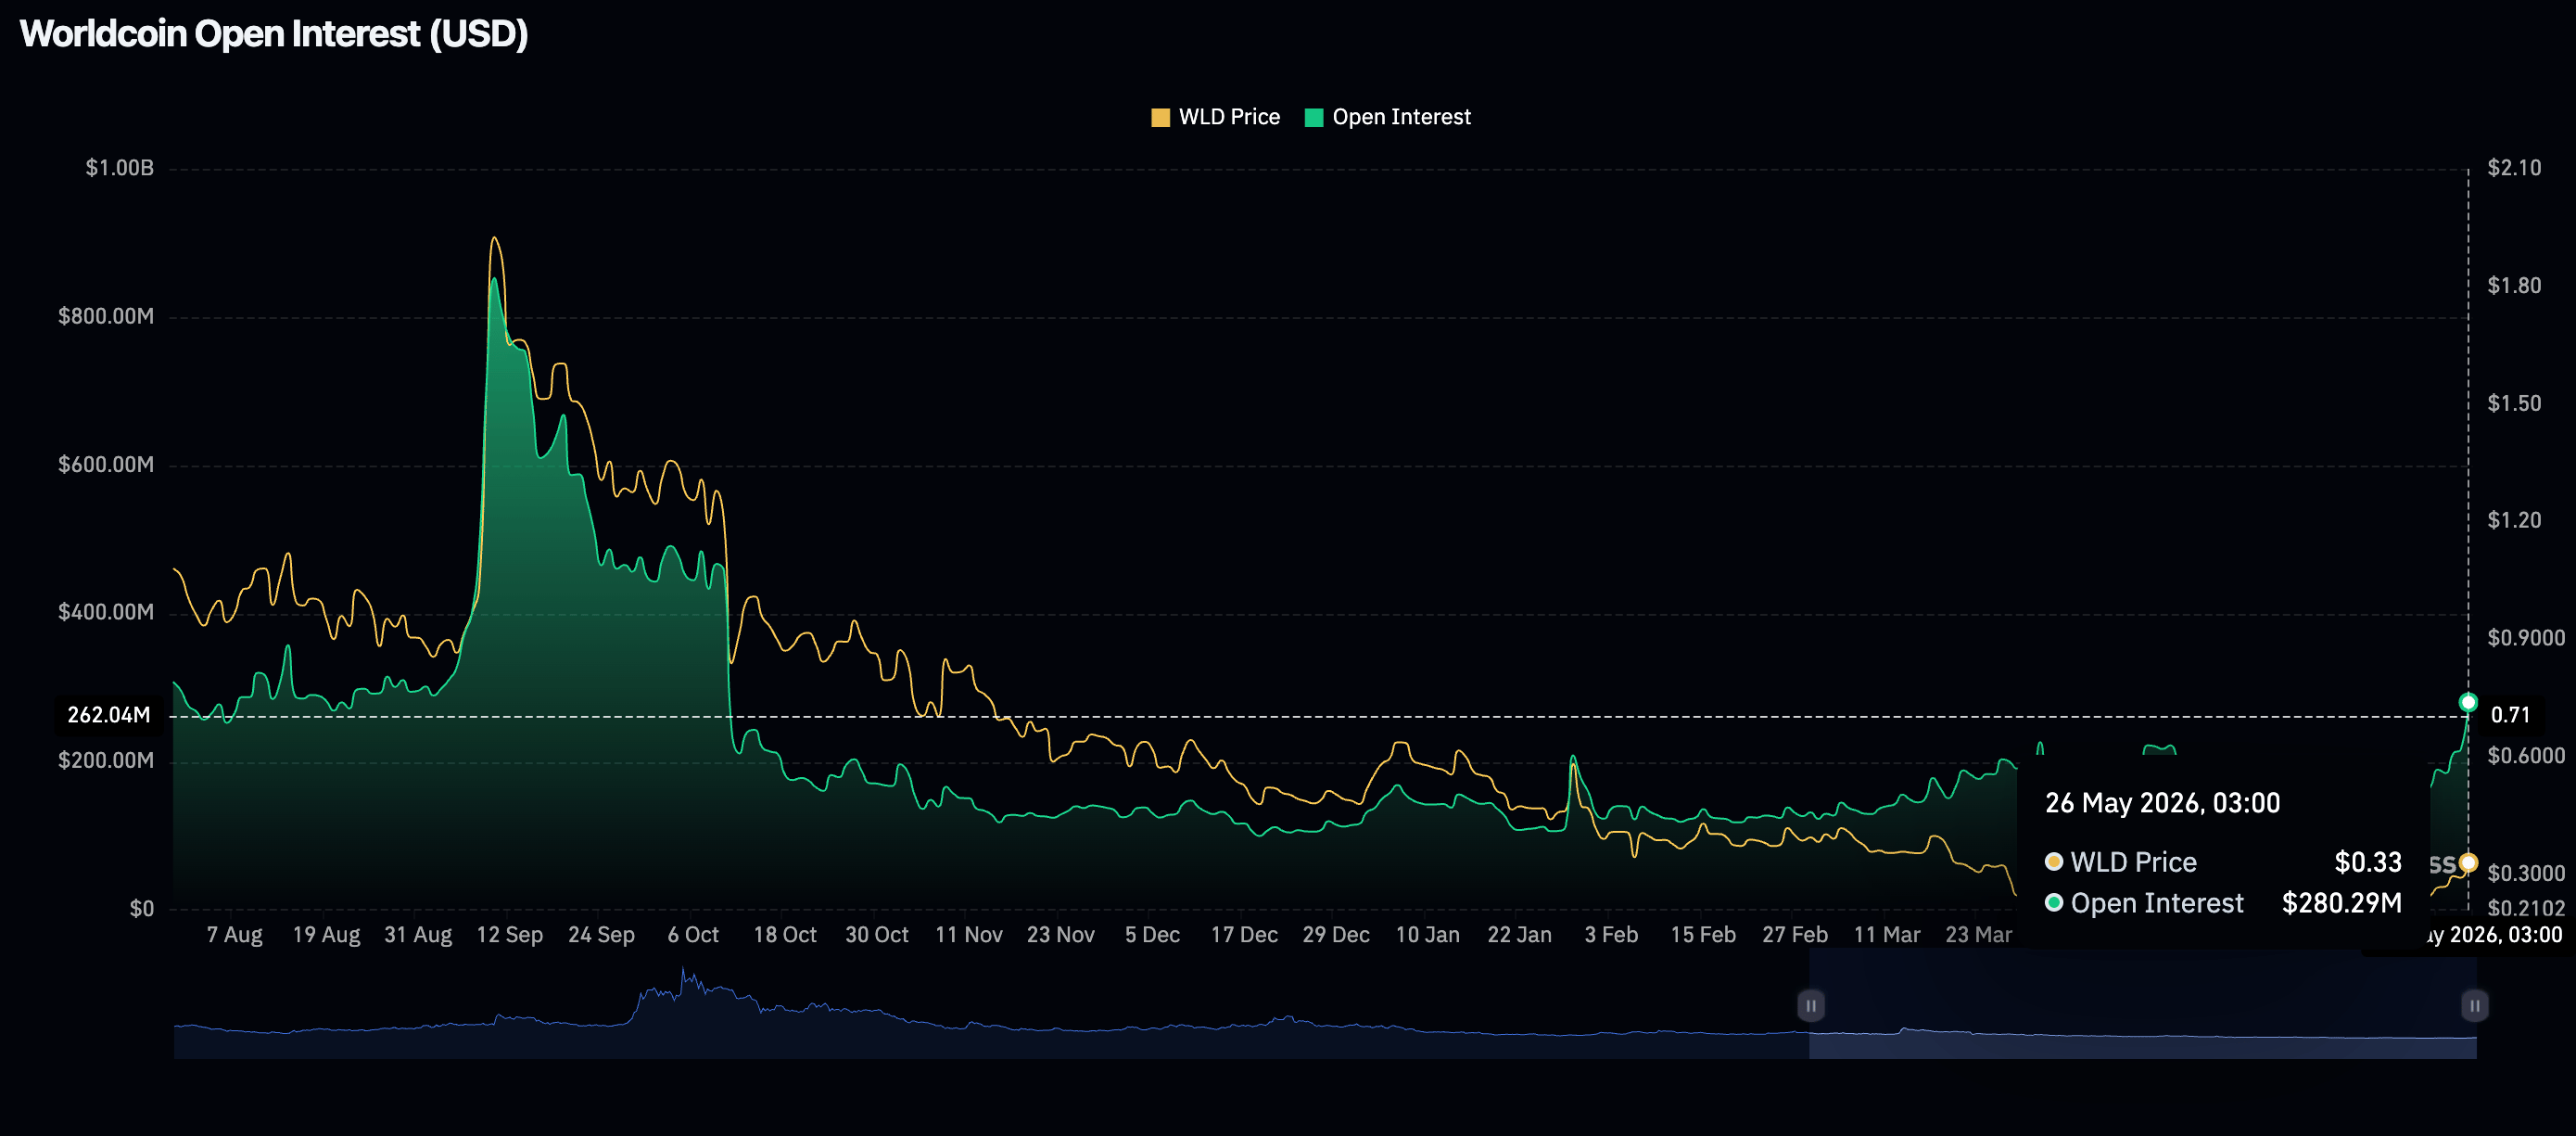
- WLD rises in tandem with retail demand as futures Open Interest expands to $280 million.
Worldcoin (WLD) extends its recovery near the supply threshold at $0.40 at the time of writing on Tuesday, as demand for the Artificial Intelligence (AI) token broadly increases. The 20% surge builds on growing adoption within the ecosystem, supported by the integration of a decentralized finance (DeFi) aggregator.

World App taps Oko Trade for trading incentives
Worldcoin has integrated World App with Oko Trade, a DeFi integrator, to provide WLD users with structured trading incentives. The incentives include weekly swap competitions that enable users to earn up to 100 WLD for leading spots, as well as prizes and raffles. This support directly impacts on-chain activity and token utility while driving demand within the Worldcoin ecosystem.
Oko Trade states that it “has created the most efficient order-routing solution by aggregating the top routers on Worldchain into a simple, intuitive, and accessible interface.”
Retail demand returns as Worldcoin rallies
The surge in demand for Worldcoin is reflected in futures Open Interest (OI) climbing to $281 million on Tuesday, from $217 million the previous day and $142 million on May 18. This notable increase shows that investors are increasingly seeking exposure to WLD by opening new positions. A sustained increase in OI remains critical to upholding Worldcoin’s short to medium-term outlook.
Price analysis: Worldcoin gains momentum
Worldcoin trades near $0.40 after pushing decisively above its short- and medium-term Exponential Moving Averages (EMAs). The 50-day EMA at $0.28 and 100-day EMA at $0.33 appear to have tilted the near-term bias firmly bullish while leaving the longer-term 200-day EMA at $0.46 as the next structural cap.
Momentum conditions are strong, with the Relative Strength Index (RSI) at overbought levels near 80 on the daily chart and the Moving Average Convergence Divergence (MACD) histogram firmly positive and widening, which suggests the advance is strong but increasingly stretched.
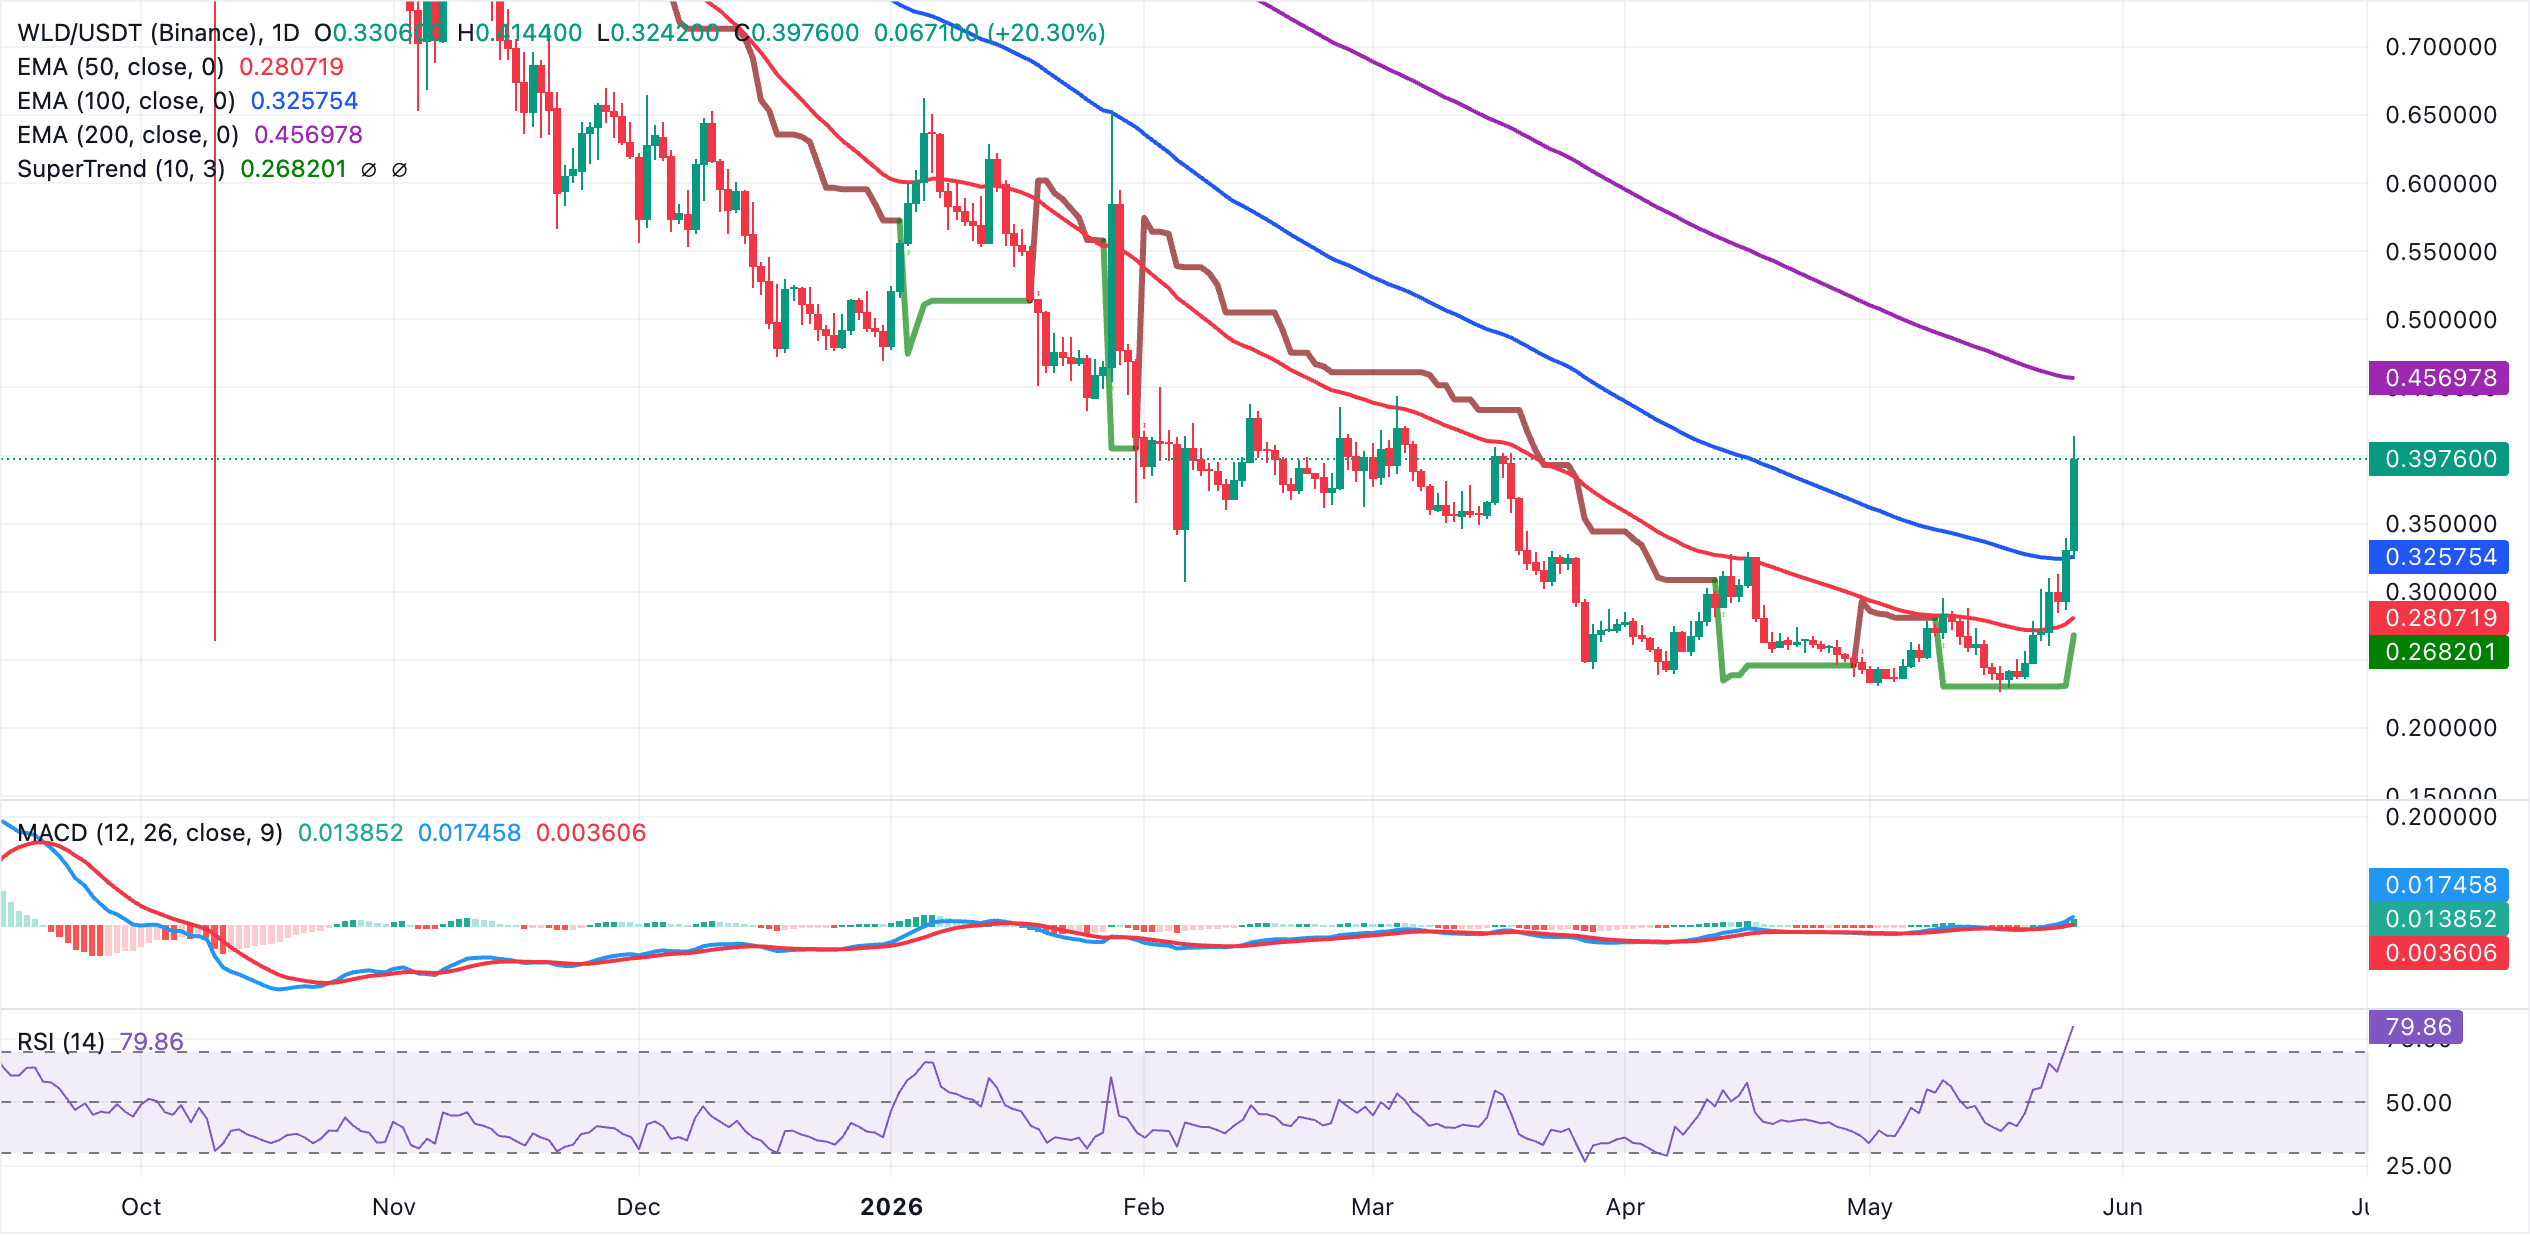
On the topside, initial resistance lies at the 200-day EMA around $0.46, where a rejection would signal that the broader downtrend is still intact. On the downside, immediate support is seen near the current region around $0.39 with deeper cushions at the 100-day EMA at $0.33 and the 50-day EMA at $0.28. The SuperTrend line at $0.27 reinforces this area as a more distant bullish line in the sand in the event of a sharper corrective pullback.
(The technical analysis of this story was written with the help of an AI tool.)
Open Interest, funding rate FAQs
Higher Open Interest is associated with higher liquidity and new capital inflow to the market. This is considered the equivalent of increase in efficiency and the ongoing trend continues. When Open Interest decreases, it is considered a sign of liquidation in the market, investors are leaving and the overall demand for an asset is on a decline, fueling a bearish sentiment among investors.
Funding fees bridge the difference between spot prices and prices of futures contracts of an asset by increasing liquidation risks faced by traders. A consistently high and positive funding rate implies there is a bullish sentiment among market participants and there is an expectation of a price hike. A consistently negative funding rate for an asset implies a bearish sentiment, indicating that traders expect the cryptocurrency’s price to fall and a bearish trend reversal is likely to occur.














