

Bonk Price Forecast: Extends losses as hacker moves stolen tokens to Binance
- Bonk price extends its losses on Friday, falling more than 16% so far this week.
- Lookonchain data shows that the hacker deposited some stolen BONK tokens on Binance, increasing selling pressure.
- Traders should be cautious, as the hacker still holds roughly $10.85 million in BONK, raising the risk of further downside.
Bonk (BONK) extends its losses, trading below $0.0000034 on Friday, losing over 16% so far this week. The ongoing correction was fueled by on-chain data indicating that the hacker behind the recent exploit transferred a portion of the stolen tokens to Binance. The move has heightened concerns about increased selling pressure, while the hacker still holds roughly $10.85 million in BONK, leaving the meme coin vulnerable to further declines.

Stolen BONK transfers to Binance weigh on price outlook
Lookonchain data shows that the hacker who had stolen $21.2 million the previous week deposited $4.11 million worth of BONK on Binance on Friday.
As explained in the previous report, if the attackers move the stolen BONK tokens to exchanges to liquidate their holdings, it would bring renewed selling pressure, causing BONK to slip more. Since the hack on July 6, Bonk price has corrected more than 26% as of Friday.
Moreover, traders should still be cautious, as the hacker still holds roughly $10.85 million in BONK, raising the risk of further downside.
Bonk Price Forecast: How low can BONK go?
Bonk price faced rejection from the 50-day Exponential Moving Average (EMA) around $0.0000045 on July 6 and corrected more than 26% so far this Friday, trading at $0.0000032.
If the meme coin continues its correction, it could extend the losses toward the key psychological support at $0.0000030.
Momentum indicators show bears in control. The Relative Strength Index (RSI) on the daily chart reads 30, near the oversold level, indicating strong bearish momentum. Meanwhile, the Moving Average Convergence Divergence (MACD) continues to signal a bearish crossover, with rising red histogram bars, which support the negative outlook.
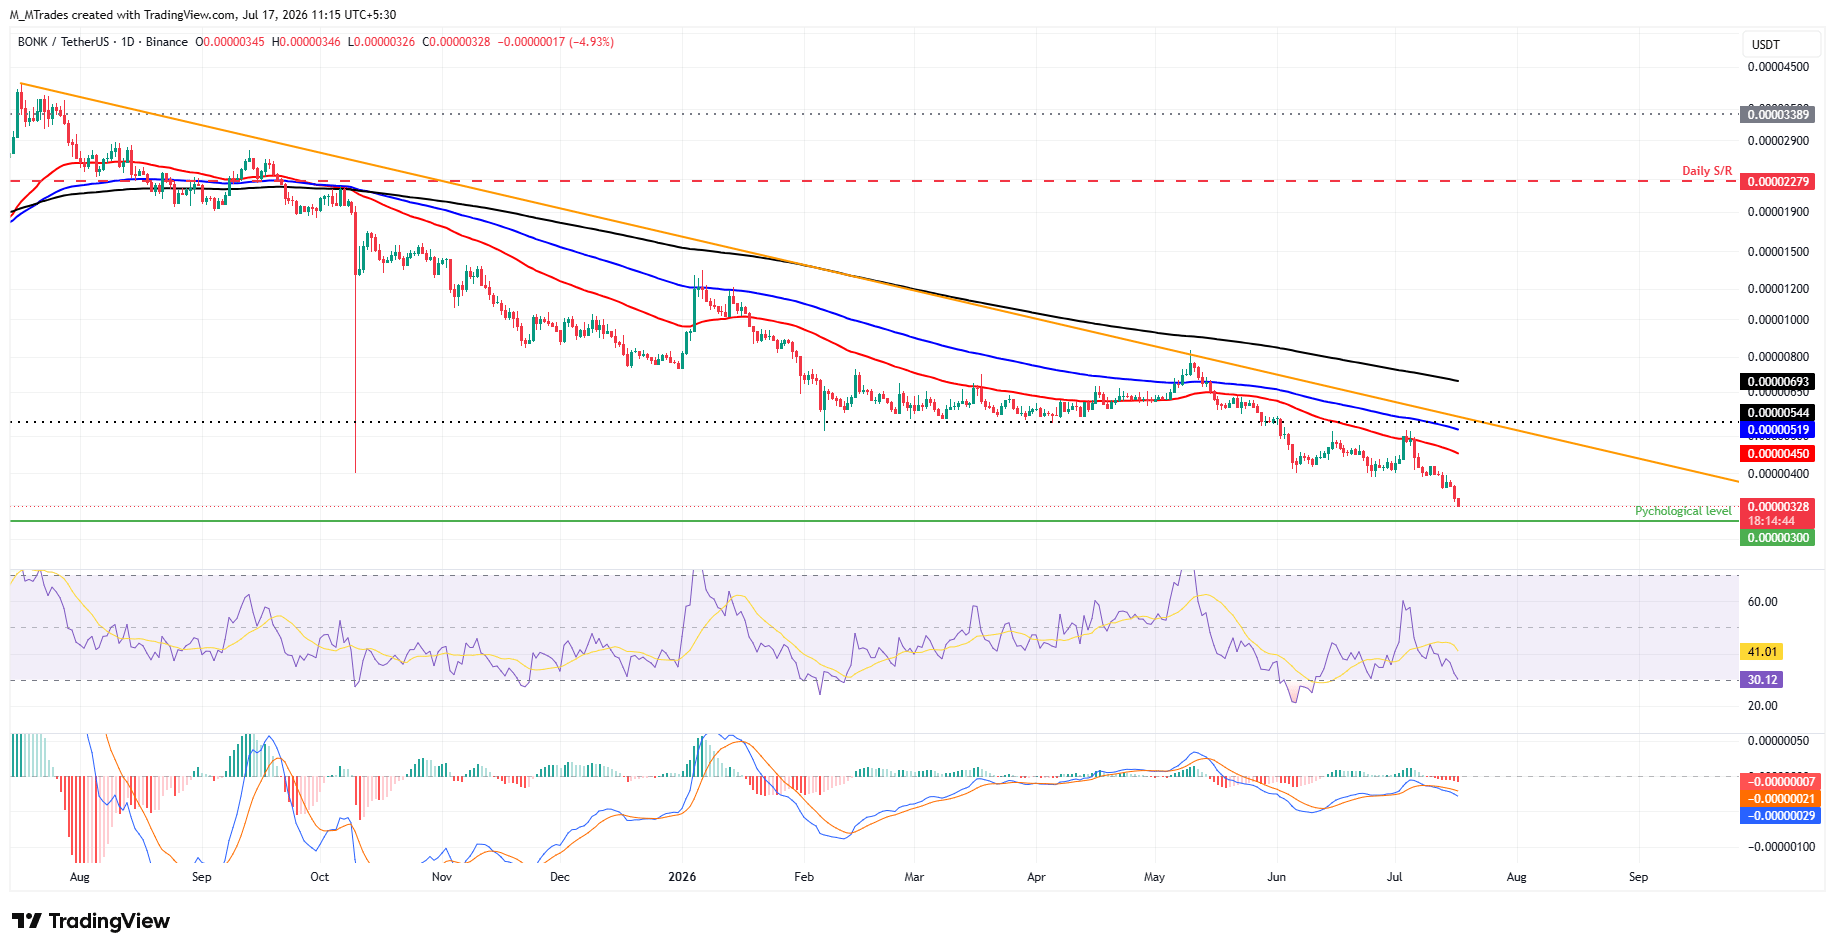
If BONK recovers, it could extend the advance toward the 50-day EMA at $0.0000045.














