

Ethereum Price Forecast: Declining active addresses weigh on ETH as open interest climbs to record high
- Active addresses on Ethereum have dropped by over 50% since February, reflecting a rapid decline in onchain usage.
- ETH ETFs have recorded 12 consecutive days of net outflows, their longest streak since March 2025.
- Ethereum open interest hit a record high above 16.1 million ETH amid prices plunging below $2,000.
- ETH could find support at $1,909.
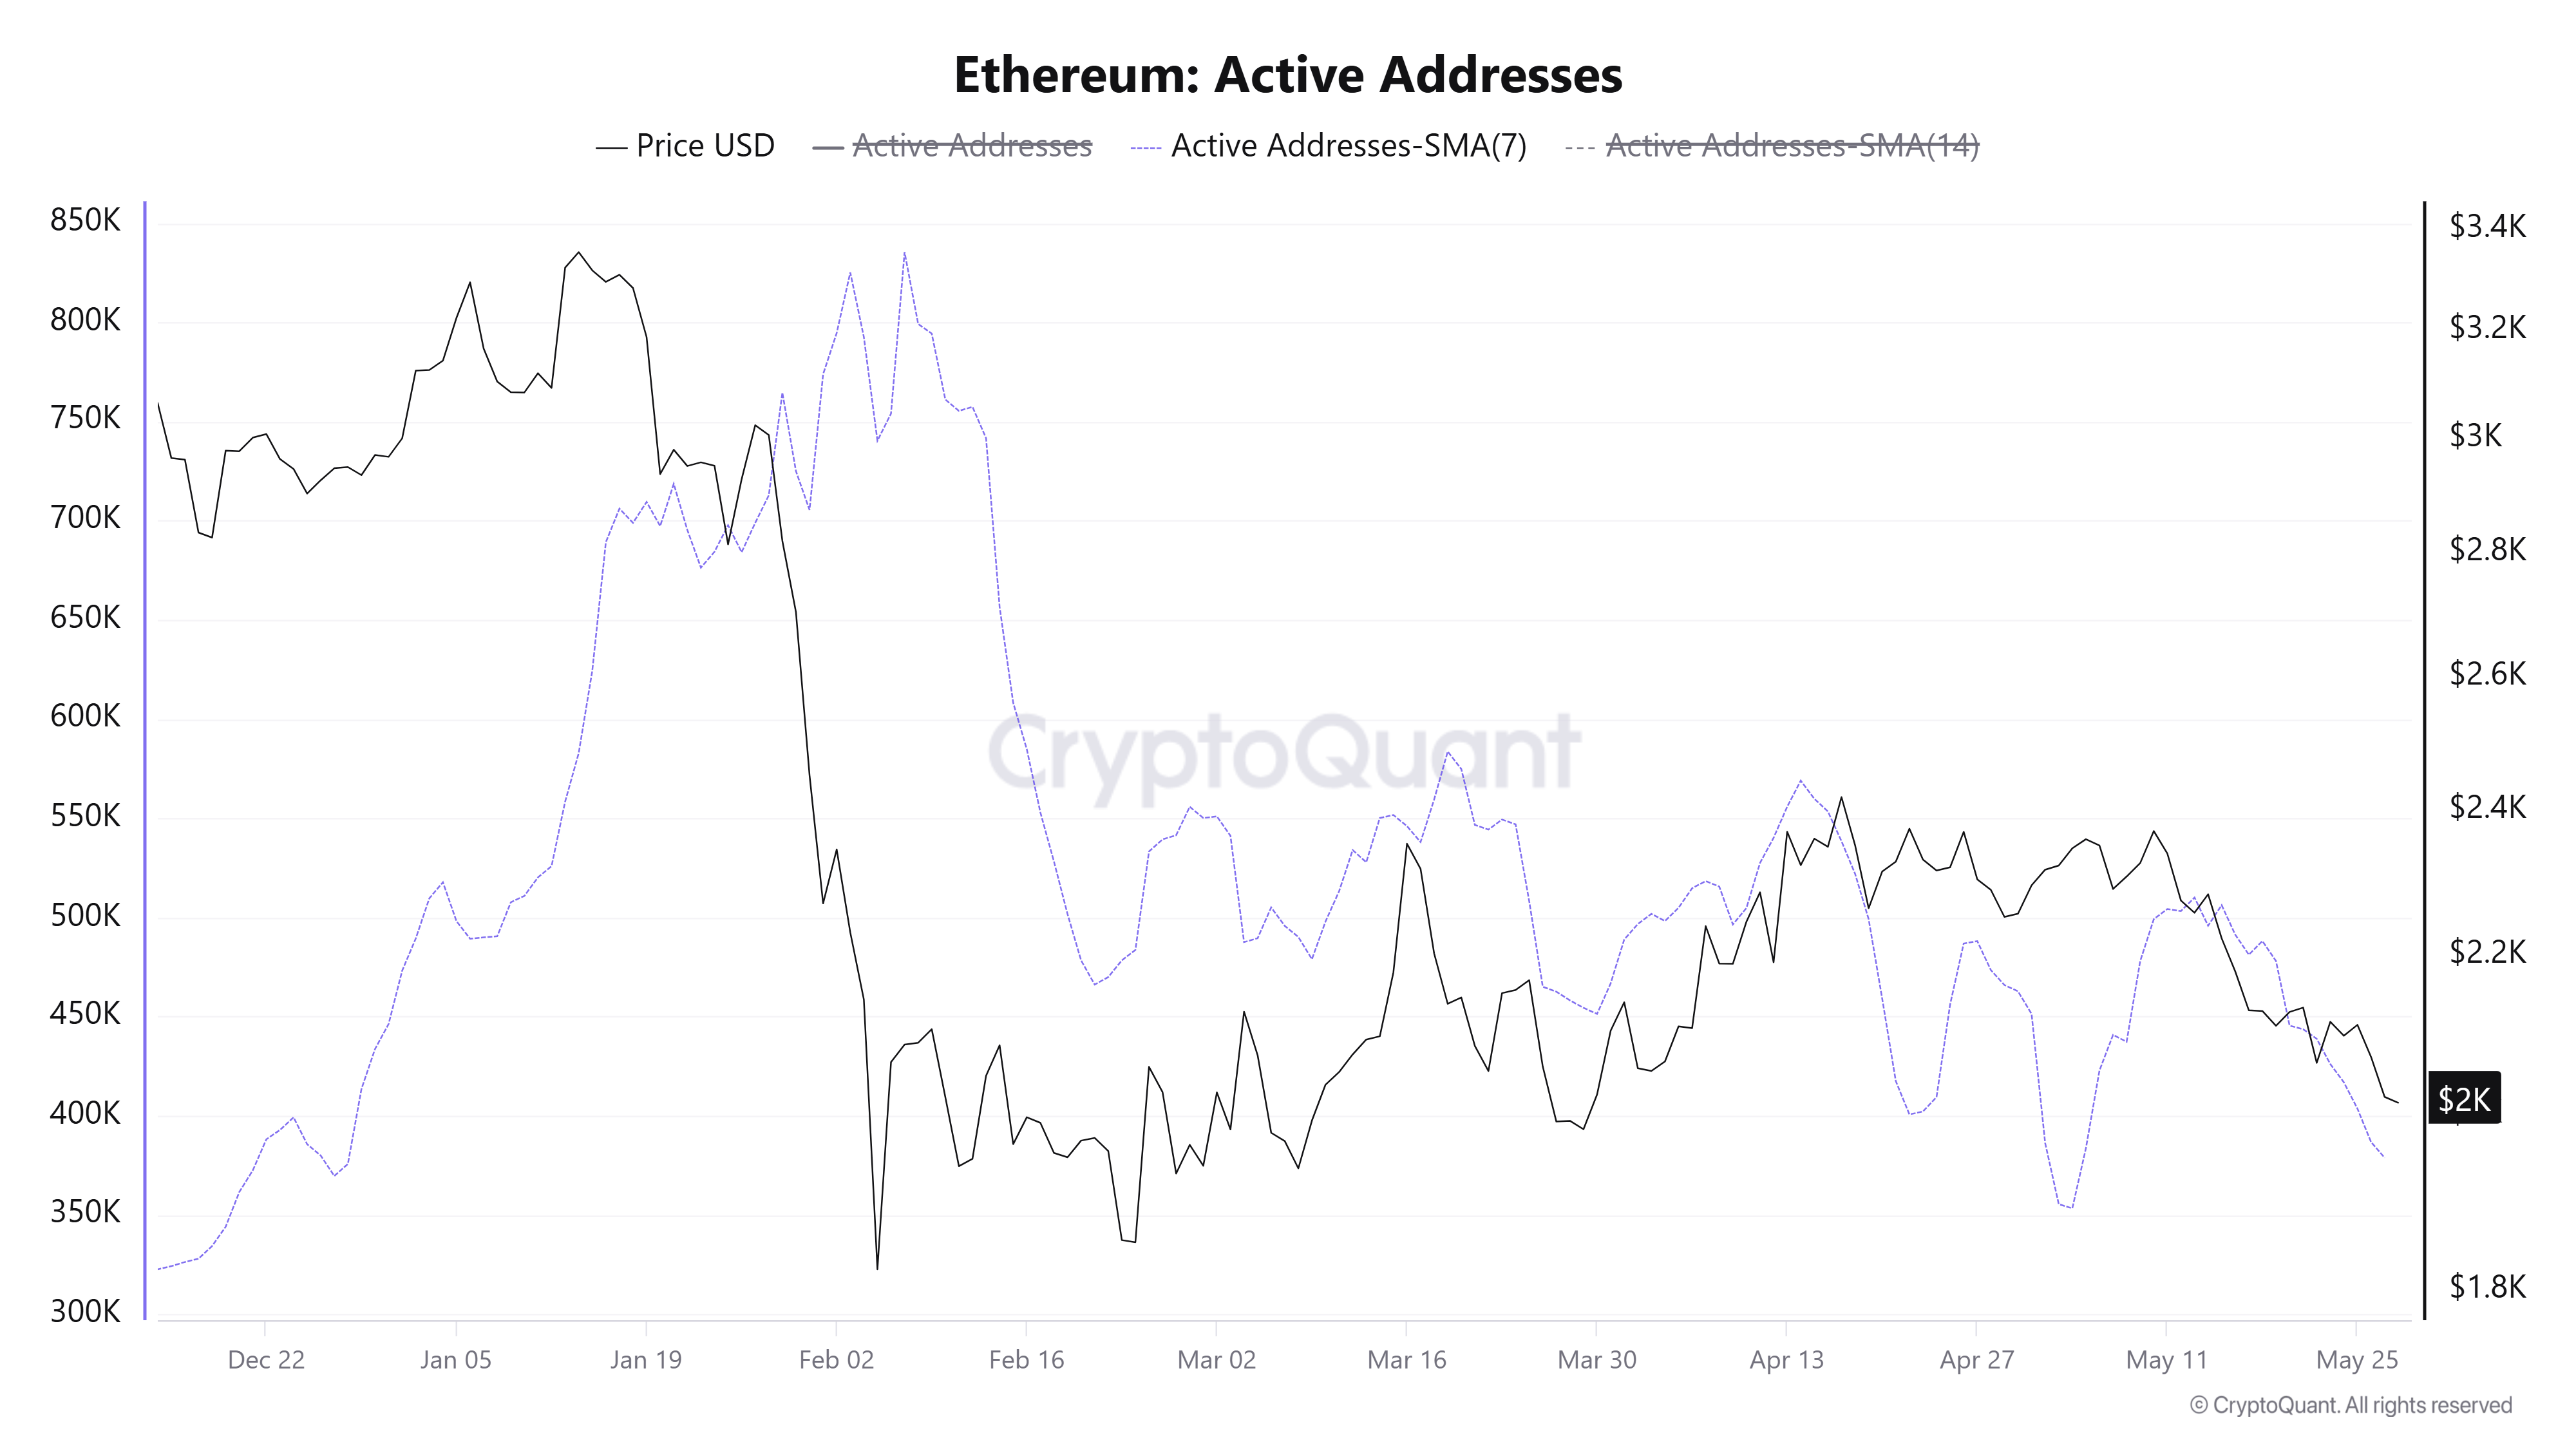
Ethereum (ETH) active addresses metric is declining again after a brief recovery, approaching levels last seen at the beginning of the month. Since mid-February, the seven-day Simple Moving Average (SMA) of Active Addresses on the network has declined by roughly 50%, signaling rapidly declining onchain engagement and weakened sentiment in Ethereum even as prices remain subdued.

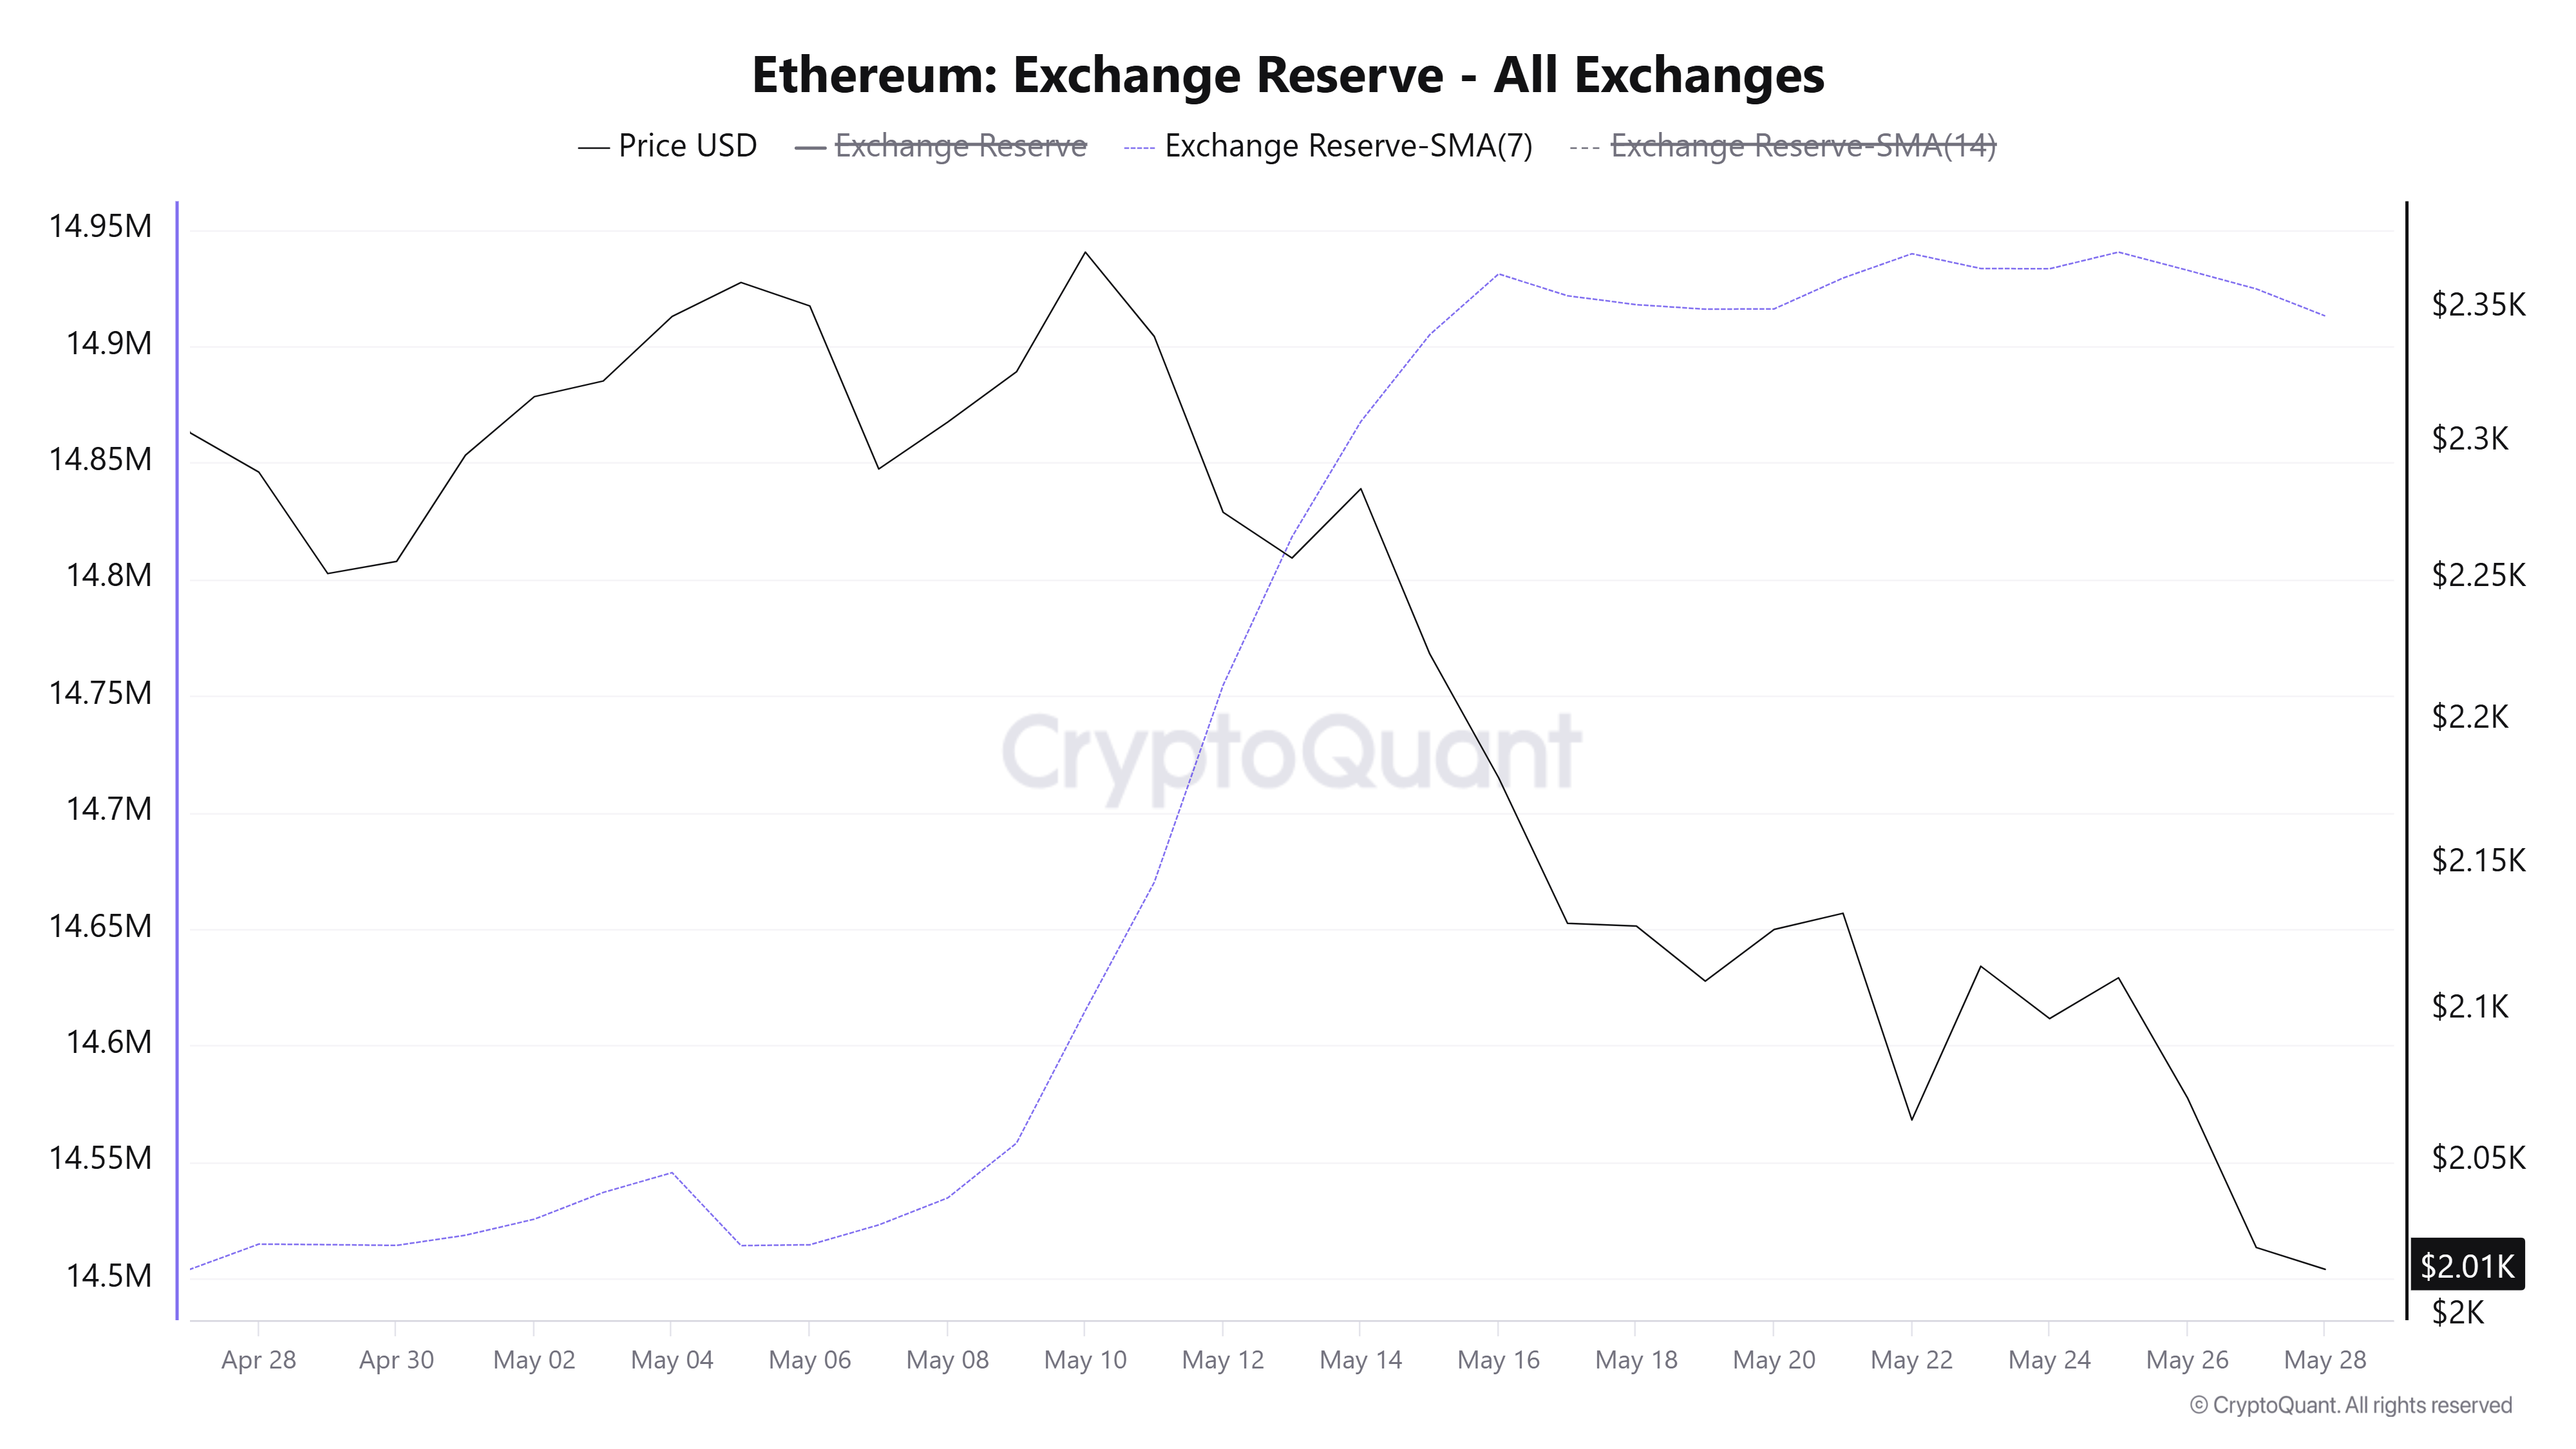
A similar move is evident in Ethereum exchange reserves, which have remained largely flat over the past two weeks after a sharp rise earlier in the month.
The sharp rise coincided with the beginning of ETH's recent decline. A move that aligns with the historic selling pressure that follows strong inflows to exchanges. With the metric now moving horizontally, it signals cooling selling activity but also the absence of buying pressure.
Meanwhile, on the institutional side, US spot ETH exchange-traded funds (ETFs) continue to shed capital. The products have posted 12 consecutive days of net outflows after shedding roughly $67.1 million on Tuesday, marking their longest negative streak since March 2025, per Farside Investors data.
"For ETH to regain strength, a few things need to align. The most direct signal would be spot ETH ETF inflows turning consistently positive over several consecutive days," said Nansen's Research Analyst Nicolai Sondergaard in a note to FXStreet. "That has not happened at a meaningful scale, and until it does, institutional demand for ETH as a standalone allocation remains a question rather than a fact."
On the derivatives side, the Taker Buy Sell Ratio data shows that traders have remained largely bearish, with its seven-day moving average remaining below 1 since May 8. The move comes as ETH's open interest (OI) hit a record high of 16.1 million ETH on Thursday, despite prices falling below $2,000 and funding rates remaining positive.
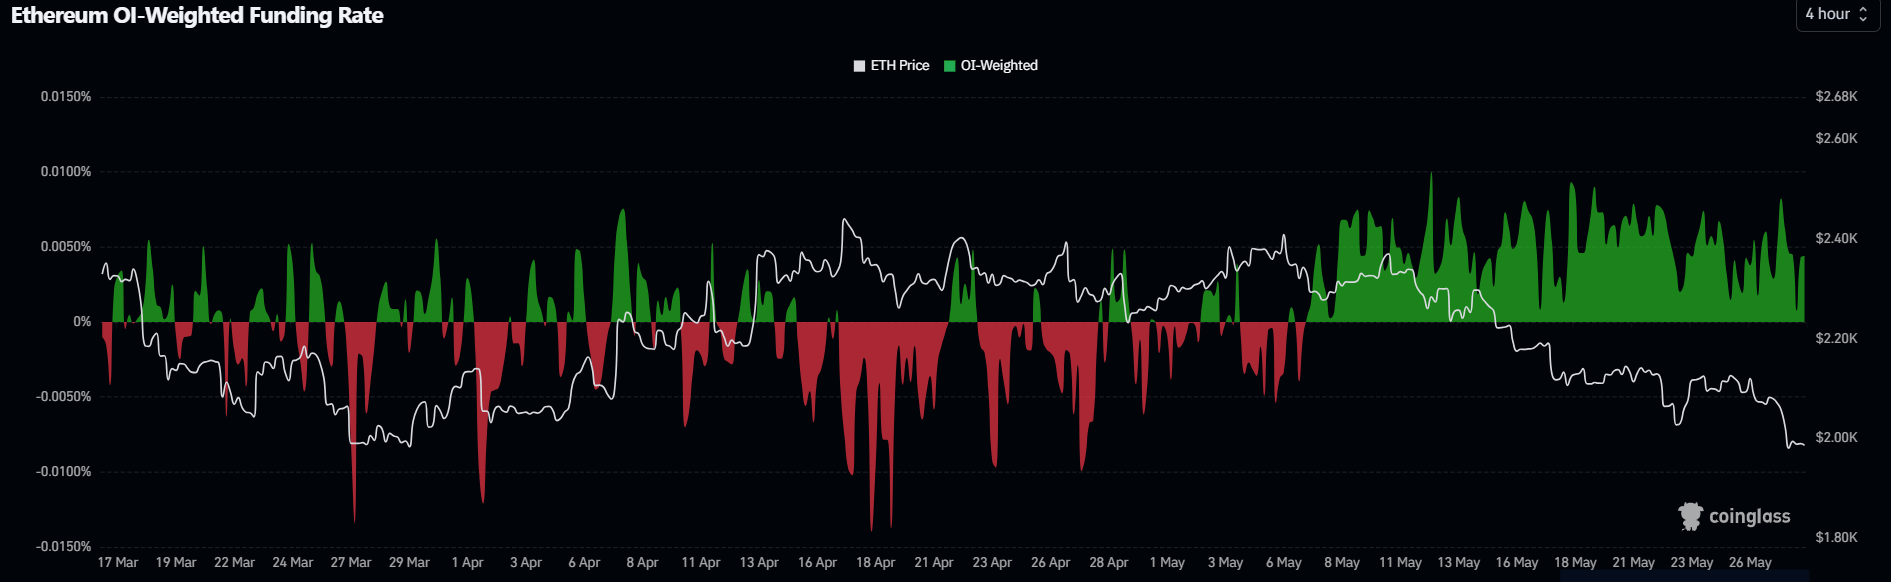
The divergence reflects a potential setup in which shorts are rapidly opening new positions — prompting a rise in OI — while long traders are buying the dip or holding onto underwater positions, keeping funding rates positive.
With the recent decline, ETH has recorded more than $236 million in liquidations over the past 24 hours, led by roughly $225 million in long liquidations, according to Coinglass data.
Ethereum Price Forecast: ETH breaks $2,000, eyes $1,909 support
On the daily chart, ETH continues to extend its bearish bias as price holds beneath the 20-, 50-, and 100-day Exponential Moving Averages (EMAs), clustered above $2,143, $2,200, and $2,292, respectively. This configuration suggests rallies are being sold into.
Meanwhile, a deeply oversold Relative Strength Index (RSI) near 30 and a Stochastic reading below 10 hint at persistent downside pressure rather than an imminent recovery.
On the topside, initial resistance emerges at the horizontal cap around $2,018, followed by $2,107 and the 20-day EMA near $ 2,143, with the 50-day EMA at $2,200 and the $2,211 barrier reinforcing a broader supply zone. Above that, the 100-day EMA at $2,291 and the $2,388 level guard any stronger rebound.
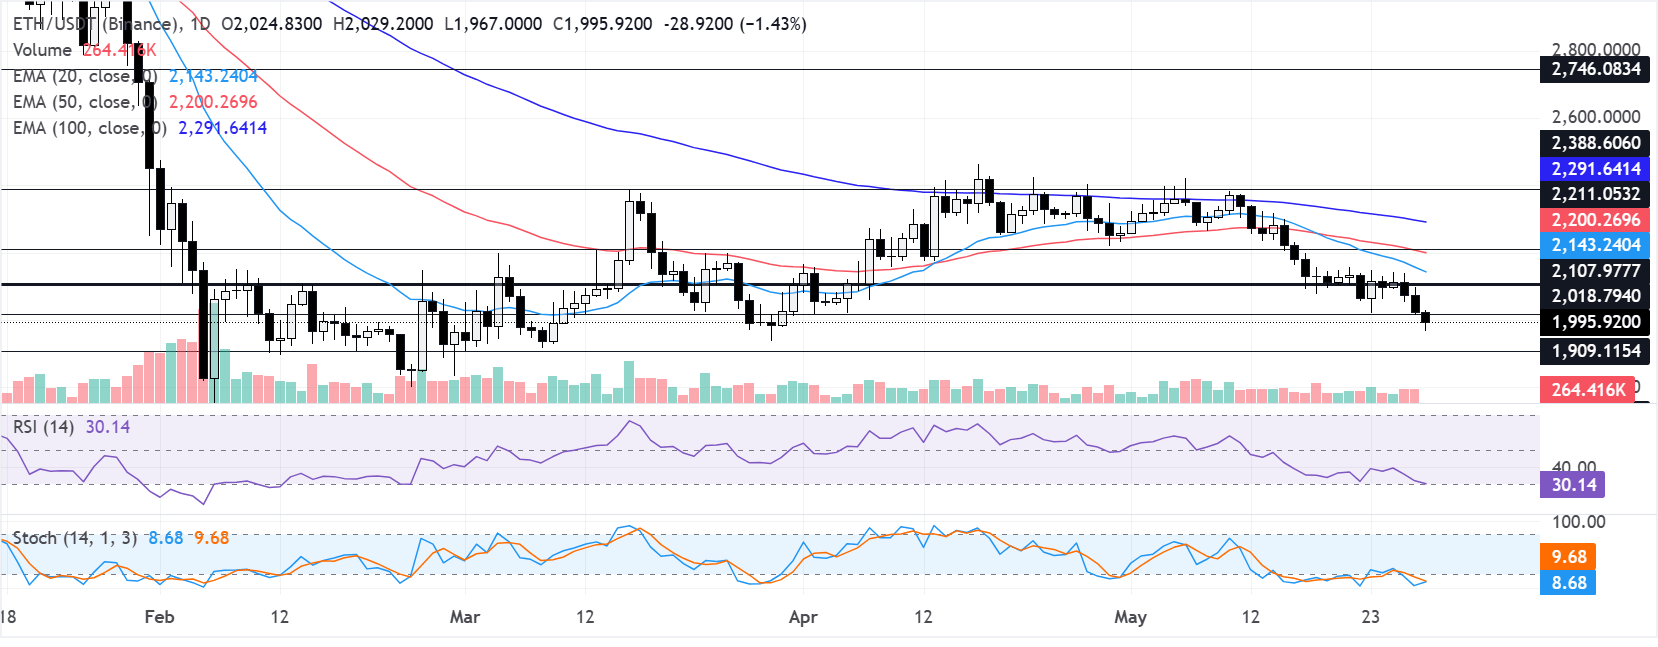
On the downside, immediate support is seen at $1,909, with subsequent floors at $1,741 and $1,524, while a break of $1,404 would expose a deeper corrective leg.
(The technical analysis of this story was written with the help of an AI tool.)














