

GBP/JPY Price Forecast: Bullish amid respected higher-high structure
- GBP/JPY firmly maintains higher-high structure near 18-year highs.
- RSI nears overbought territory, signaling buyers retain upside momentum.
- Break above 218.00 exposes 220.00 and 222.76 resistance.
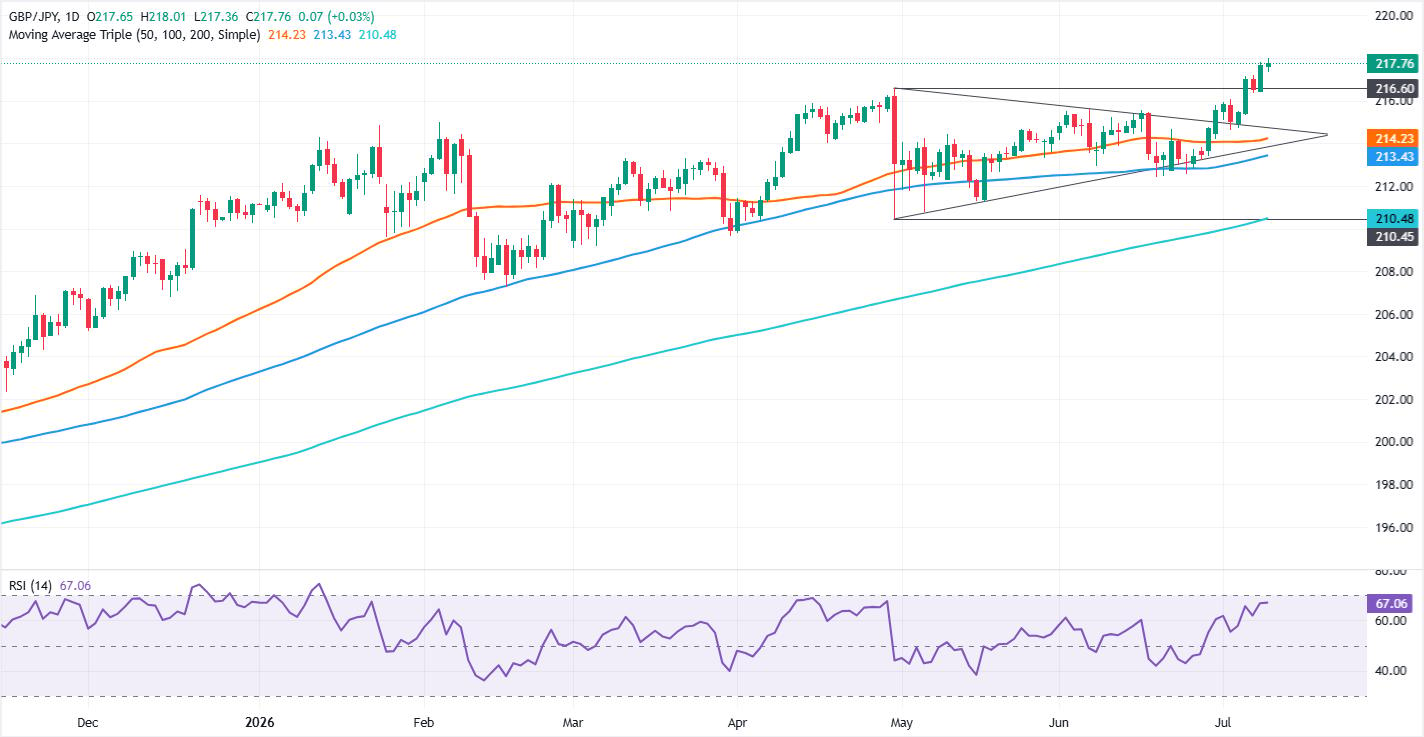
The British Pound advances some 0.50% against the Japanese Yen on Thursday, as risk appetite improves after US President Donald Trump said that Iran had reached out and that it wants to make a deal badly. At the time of writing, GBP/JPY trades at 217.76, near year-to-date (YTD) highs.
GBP/JPY Price Forecast: Technical outlook
The GBP/JPY has reached 18-year highs, last seen in February 2008, opening the door to challenging the January 2008 monthly peak levels.

Price action shows the market is respecting a series of higher highs and higher lows, an indication of further upside. Momentum favours buyers, as the Relative Strength Index (RSI) is bullish and about to enter overbought territory, indicating further upside.
The first resistance for GBP/JPY is 218.00. Once cleared, it opens the door to challenge key psychological levels like 219.00, 220.00 and the January 2008 high at 222.76.
Conversely, a potential intervention by Japanese authorities in the foreign exchange markets could open the door for a deeper pullback, with the first support level seen at the July 7 daily low of 216.38. Below this area, the next support is the 216.00 mark. On further weakness, the next area of interest would be a downslope resistance trendline that turns into support around the 214.70-215.00 area.
GBP/JPY Price Chart — Daily
Japanese Yen Price This week
The table below shows the percentage change of Japanese Yen (JPY) against listed major currencies this week. Japanese Yen was the strongest against the Swiss Franc.
| USD | EUR | GBP | JPY | CAD | AUD | NZD | CHF | |
|---|---|---|---|---|---|---|---|---|
| USD | 0.06% | -0.46% | 0.65% | -0.17% | -0.08% | -0.82% | 0.44% | |
| EUR | -0.06% | -0.54% | 0.58% | -0.24% | -0.10% | -0.91% | 0.34% | |
| GBP | 0.46% | 0.54% | 1.02% | 0.29% | 0.42% | -0.36% | 0.88% | |
| JPY | -0.65% | -0.58% | -1.02% | -0.84% | -0.61% | -1.45% | -0.24% | |
| CAD | 0.17% | 0.24% | -0.29% | 0.84% | 0.21% | -0.61% | 0.58% | |
| AUD | 0.08% | 0.10% | -0.42% | 0.61% | -0.21% | -0.81% | 0.43% | |
| NZD | 0.82% | 0.91% | 0.36% | 1.45% | 0.61% | 0.81% | 1.25% | |
| CHF | -0.44% | -0.34% | -0.88% | 0.24% | -0.58% | -0.43% | -1.25% |
The heat map shows percentage changes of major currencies against each other. The base currency is picked from the left column, while the quote currency is picked from the top row. For example, if you pick the Japanese Yen from the left column and move along the horizontal line to the US Dollar, the percentage change displayed in the box will represent JPY (base)/USD (quote).














