

Silver Price Forecast: XAG/USD remains stuck in a bearish channel
- Silver rebounds as a softer US Dollar and lower Treasury yields offer support.
- Hawkish Fed expectations keep Silver's upside limited.
- Technically, XAG/USD remains trapped within a downward parallel channel below key moving averages.
Silver (XAG/USD) snaps a three-day losing streak on Thursday as a mildly weaker US Dollar (USD) and a pullback in US Treasury yields lend support to the precious metal. At the time of writing, XAG/USD trades around $60.30, up 3.38% on the day.
Despite the intraday rebound, XAG/USD maintains a bearish structure, with a series of lower highs and lower lows since mid-May. The metal also trades below its key moving averages and is about 50% below its record high near $121 set in January.

The metal is struggling to stage a sustained recovery as macroeconomic headwinds cap the upside. Renewed hostilities in the Middle East have revived concerns over energy-driven inflation, reinforcing expectations that the Federal Reserve (Fed) may need to raise interest rates.
Higher borrowing costs tend to weigh on non-yielding metals because they become less attractive relative to interest-bearing investments.
Hawkish Fed expectations and heightened geopolitical tensions are expected to keep downside pressure on the US Dollar limited. The US Dollar Index (DXY), which tracks the Greenback against a basket of six major currencies, trades around 100.94 after touching an intraday low of 100.79.
Technical Analysis
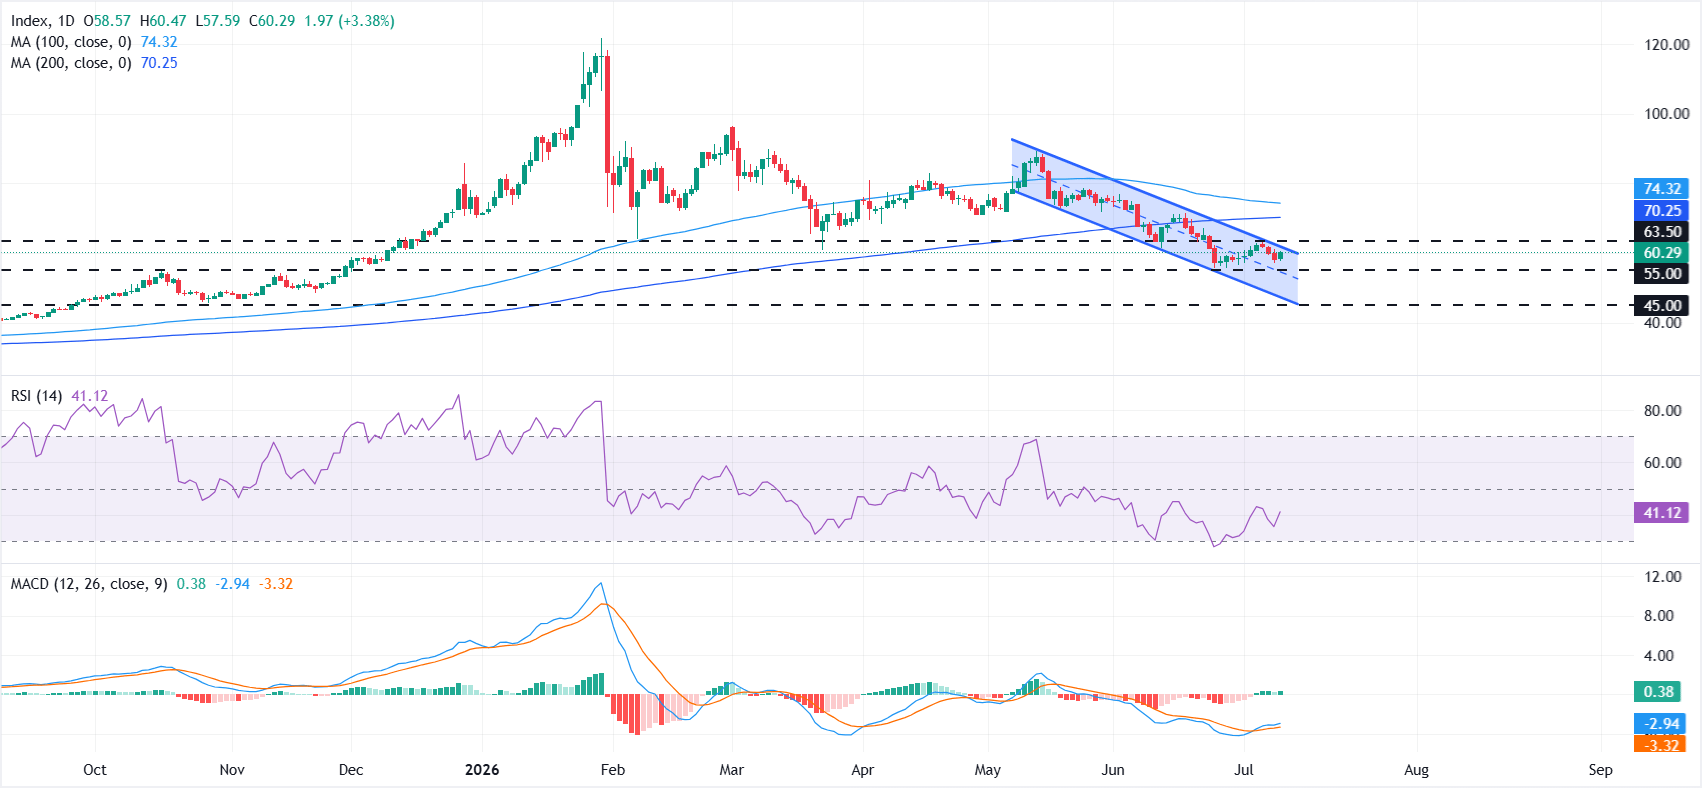
On the daily chart, XAG/USD keeps a bearish near-term bias as price holds within a downward parallel channel and below both the 200-day Simple Moving Average (SMA) at $70.25 and the 100-day SMA at $74.32.
The pair trades just under the channel top at $63.50, suggesting upside attempts remain capped for now, while the Relative Strength Index (RSI) around 41 points to subdued momentum even as the Moving Average Convergence Divergence (MACD) turns positive, hinting at only a modest recovery attempt within a broader corrective structure.
On the topside, initial resistance is located at the channel upper boundary near $63.50. A sustained break above this would be needed to challenge the 200-day SMA at $70.25 and the 100-day SMA at $74.32.
On the downside, first support emerges at the horizontal line around $55, with the channel floor near $45 expected to act as a stronger demand area if bearish pressure resumes.
(The technical analysis of this story was written with the help of an AI tool. Know more.)
Inflation FAQs
Inflation measures the rise in the price of a representative basket of goods and services. Headline inflation is usually expressed as a percentage change on a month-on-month (MoM) and year-on-year (YoY) basis. Core inflation excludes more volatile elements such as food and fuel which can fluctuate because of geopolitical and seasonal factors. Core inflation is the figure economists focus on and is the level targeted by central banks, which are mandated to keep inflation at a manageable level, usually around 2%.
The Consumer Price Index (CPI) measures the change in prices of a basket of goods and services over a period of time. It is usually expressed as a percentage change on a month-on-month (MoM) and year-on-year (YoY) basis. Core CPI is the figure targeted by central banks as it excludes volatile food and fuel inputs. When Core CPI rises above 2% it usually results in higher interest rates and vice versa when it falls below 2%. Since higher interest rates are positive for a currency, higher inflation usually results in a stronger currency. The opposite is true when inflation falls.
Although it may seem counter-intuitive, high inflation in a country pushes up the value of its currency and vice versa for lower inflation. This is because the central bank will normally raise interest rates to combat the higher inflation, which attract more global capital inflows from investors looking for a lucrative place to park their money.
Formerly, Gold was the asset investors turned to in times of high inflation because it preserved its value, and whilst investors will often still buy Gold for its safe-haven properties in times of extreme market turmoil, this is not the case most of the time. This is because when inflation is high, central banks will put up interest rates to combat it. Higher interest rates are negative for Gold because they increase the opportunity-cost of holding Gold vis-a-vis an interest-bearing asset or placing the money in a cash deposit account. On the flipside, lower inflation tends to be positive for Gold as it brings interest rates down, making the bright metal a more viable investment alternative.














