
USD/CHF Price Forecast: Eyes 0.80 as inverse head-and-shoulders breakout holds
作者 Christian Borjon Valencia
更新: 9 Jun 2026


熱門文章

The USD/CHF advances some 0.11% trades near nine-week highs of 0.7991 as risk aversion boosted the Greenback, which has trimmed some earlier losses, to challenge the 0.8000 figure.
- USD/CHF holds bullish bias after inverse head-and-shoulders neckline break.
- RSI flattens near 65, signaling buyers retain upside momentum.
- Break above 0.8000 exposes 0.8050 and 0.8100 resistance.
The USD/CHF advances some 0.11% trades near nine-week highs of 0.7991 as risk aversion boosted the Greenback, which has trimmed some earlier losses, to challenge the 0.8000 figure.
USD/CHF Price Forecast: Technical outlook
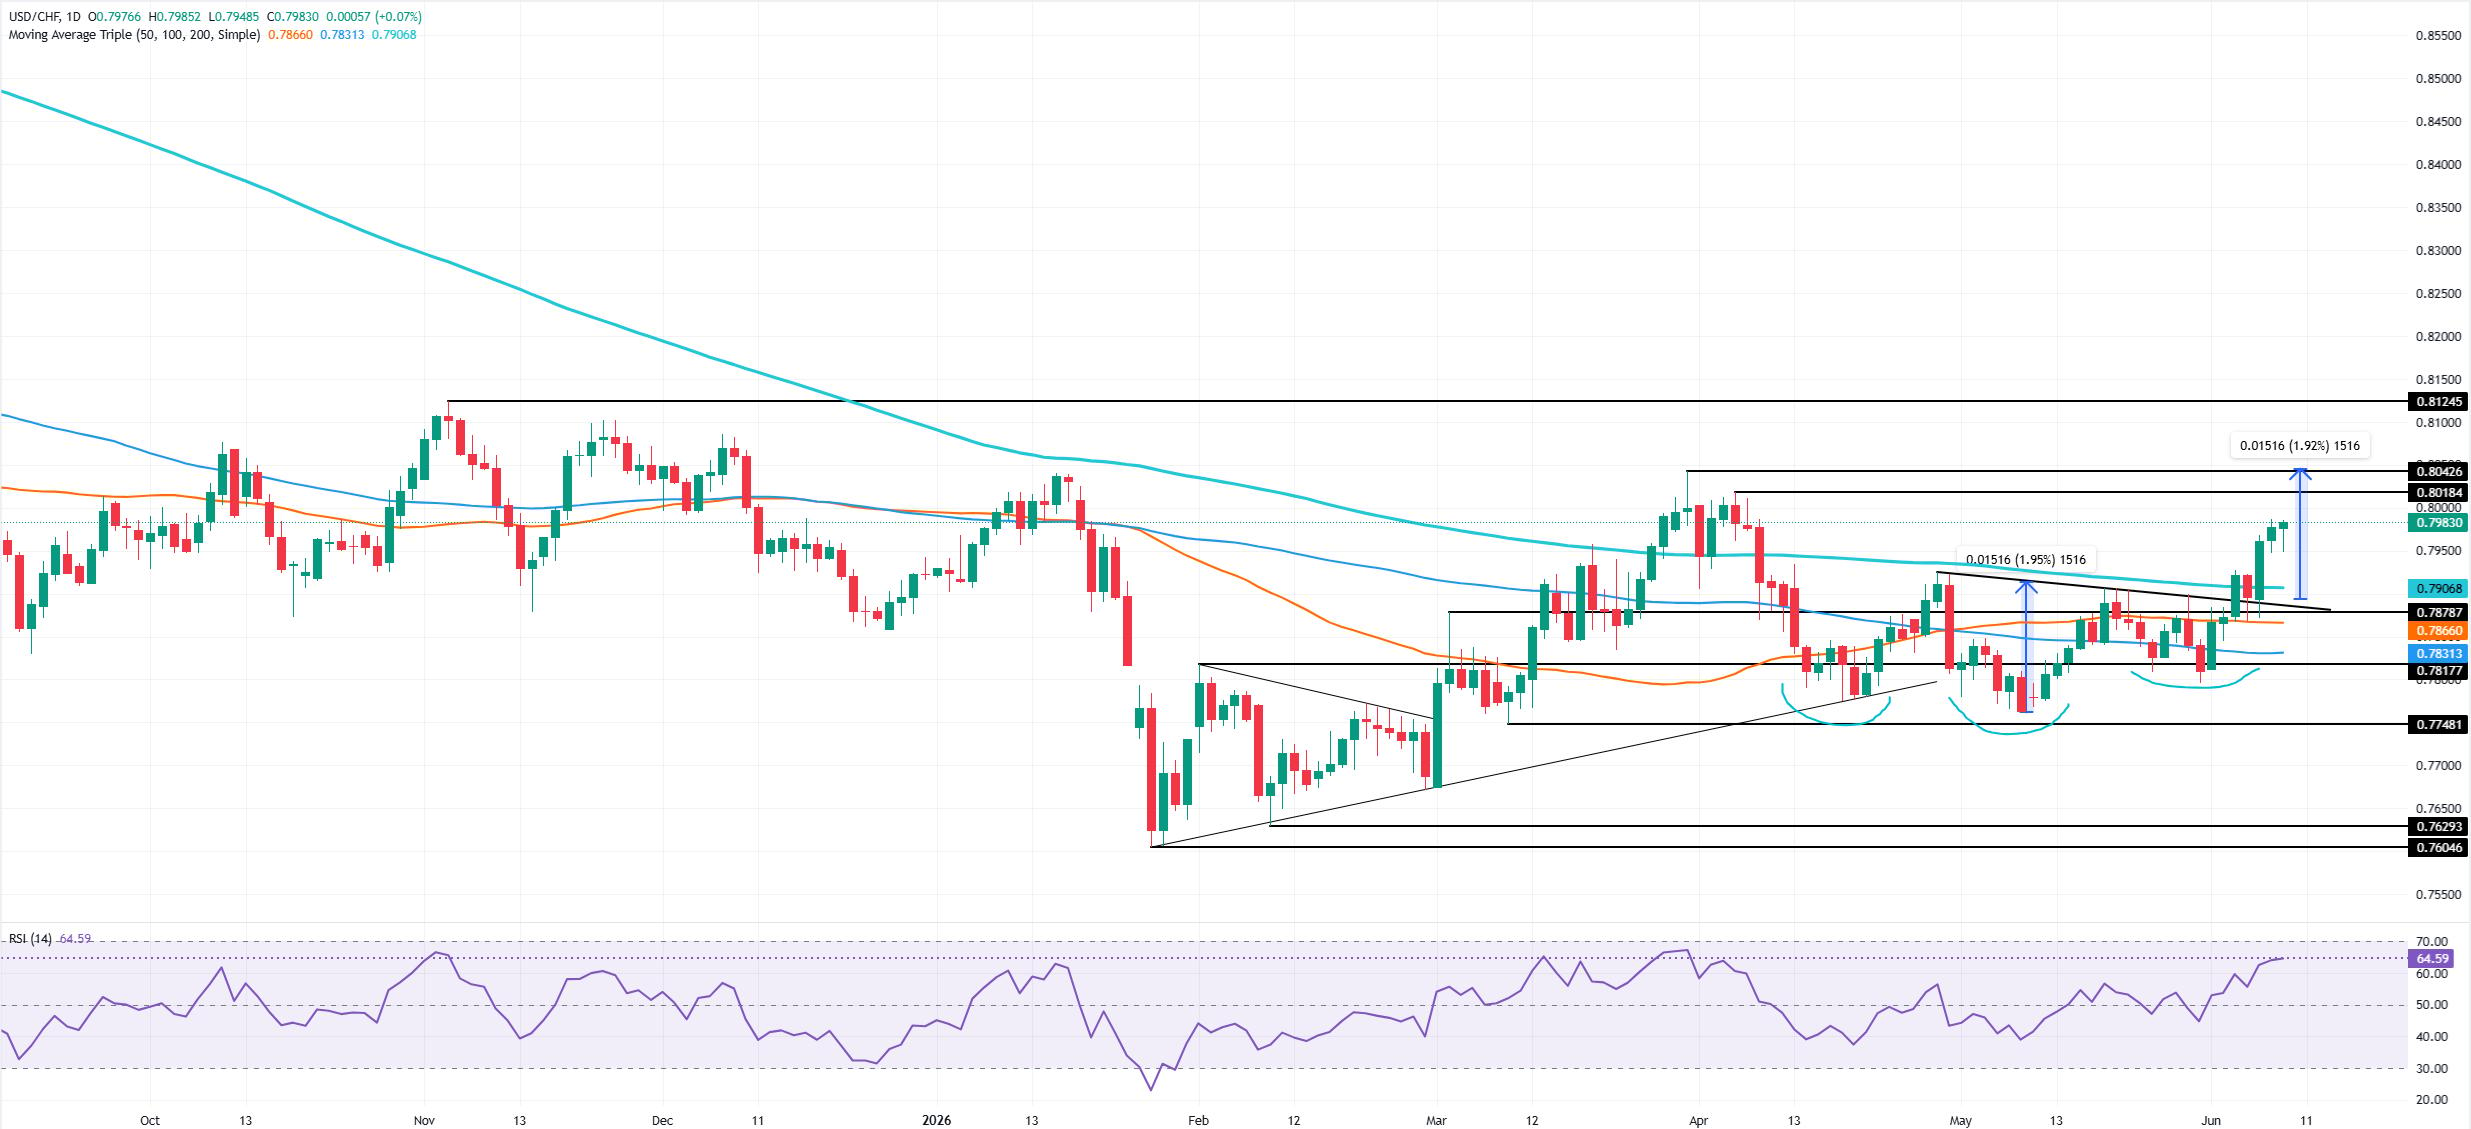
Price action shows the USD/CHF is bullish-biased after an ‘inverse head-and-shoulders’ was confirmed by a break of the neckline, which opened the door for further gains.
Momentum is also bullish, as shown by the Relative Strength Index (RSI), which turned flattish near the 65 level, suggesting that buyers are gathering momentum.
If USD/CHF climbs above 0.8000, the next stop would be the ‘inverse head-and-shoulders’ measured objective near the 0.8040-0.8050 area. A breach of the latter will expose the 0.8100 mark ahead of testing the November 5, 2025 swing high at 0.8124. Once those levels are hurdled, 0.8200 is up next.
Downwards, the first support is the June 5 daily high at 0.7968. Below this level lies 0.7950 ahead of the 200-day Simple Moving Average (SMA) at 0.7907.
USD/CHF Price Chart – Daily
Swiss Franc Price Today
The table below shows the percentage change of Swiss Franc (CHF) against listed major currencies today. Swiss Franc was the strongest against the Australian Dollar.
| USD | EUR | GBP | JPY | CAD | AUD | NZD | CHF | |
|---|---|---|---|---|---|---|---|---|
| USD | -0.09% | -0.31% | 0.13% | -0.05% | 0.21% | -0.12% | 0.05% | |
| EUR | 0.09% | -0.20% | 0.22% | 0.03% | 0.35% | 0.00% | 0.17% | |
| GBP | 0.31% | 0.20% | 0.43% | 0.25% | 0.52% | 0.21% | 0.37% | |
| JPY | -0.13% | -0.22% | -0.43% | -0.17% | 0.09% | -0.22% | -0.06% | |
| CAD | 0.05% | -0.03% | -0.25% | 0.17% | 0.27% | -0.04% | 0.12% | |
| AUD | -0.21% | -0.35% | -0.52% | -0.09% | -0.27% | -0.31% | -0.16% | |
| NZD | 0.12% | -0.01% | -0.21% | 0.22% | 0.04% | 0.31% | 0.15% | |
| CHF | -0.05% | -0.17% | -0.37% | 0.06% | -0.12% | 0.16% | -0.15% |
The heat map shows percentage changes of major currencies against each other. The base currency is picked from the left column, while the quote currency is picked from the top row. For example, if you pick the Swiss Franc from the left column and move along the horizontal line to the US Dollar, the percentage change displayed in the box will represent CHF (base)/USD (quote).

超過一百萬用戶依賴 FXStreet 獲取即時市場數據、圖表工具、專家洞見與外匯新聞。其全面的經濟日曆與教育網路研討會協助交易者保持資訊領先、做出審慎決策。FXStreet 擁有約 60 人的團隊,分布於巴塞隆納總部及全球各地。
閱讀更多


