


Was sind aufsteigende und absteigende Dreiecks-Chartmuster?
Aufsteigende und absteigende Dreiecke sind Chartmuster , die in der technischen Analyse verwendet werden und eine Kurskompression innerhalb einer sich verengenden Spanne zeigen. Trader klassifizieren beide Muster als Trendfortsetzungsmuster, da sie häufig auftreten, bevor sich der vorherige Trend fortsetzt.
Was ist ein aufsteigendes Dreieck?
Ein aufsteigendes Dreieck ist ein bullisches Trendfortsetzungs-Chartmuster, das durch einen flachen Widerstand und steigende Tiefs definiert ist.
Was ist ein absteigendes Dreieck?
Ein absteigendes Dreieck ist ein bärisches Trendfortsetzungs-Chartmuster, das durch eine flache Unterstützung und fallende Hochs definiert ist.
Beide Muster gehören zur Dreiecks-Familie, sind jedoch keine symmetrischen Dreiecke. Ein symmetrisches Dreieck hat zwei geneigte Begrenzungen, während aufsteigende und absteigende Dreiecke eine Begrenzung horizontal halten.
Aufsteigendes vs. absteigendes Dreieck: die wichtigsten Unterschiede
Wesentliche Bestandteile: Wie funktionieren aufsteigende und absteigende Dreiecksmuster?
Aufsteigende und absteigende Dreiecke haben ein zentrales Merkmal gemeinsam. Die Kursschwankungen verengen sich, während sich das Muster entwickelt.
Sie teilen außerdem einen ähnlichen Price-Action-Mechanismus hinter den Chartmustern.
Aufsteigendes Dreieck
Ein aufsteigendes Dreieck bildet sich unter einer flachen Widerstandslinie. Käufer heben jedes Rücksetzer-Tief weiter an, sodass die Tiefs steigen.
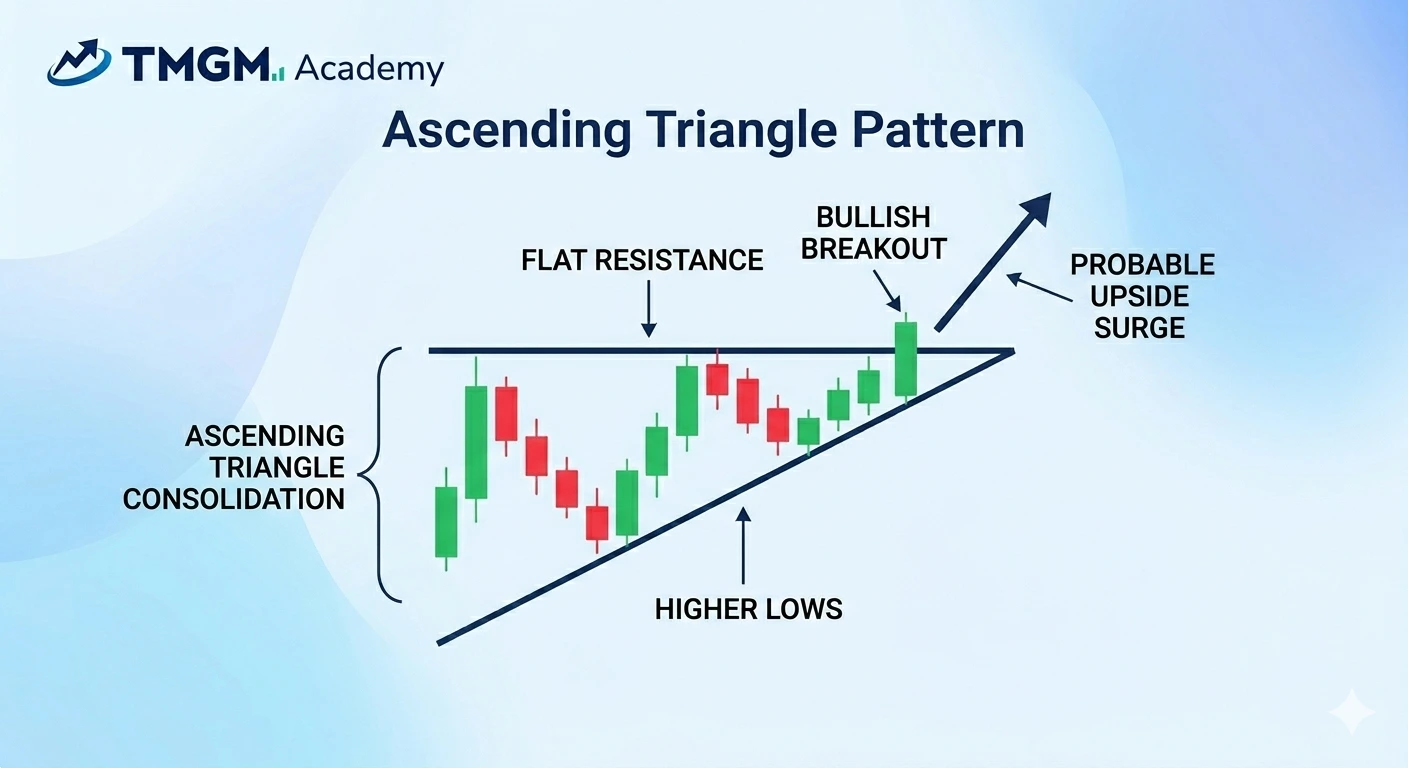
Die steigenden Tiefs bilden eine aufwärts geneigte Unterstützungslinie. Die flache Oberseite und die steigende Unterseite drücken den Kurs in eine engere Spanne.
Ein aufsteigendes Dreieck sieht in der Regel aus wie eine Reihe höherer Tiefs, die gegen dieselbe Obergrenze drücken.
Absteigendes Dreieck
Ein absteigendes Dreieck bildet sich über einer flachen Unterstützungslinie. Verkäufer drücken jede Erholung weiter nach unten, sodass die Hochs im Laufe der Zeit fallen.
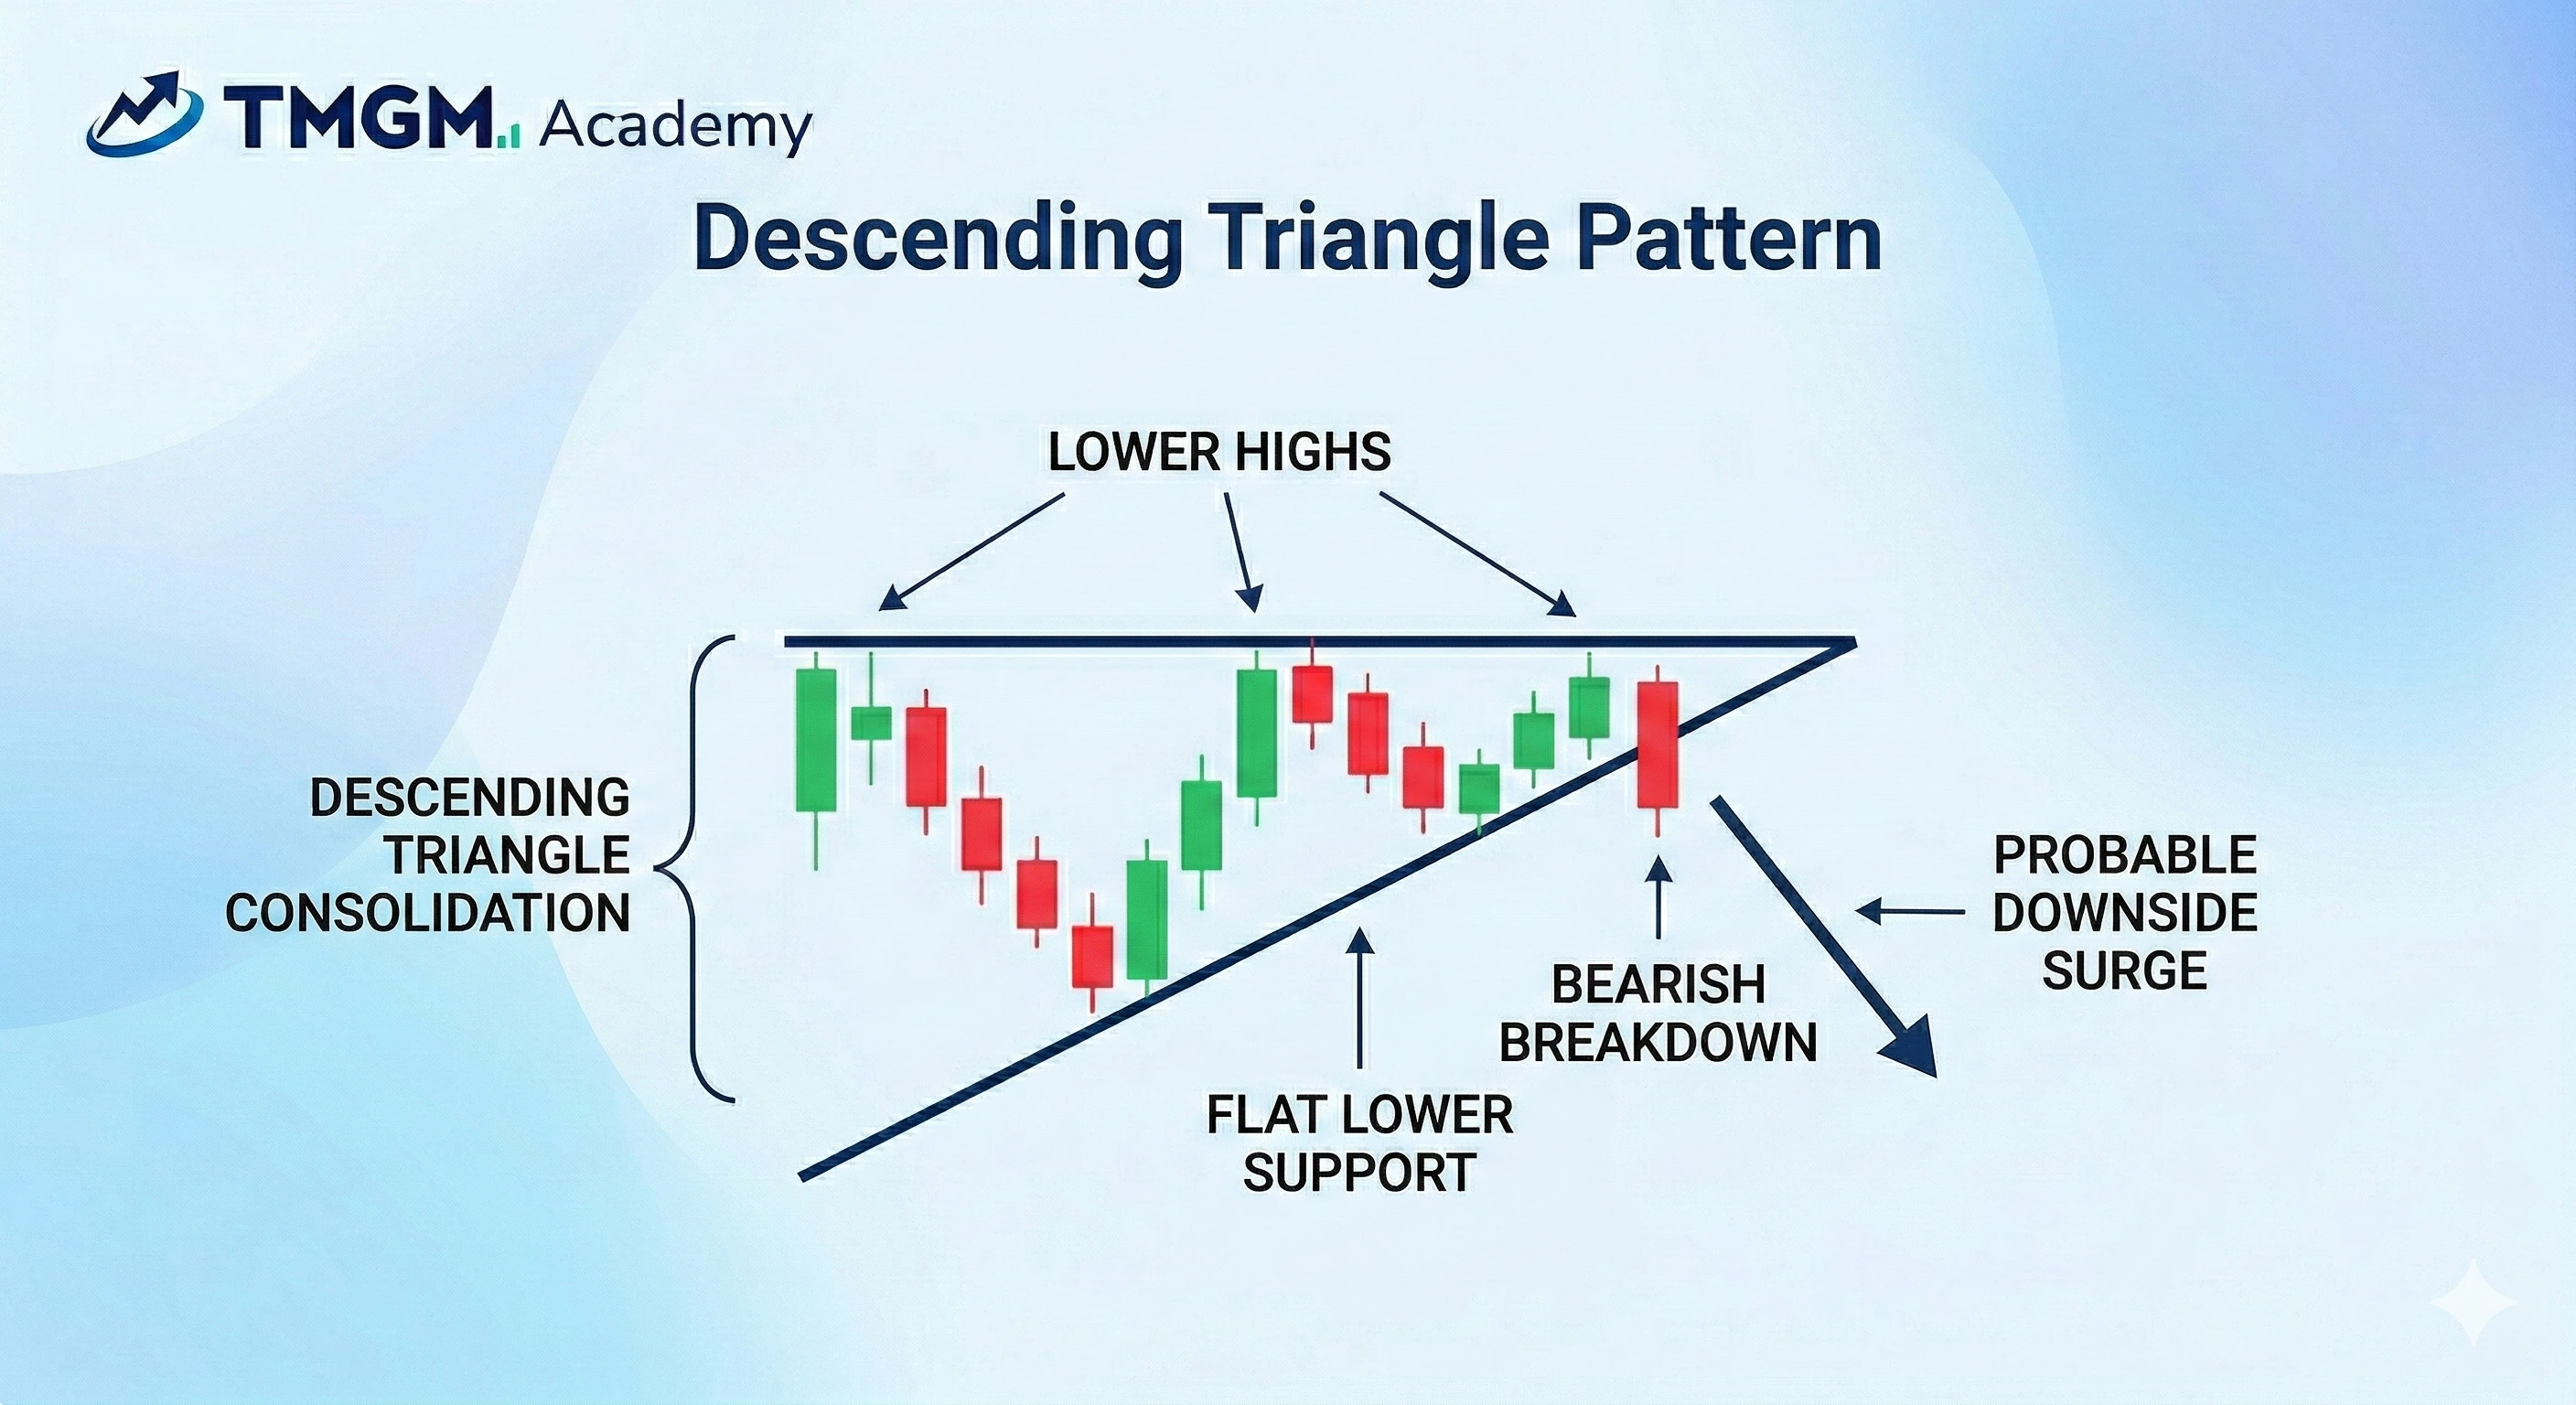
Die fallenden Hochs bilden eine abwärts geneigte Widerstandslinie. Die flache Unterseite und die fallende Oberseite komprimieren den Kurs in eine sich verengende Spanne.
Ein absteigendes Dreieck sieht in der Regel aus wie eine Reihe tieferer Hochs, die auf derselben Untergrenze aufliegen.
Volumen
Das Volumen nimmt während der Bildung eines Dreiecksmusters häufig ab. Die geringere Aktivität spiegelt Konsolidierung und eine geringere Marktteilnahme innerhalb der sich verengenden Spanne wider.
Das Volumen kann zunehmen, wenn der Kurs aus dem Muster ausbricht. Eine höhere Aktivität garantiert keinen Erfolg, kann aber auf eine stärkere Marktteilnahme hinweisen.
Warum verwenden Trader aufsteigende und absteigende Dreiecksmuster?
Aufsteigende und absteigende Dreiecksmuster sind wichtig, weil sie Tradern helfen, Druck, Richtung und Entscheidungspunkte zu erkennen, bevor der Ausbruch erfolgt. Anstatt erst zu reagieren, wenn die Bewegung bereits läuft, können Trader das Muster nutzen, um sich im Voraus auf eine wahrscheinliche Trendfortsetzung vorzubereiten.
Diese Muster sind nützlich, weil sie eine klare Struktur schaffen. Ein aufsteigendes Dreieck zeigt Käufer, die gegen den Widerstand drücken, während ein absteigendes Dreieck Verkäufer zeigt, die gegen die Unterstützung drücken. Dadurch lässt sich leichter erkennen, welche Seite die Kontrolle gewinnt.
Sie sind auch praktische Trading-Setups, weil sie klar definierte Niveaus liefern. Die horizontale Begrenzung gibt einen Ausbruchspunkt vor, die gegenüberliegende Seite der Struktur hilft dabei, die Invalidierung einzugrenzen, und die Höhe des Musters kann bei der Zielplanung helfen.
Ein weiterer Vorteil ist, dass Dreiecksmuster die Trading-Disziplin verbessern können. Trader können auf Struktur, Bestätigung und Ausbruchsvolumen warten, anstatt aus Emotionen oder aufgrund zufälliger Kursbewegungen einzusteigen.
Diese Muster sind außerdem markt- und zeitrahmenübergreifend flexibel einsetzbar. Sie treten in Forex, Gold, Öl, Aktien und Krypto auf, was sie sowohl für Daytrader als auch für Swing-Trader nützlich macht, die sich bei ihren Entscheidungen auf Charts stützen.
Am wichtigsten ist, dass aufsteigende und absteigende Dreiecke Tradern helfen, das Lesen von Charts in einen strukturierten Plan zu überführen. Sie sagen nicht jede Bewegung voraus, helfen aber dabei zu definieren, wo die Trading-Idee sinnvoll ist, wo sie scheitert und wohin sich der Kurs als Nächstes bewegen könnte.
Wie erkennt man ein aufsteigendes oder absteigendes Dreieck mit hoher Wahrscheinlichkeit?
Wir verwenden Bestätigungssignale. Ein aufsteigendes oder absteigendes Dreieck mit hoher Wahrscheinlichkeit weist eine klare Struktur auf, stimmt mit dem breiteren Marktkontext überein und lässt dem Kurs nach dem Ausbruch genügend Spielraum für eine Bewegung. Das Muster selbst ist nur ein Teil des Setups.
Trader müssen außerdem beurteilen, ob die Marktstruktur einen vorteilhaften Trade unterstützt.
Wie handelt man aufsteigende und absteigende Dreiecks-Chartmuster?
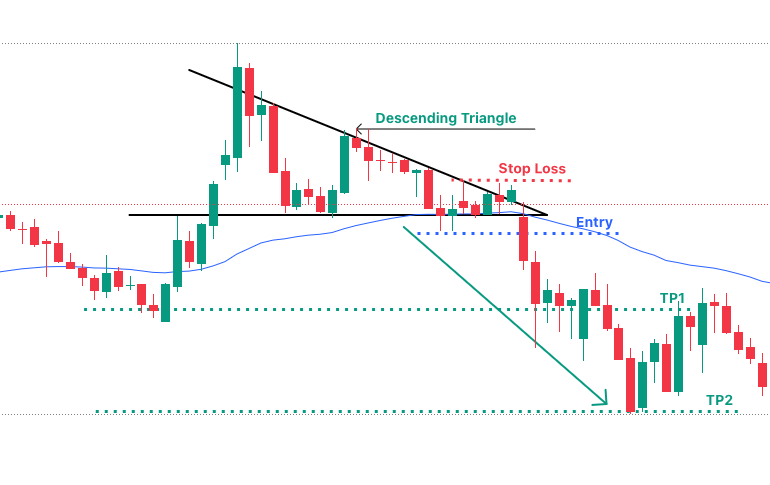
Dieser EUR/USD-Tageschart zeigt, wie ein absteigendes Dreieck als bärisches Trendfortsetzungs-Setup gehandelt werden kann.
Das Muster begann etwa am 27. Jan. 2026, entwickelte sich über eine Reihe fallender Hochs, die gegen eine flache Unterstützung drückten, und brach etwa am 13. März 2026 nach unten aus. In diesem Beispiel nutzte der Trading-Plan einen Breakout-Einstieg unter dem jüngsten Swing-Tief, einen Stop-Loss oberhalb des letzten Docht-Widerstands, TP1 an der vorherigen wichtigen Unterstützung und TP2 als 2R-Erweiterung, nachdem keine tiefere wichtige Unterstützung verfügbar war.
Das Muster identifizieren
Das Muster ist ein absteigendes Dreieck, weil der Kurs eine klare horizontale Unterstützung bildet, während die Hochs weiter stufenweise fallen. Die obere schwarze Trendlinie zeigt, dass die Verkäufer im Laufe der Zeit aggressiver werden, während die flache untere Begrenzung zeigt, dass Käufer denselben Unterstützungsbereich wiederholt verteidigen.
Dieses Beispiel ist sauber, weil die Struktur leicht zu lesen ist. Die Unterstützungszone wird mehrmals getestet, die Erholungen werden immer schwächer, und der Kurs komprimiert sich vor dem Ausbruch in den Apex. Genau dieses Verhalten wollen Trader bei einem gültigen absteigenden Dreieck sehen.
Das Setup bestätigen
Die erste Bestätigung war, dass die Struktur sehr sauber war. Der Kurs bildet weiterhin tiefere Hochs, während er auf demselben Unterstützungsniveau aufliegt.
Die endgültige Bestätigung kommt durch den eigentlichen Ausbruch nach unten. Der Kurs schließt unter der Dreiecks-Unterstützung und unter dem nahegelegenen kleineren Swing-Tief, anstatt nur mit einem Docht darunter zu stechen. Das ist wichtig, weil ein Schlusskurs unter der Unterstützung eine echte Akzeptanz außerhalb des Musters zeigt.
Ausbruchsvolumen kann grundsätzlich zusätzliches Vertrauen geben, aber in diesem Beispiel kommt die Hauptbestätigung von der sauberen Struktur und dem entschlossenen Schlusskurs unterhalb des Ausbruchsbereichs.
Einstieg
Der Einstieg wird direkt unter dem Dreieck platziert, unterhalb der jüngsten Kerzendochte, die das letzte kleinere Swing-Tief gebildet haben. Dies ist ein Breakout-Einstieg, kein früher antizipativer Einstieg innerhalb des Musters.
Diese Platzierung macht das Setup selektiver. Anstatt zu verkaufen, während die Unterstützung noch hält, wartet der Trade darauf, dass der Kurs bestätigt, dass der Boden gebrochen ist. Sobald der Kurs unter dieses tiefere Trigger-Niveau fällt, wird die bärische Trendfortsetzungs-These handelbar.
Kursziel (TP)
TP1 wird an der vorherigen wichtigen Unterstützung unterhalb des Ausbruchs platziert. Dies ist das erste logische Ziel, weil es die nächstgelegene wichtige historische Unterstützung ist, an der der Kurs pausieren, abprallen oder sich verlangsamen könnte.
TP2 wird tiefer platziert, weil unterhalb von TP1 keine klare vorherige wichtige Unterstützung vorhanden war. In diesem Fall wird TP2 als gemessenes Erweiterungsziel behandelt und auf etwa 2R festgelegt, basierend auf der Distanz zwischen Einstieg und TP1. Das gibt dem Trade ein zweites Ziel, falls das bärische Momentum nach der ersten Unterstützungsreaktion anhält.
Stop-Loss
Der Stop-Loss wird oberhalb des oberen Dochtbereichs der jüngsten Kerzen innerhalb des Dreiecks platziert. Diese Zone fungiert als kleiner Widerstand und, noch wichtiger, als Invalidierungsniveau für das Breakdown-Setup.
Diese Platzierung ist strukturell sinnvoll, weil eine Bewegung zurück über dieses Docht-Cluster darauf hindeuten würde, dass der Ausbruch nach unten gescheitert ist und die Verkäufer nicht länger die Kontrolle haben.
Positionsgröße und Trading-Risiko
Die Positionsgröße sollte auf der Distanz zwischen Einstieg und Stop-Loss basieren. Da der Stop oberhalb des jüngsten Widerstands liegt, muss die Positionsgröße so angepasst werden, dass das Gesamtrisiko innerhalb der Grenzen Ihres Risikoprofils bleibt.
In der Praxis legt der Trader zunächst den maximalen Risikobetrag fest und berechnet dann die Positionsgröße anhand der Stop-Distanz. So bleibt der Trade mit dem Risikoplan konsistent und verhindert, dass ein gültiges Chart-Setup zu einer übergroßen Position wird. Wenn die Stop-Distanz den Trade für das Risikolimit des Kontos zu groß macht, ist es besser, die Positionsgröße zu reduzieren oder das Setup auszulassen.
Einschränkungen und Überlegungen
Selbst wenn ein Dreiecksmuster gültig ist, bestimmt die Qualität der Ausführung weiterhin das Ergebnis. Ein schwacher Kontext, begrenztes Ertragspotenzial oder ein schlechter Ausbruch können ein ansonsten sauberes Setup untergraben.
Fehlausbruch
Ein Fehlausbruch tritt auf, wenn der Kurs ausbricht, dann in das Dreieck zurückkehrt und manchmal sogar weiterläuft, um ein anderes Chartmuster zu bilden.
Wichtig: Bulkowski stellte fest, dass gescheiterte Dreiecke zu handelbaren Setups in die entgegengesetzte Richtung werden können. Gescheiterte aufsteigende Dreiecke führen im Durchschnitt zu einem Anstieg von 36 % oder einem Rückgang von 13 %, während gescheiterte absteigende Dreiecke, die nach oben drehen, im Durchschnitt zu einem Anstieg von 40 % führen [Quelle: Bulkowski, T.N. Encyclopedia of Chart Patterns, 3rd ed., Wiley — thepatternsite.com/BustAscTriangles.html & thepatternsite.com/BustDescTriangles.html ]
Wann ist das Chance-Risiko-Verhältnis zu schwach?
Ein Trade ist schwach, wenn nahegelegene Unterstützungs- oder Widerstandsniveaus das Ziel begrenzen oder wenn der Stop im Verhältnis zur wahrscheinlichen Bewegung zu weit entfernt ist. Ein gültiges Muster ist es nicht wert, gehandelt zu werden, wenn die erwartete Rendite zu gering ist.
Wann sollten Trader das Setup auslassen?
Trader sollten das Setup auslassen, wenn die Ausführungsbedingungen schlecht sind, selbst wenn das Muster gültig aussieht. Geringe Liquidität, wichtige geplante Nachrichten, breite Spreads, starke Slippage oder ein bereits weit fortgeschrittener Ausbruch können den Trade schwächen. Ein Setup sollte auch ausgelassen werden, wenn die Stop-Distanz eine normale Positionsgröße unpraktisch macht.
Profi-Tipps für das Trading von Dreiecksmustern
Die praktische Ausführung ist oft genauso wichtig wie das Erkennen des Musters.
Passen Sie den Zeitrahmen an Ihr Trading-Ziel an.
Setzen Sie Alarme, bevor der Kurs den Ausbruchsbereich erreicht.
Markieren Sie die Niveaus für Ausbruch, Stop-Loss und das erste Gewinnmitnahmeziel, bevor der Trade ausgelöst wird.
Überprüfen Sie frühere Dreiecks-Trades nach Markt und Zeitrahmen.
Verwenden Sie einen schriftlichen Trading-Plan, bevor der Ausbruch erfolgt.


