
Silver Price Forecast: XAG/USD bears target $60 as selling pressure intensifies
Von Vishal Chaturvedi
Aktualisiert: 9 Jun 2026


BELIEBTE ARTIKEL

Silver (XAG/USD) tumbles more than 3.5% on Tuesday as price action remains driven by rapidly changing headlines surrounding the Middle East war. At the time of writing, XAG/USD is trading around $65.50, its lowest level since March 23.
- Silver falls to its lowest level since March as the US Dollar rebounds.
- US CPI data due on Wednesday remains the next key catalyst for markets.
- From a technical perspective, XAG/USD stays firmly bearish, with momentum indicators showing sellers remain in control.
Silver (XAG/USD) tumbles more than 3.5% on Tuesday as price action remains driven by rapidly changing headlines surrounding the Middle East war. At the time of writing, XAG/USD is trading around $65.50, its lowest level since March 23.
US President Donald Trump said in a Truth Social post that "the United States must, of necessity, respond to this attack" after Iran allegedly shot down a US Apache helicopter over the Strait of Hormuz.
The comments contrasted sharply with Trump's earlier remarks that negotiations with Iran were in the "final throes" and that an agreement could be reached within days.
Following the latest developments, the US Dollar Index (DXY) trimmed earlier losses and climbed back toward the 100.00 mark as investors sought safety in the Greenback.
Meanwhile, Silver continues to face headwinds from growing expectations that the Federal Reserve (Fed) may need to raise interest rates to contain inflationary pressure stemming from elevated Oil prices.
Traders are now looking ahead to the US Consumer Price Index (CPI) report due on Wednesday. A hotter-than-expected reading would reinforce expectations of higher-for-longer interest rates, providing further support to the US Dollar and potentially adding pressure on non-yielding assets such as Silver.
Technical analysis:
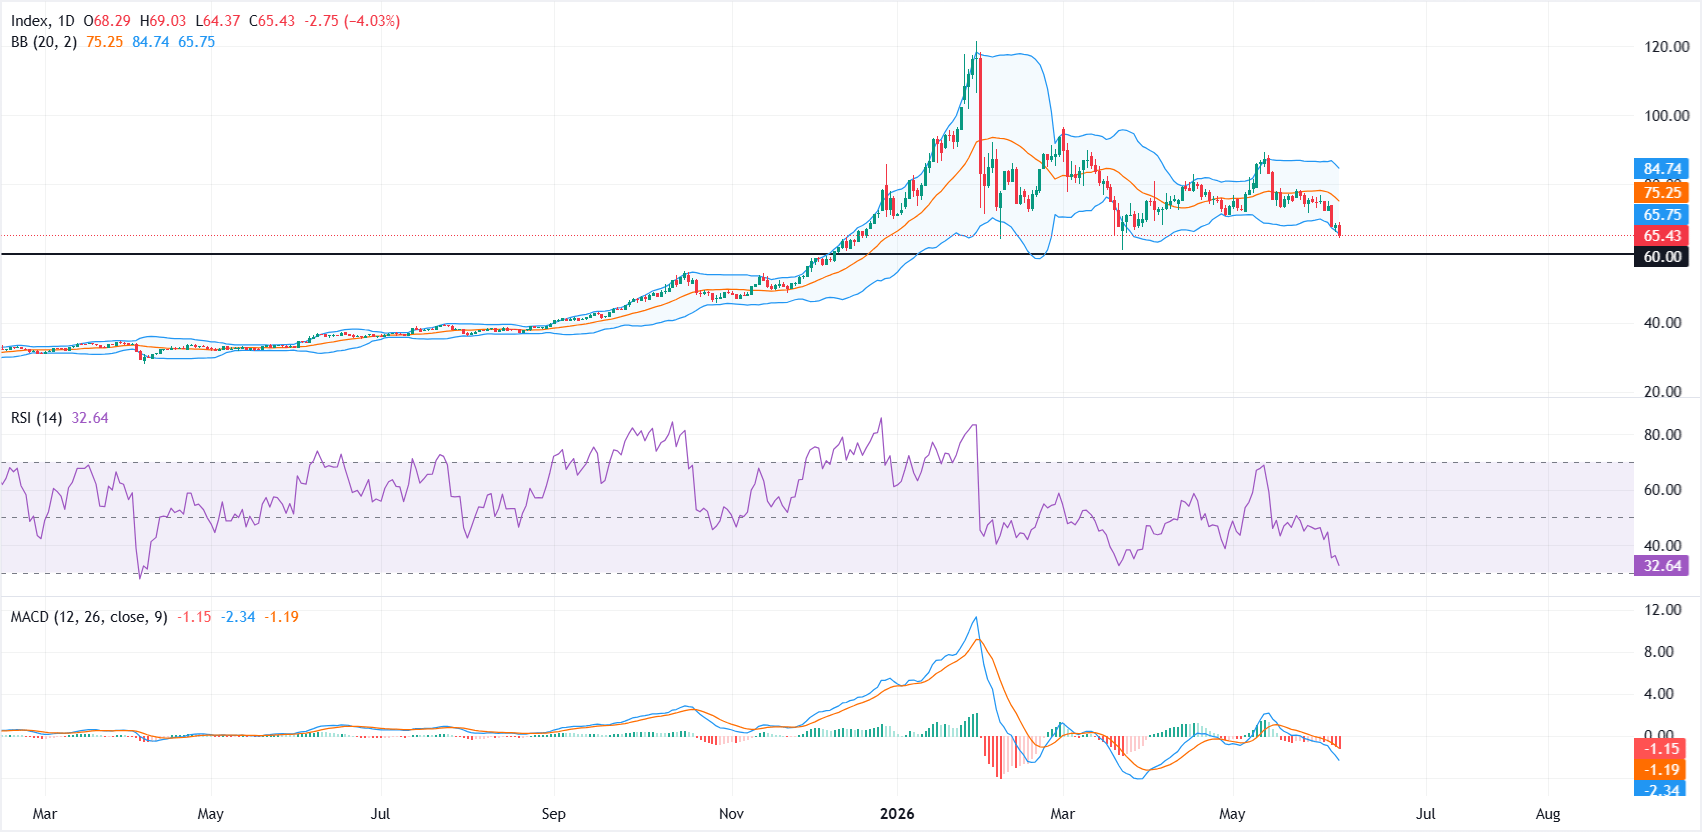
On the daily chart, the near-term bias remains bearish, with price holding below the 20-day Simple Moving Average (SMA) component of the Bollinger Bands at roughly $75.26 and even below the lower band near $65.79, underscoring persistent downside pressure.
Momentum indicators reinforce this soft tone, as the Relative Strength Index (RSI) hovers around 33 in near-oversold territory while the Moving Average Convergence Divergence (MACD) stays negative, suggesting that sellers retain control despite some proximity to stretched conditions.
On the topside, immediate resistance appears at the Bollinger lower band around $65.79, with further hurdles at the Bollinger midline near $75.26 and the upper band toward $84.72, levels that would need to be reclaimed to ease the current bearish structure.
On the downside, the next notable cushion is the horizontal support at $60.00, where a decisive break would open the door to a deeper corrective leg, while holding above this floor could encourage a period of consolidation within the broader downtrend.
(The technical analysis of this story was written with the help of an AI tool.)

Über eine Million Nutzer verlassen sich auf FXStreet für Echtzeit-Marktdaten, Charting-Tools, Experteneinblicke und Forex-News. Der umfassende Wirtschaftskalender und die Bildungs-Webinare helfen Tradern, informiert zu bleiben und fundierte Entscheidungen zu treffen. FXStreet wird von einem Team von rund 60 Fachleuten getragen, verteilt auf den Hauptsitz in Barcelona und verschiedene Regionen weltweit.
Weiterlesen


