

USD/CHF Price Forecast: Rebounds at 0.8042 support, bulls target 0.81
- USD/CHF rebounds from 0.8042 support, preserving bullish structure
- RSI turns higher from neutral, signaling renewed upside momentum
- Break above 0.8100 exposes 0.8171 and 0.8250 resistance
The USD/CHF reversed course, rising by over 0.40% as the Greenback staged a recovery amid overall risk aversion, heightened tensions in the Middle East, and strong US economic data. The pair trades at 0.8088 after bouncing off daily lows of 0.8045.
USD/CHF Price Forecast: Technical outlook
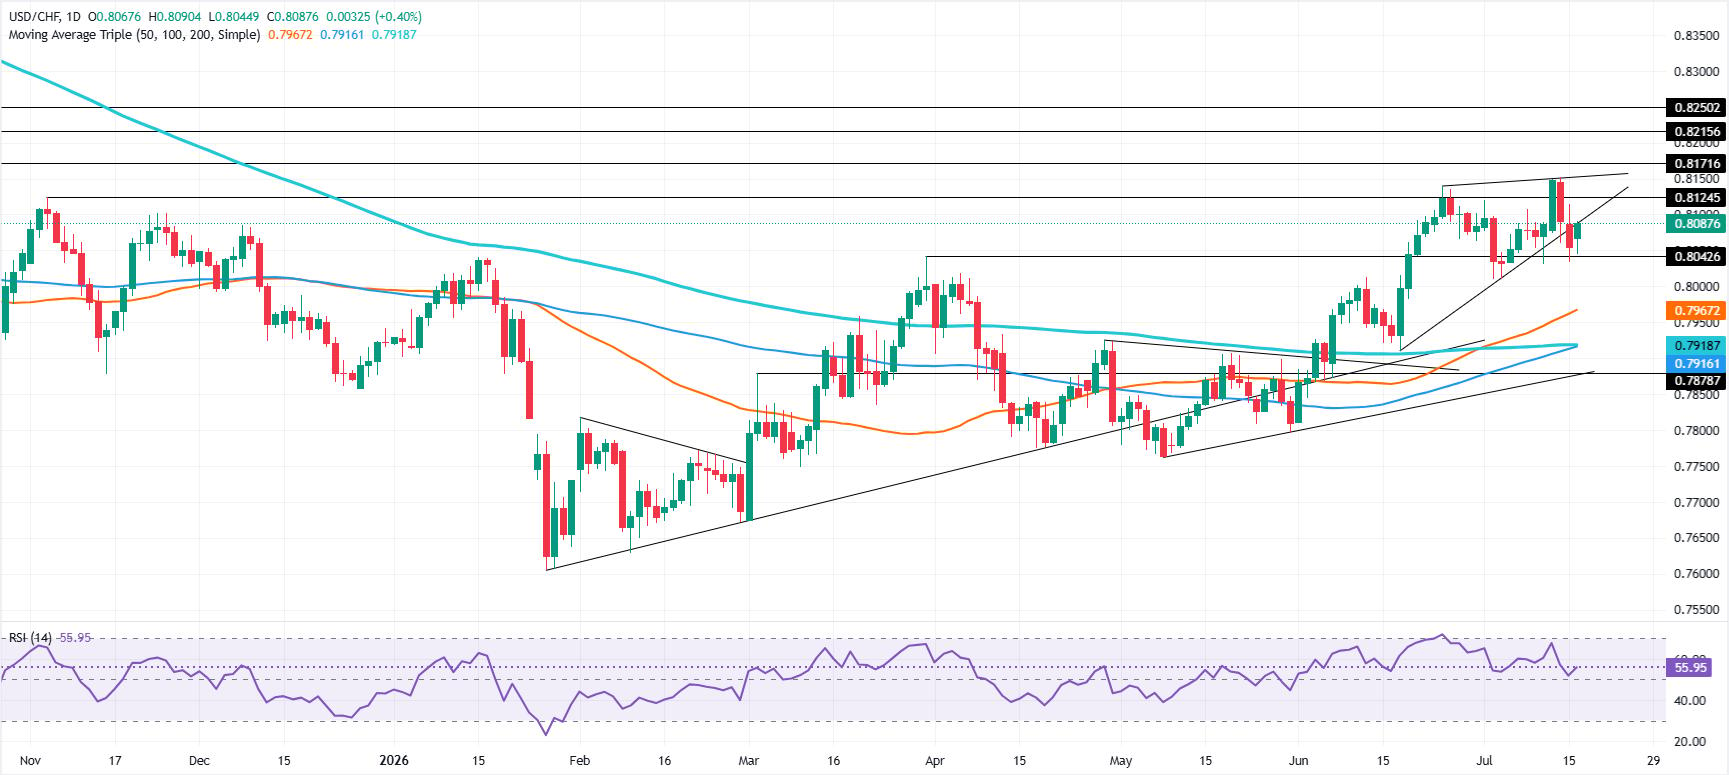
The USD/CHF made a U-turn after testing the March 31 high-turned-support at 0.8042, exacerbating a move towards 0.8100.
Momentum as measured by the Relative Strength Index (RSI) indicates that bulls are gathering some steam, after taking a breather on Wednesday, as the index briefly touched the 50-neutral level. Since then, the RSI’s aim has been towards the 60 level, an indication that the uptrend might continue.
If USD/CHF climbs above 0.8100, this opens the door to test the August 1, 2025, daily peak at 0.8171, and then the June 4, 2025, high at 0.8250. Conversely, a drop below 0.8100 opens the door to test the psychological 0.8000 level. Below this area lies the 50-day Simple Moving Average (SMA) at 0.7967, followed by the 200-day SMA at 0.7918.
USD/CHF Price Chart — Daily
Swiss Franc Price Today
The table below shows the percentage change of Swiss Franc (CHF) against listed major currencies today. Swiss Franc was the strongest against the British Pound.
| USD | EUR | GBP | JPY | CAD | AUD | NZD | CHF | |
|---|---|---|---|---|---|---|---|---|
| USD | 0.19% | 0.46% | 0.11% | 0.05% | 0.06% | 0.09% | 0.41% | |
| EUR | -0.19% | 0.28% | -0.07% | -0.13% | -0.04% | -0.08% | 0.21% | |
| GBP | -0.46% | -0.28% | -0.35% | -0.39% | -0.33% | -0.35% | -0.04% | |
| JPY | -0.11% | 0.07% | 0.35% | -0.08% | 0.03% | -0.01% | 0.29% | |
| CAD | -0.05% | 0.13% | 0.39% | 0.08% | 0.10% | 0.07% | 0.37% | |
| AUD | -0.06% | 0.04% | 0.33% | -0.03% | -0.10% | -0.01% | 0.27% | |
| NZD | -0.09% | 0.08% | 0.35% | 0.01% | -0.07% | 0.01% | 0.29% | |
| CHF | -0.41% | -0.21% | 0.04% | -0.29% | -0.37% | -0.27% | -0.29% |
The heat map shows percentage changes of major currencies against each other. The base currency is picked from the left column, while the quote currency is picked from the top row. For example, if you pick the Swiss Franc from the left column and move along the horizontal line to the US Dollar, the percentage change displayed in the box will represent CHF (base)/USD (quote).














