


What are Morning Star and Evening Star Patterns?
Morning Star and Evening Star are three reversal candlestick patterns in technical analysis that help traders spot a possible shift in market control. A Morning Star forms after a decline and suggests bearish pressure is fading, while an Evening Star forms after a rally and suggests bullish pressure is fading. These patterns are most useful when traders combine them with trend context, support or resistance, and confirmation from price action.
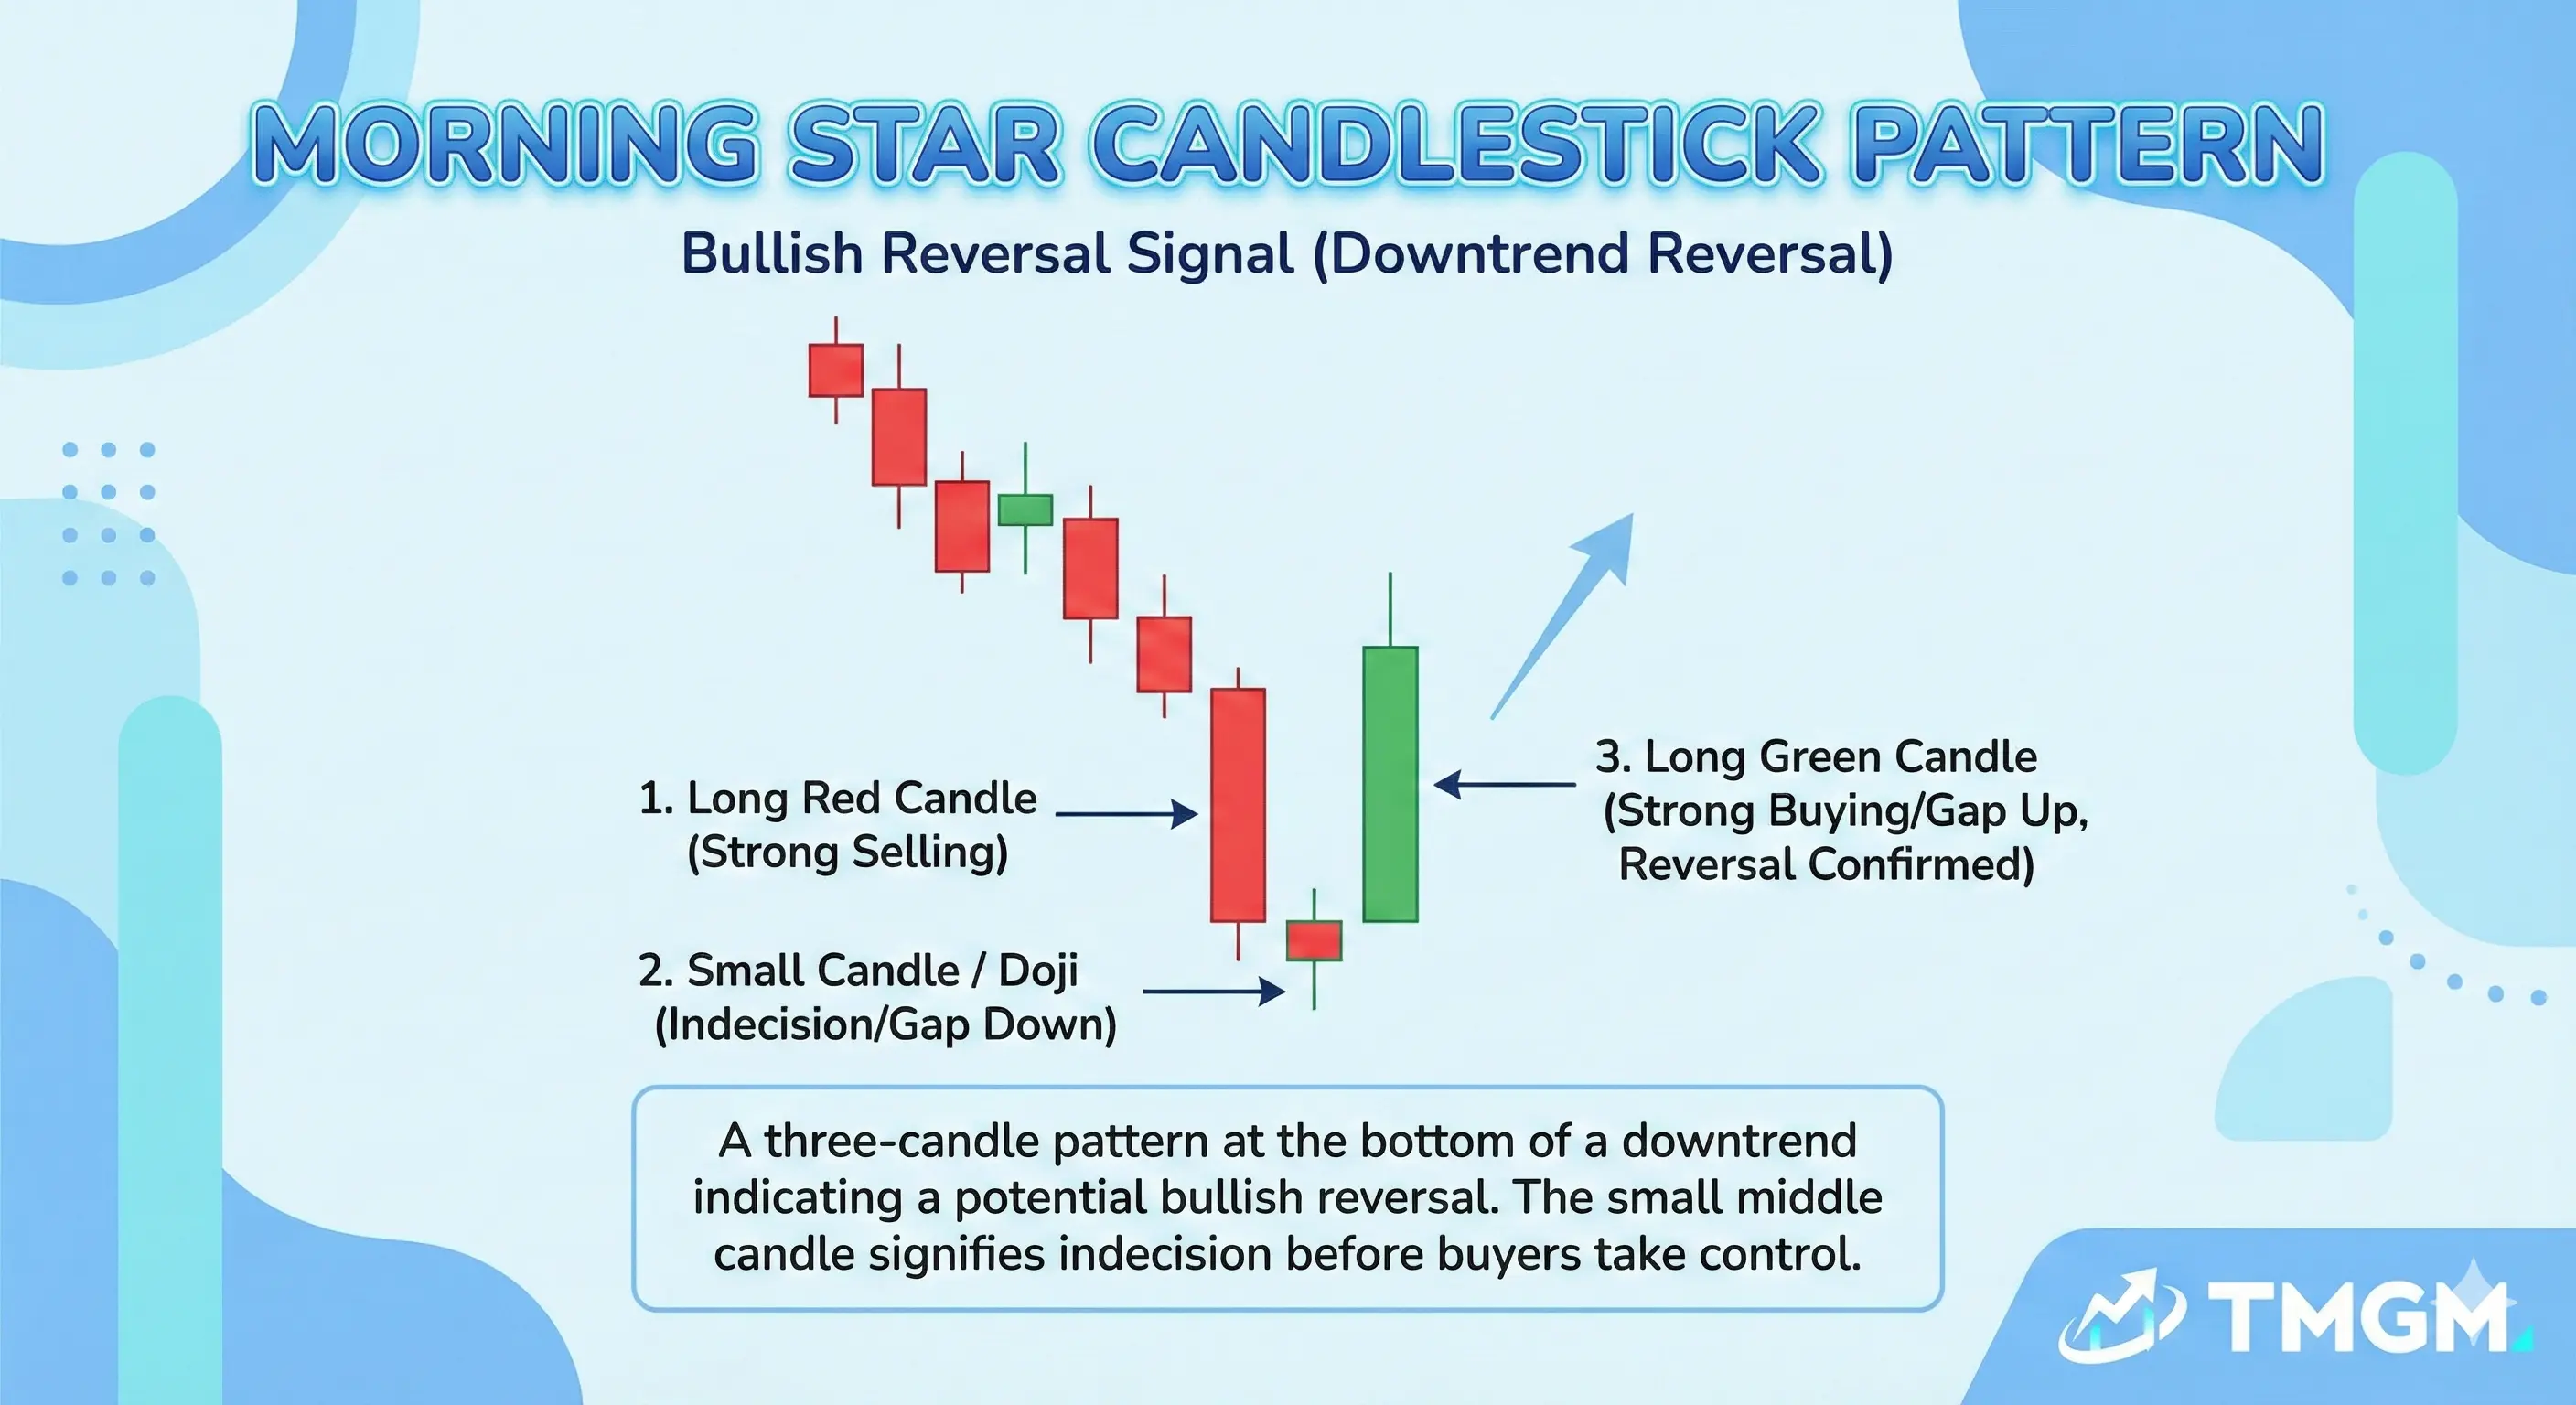
A Morning Star is a bullish reversal pattern made of three candles. It usually appears after a downtrend or a clear bearish swing.
An Evening Star is a bearish reversal pattern made of three candles. It usually appears after an uptrend or a clear bullish swing.
In both patterns, the first candle reflects strong trend pressure, the second shows momentum slowing, and the third confirms a reversal attempt in the opposite direction. The pattern is stronger when it forms at a meaningful support or resistance area instead of in random market noise.
Morning Star Candlestick Pattern Explained
Components
A standard Morning Star has three parts:
A strong bearish first candle that continues the existing decline
A small second candle that shows hesitation, compression, or loss of bearish momentum
A strong bullish third candle that closes well into the body of the first candle
The middle candle can be bullish, bearish, or neutral. What matters most is that it shows the prior selling pressure is no longer expanding cleanly.
Price Action Explained
The first candle shows sellers still in control. The second candle shows that downward momentum is stalling.
The third candle is the key shift in trend. Buyers step in, reclaim ground, and show that the previous bearish move is losing control.
This candlestick pattern tells traders that supply may be drying up. When it forms near support, it can mark the start of a bullish reversal or at least a tradable rebound.
Trading Significance
The Morning Star pattern matters because it shows a change in momentum. It helps traders identify where a bearish move may be ending and where demand may start taking over.
The pattern becomes more useful when it appears near higher time frame support, a prior swing low, a Fibonacci retracement, or a major moving average. In those locations, the pattern carries more context and more trading value.
Important: In forex and CFD markets, a valid Morning Star often appears without a clear gap, so traders should focus on the shift in candle bodies and closes rather than textbook gap rules.
Evening Star Candlestick Pattern Explained
Components
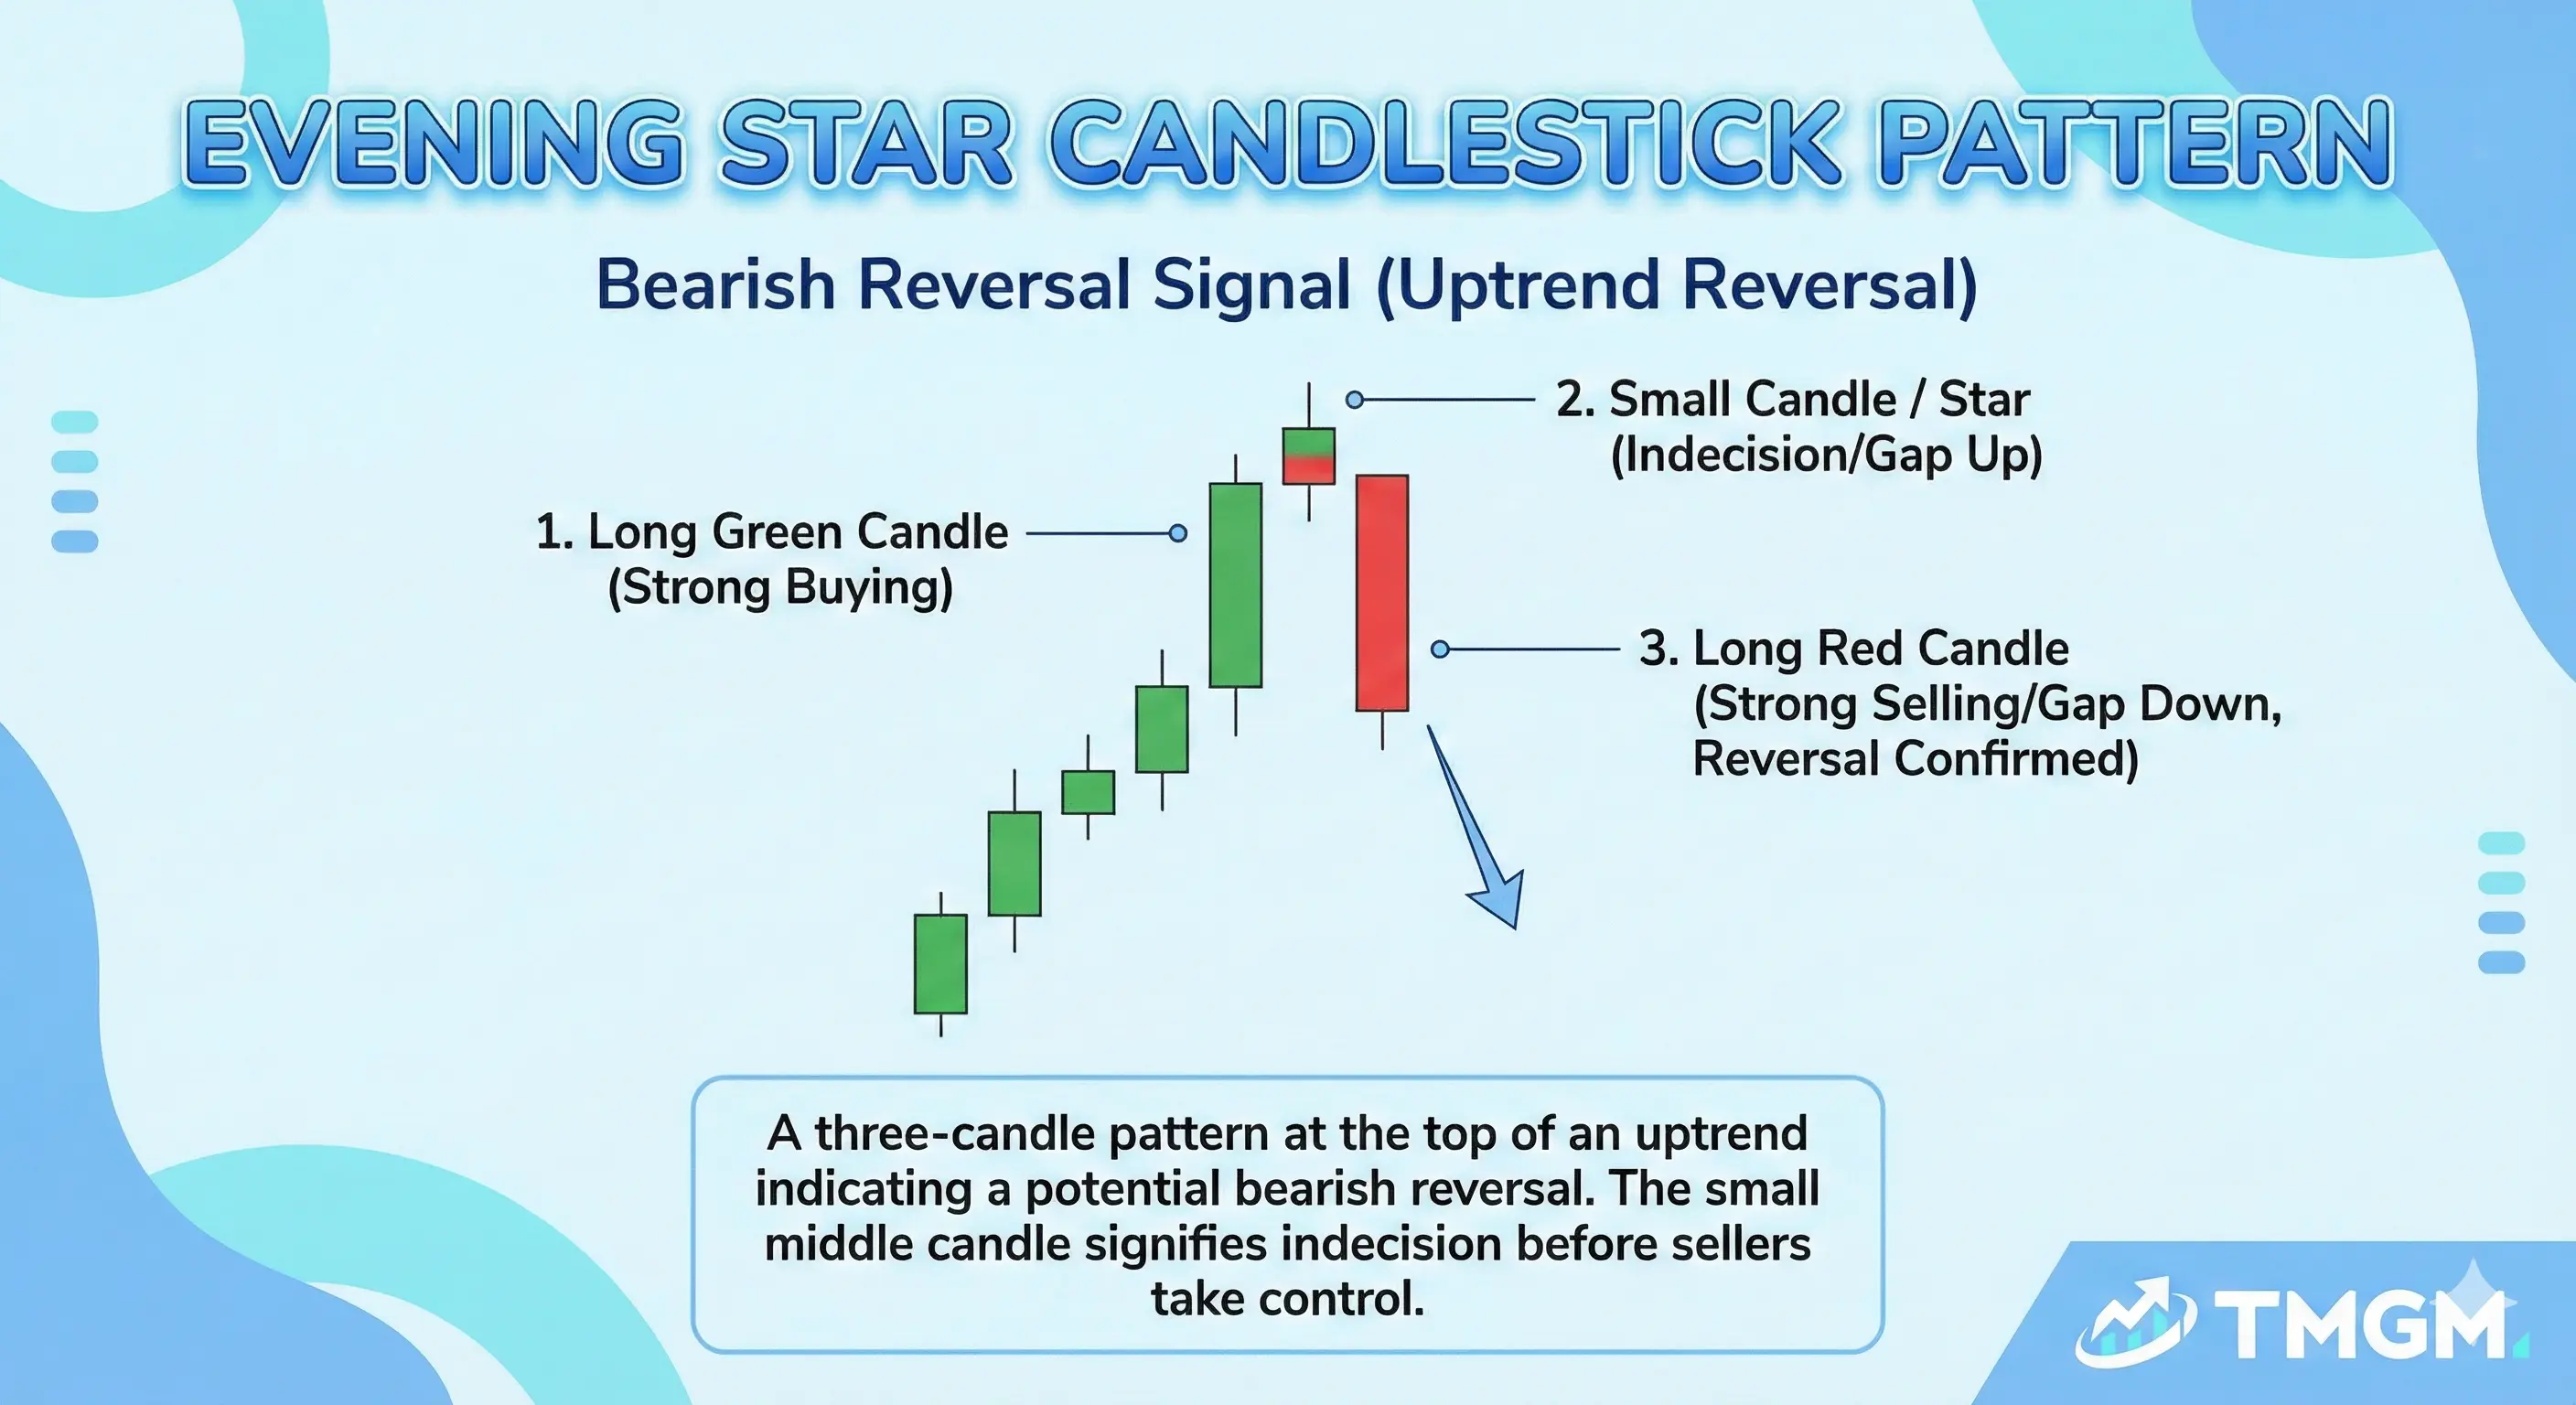 A standard Evening Star also has three parts:
A strong bullish first candle that continues the existing rally
A small second candle that shows hesitation or weakening upward momentum
A strong bearish third candle that closes well into the body of the first candle
The middle candle acts as the transition point. It tells traders that buyers are no longer pushing prices with the same conviction.
Price Action Explained
The first candle shows strong bullish control. The second candle shows that buying pressure is no longer expanding smoothly.
The third candle confirms the shift. Sellers push prices lower and begin to reverse the previous advance.
This candlestick pattern suggests demand is fading and supply is returning. When it forms near resistance, it can mark the start of a bearish reversal or a deeper pullback.
Trading Significance
The Evening Star pattern matters because it helps traders recognise when a bullish move is running out of strength. It often appears near prior highs, resistance zones, or overly stretched market conditions.
The pattern is especially useful when it appears after an extended rally, near a major resistance area, or with bearish confirmation from another tool such as RSI divergence or volume expansion on the third candle.
How to Trade the Morning Star Pattern with Real World Example
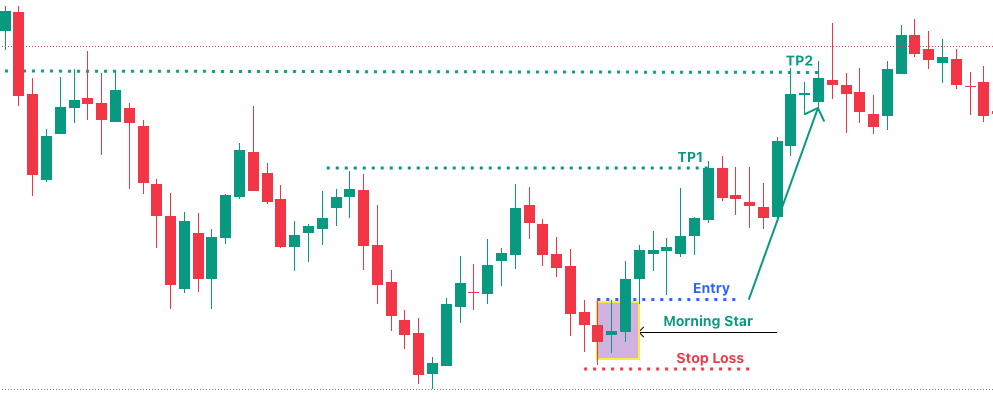
This EUR USD daily chart example shows the first bearish Morning Star candle formed on 21 November 2025, and price reached TP2 on 15 December 2025, giving the setup a 17 bar swing trade path from pattern start to final target.
Start With Market Bias
The first step was trend context. EUR USD had been in an obvious downtrend.
This step was about recognising that the prior selling move was losing momentum and that price can start to build a reversal base after a pullback.
Identify the Three Candle Structure
The Morning Star formed through a clear three part sequence. First came the bearish candle on 21 November 2025, then a middle and smaller hesitation candle near the low, then a strong bullish candle that showed buyers had taken back control.
That is what makes the pattern tradable. The market moves from strong selling, to indecision, to bullish recovery. On a live chart, that transition matters more than finding a perfect textbook shape.
Use Confirmation
The entry was not taken at the pattern low. The chart shows a blue dotted Entry line around the bullish Morning Star area, where the trade waited for price to finish printing the third candle before executing at the bottom of the follow through candle.
That confirmation is important because Morning Star patterns can fail when the third candle does not lead to follow through. In this example, price pushed through the entry level and validated the reversal idea before the trade was active.
Final Confluence
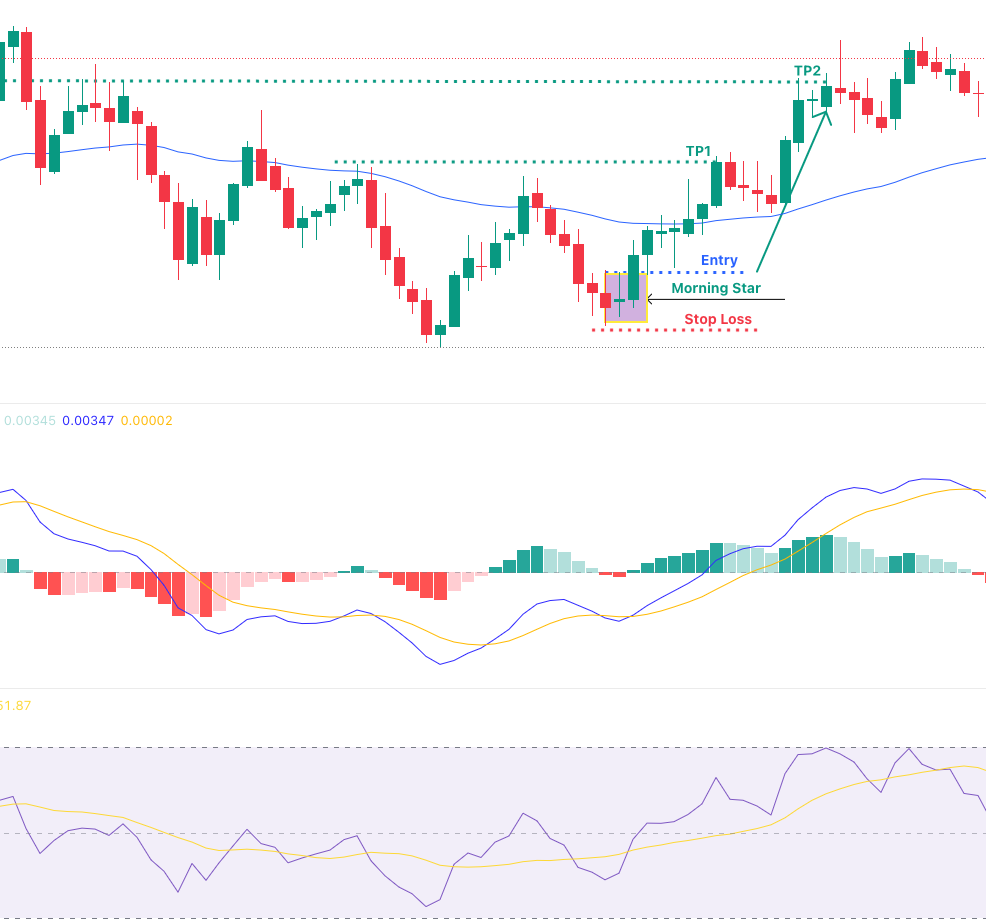
This setup had three layers of confluence, and all three pointed to the same reversal idea. Momentum Technical Indicators came first. As the Morning Star printed, both MACD and RSI started to turn upward and produced bullish crossovers, showing that bearish momentum was fading and bullish momentum was starting to build. On MACD, the crossover was supported by improving histogram bars. On RSI, the turn higher confirmed that momentum was no longer weakening into the low.
The second layer was chart structure. The Morning Star did not appear on its own. It formed around the second trough of a developing double bottom, which gave the setup a broader reversal base instead of a single candle signal in isolation. That matters because the market was not just pausing. It was rejecting the same low area twice and starting to build a more credible shift in direction.
The third layer was dynamic support and resistance from the 50 EMA shown by the blue line. Before the breakout, that moving average acted as overhead resistance. After price broke higher, the 50 EMA flipped into dynamic support and helped hold the pullback after TP1. That support reaction helped the move extend toward TP2. Taken together, the Morning Star, the momentum shift on MACD and RSI, the double bottom structure, and the 50 EMA behaviour all supported the same bullish reversal thesis.
Plan the Trade
Because the confluence was strong, the trade plan was built around confirmation, not anticipation. Entry was taken only after price confirmed the Morning Star breakout, at the point where the candle pattern, the double bottom structure, and the improving momentum signals were already aligning. The stop loss sat below the Morning Star low, which also served as the invalidation point for the wider reversal setup.
The profit plan was based on previous major resistance, which is why TP1 and TP2 were placed at logical chart levels instead of fixed arbitrary distances. After price reached TP1, the next decision was whether the trade still had enough support to remain open. It did. Price pulled back without breaking the bullish structure, MACD and RSI had already turned higher, and the 50 EMA held as dynamic support after the breakout. That kept the reversal case intact and allowed the swing trade to continue into TP2 on 15 December 2025, 17 daily bars after the first bearish Morning Star candle formed.
Risk Management
No candlestick pattern is reliable on its own. A Morning Star or Evening Star can fail when it forms in choppy conditions, against a strong higher time frame trend, or just before major news volatility.
The goal is to manage uncertainty rather than predict every reversal correctly.
A practical approach starts with structure based stops. For a Morning Star, the invalidation point is often below the pattern low. For an Evening Star, it is often above the pattern high.
Position size should be based on the stop distance, not on conviction. If the stop needs to be wide, the position should be smaller so account risk stays controlled.
A 2:1 reward to risk target is a useful baseline because it gives the strategy room to stay viable even when the win rate is not high. Traders should avoid widening stops after entry, because that changes the original risk plan.
Morning Star vs Evening Star Patterns Main Differences
The main difference is direction. A Morning Star tells traders that sellers may be losing control, while an Evening Star tells traders that buyers may be losing control.
The trading logic is the same. Traders still need context, confirmation, confluence, and disciplined risk management before treating either pattern as tradable.
How to Start Trading Morning and Evening Star Candlestick Patterns?
The first step is to understand the pattern logic, not just memorise the shape. Traders should learn how trend, support and resistance, and confirmation work together before using Morning Star or Evening Star in live conditions.
A practical learning path is simple:
• Read this article and related TMGM Academy content on candlestick patterns, market structure, support and resistance, and risk management
• Open a demo account and mark up real chart examples of both patterns across different time frames
• Build a simple checklist for entry, stop loss, target, and confluence
• Review at least 20 to 30 examples before deciding whether the setup fits a trading plan
Once execution becomes consistent on demo, traders can move to a live account with controlled size. Funding and trading should come only after the pattern rules, risk process, and trade journal are already in place.


