
News & AnalysisCareer

A four-week low of 1.3222 remains within reach for the British Pound (GBP) against the US Dollar (USD) during Friday’s European session. Continued US Dollar outperformance is weighing on GBP/USD, leaving sterling looking vulnerable.
A new 19-month high of 103.28 is recorded by the US Dollar Index (DXY) during European trading. The index measures the Greenback against a basket of six major currencies.

The case for further Dollar gains is reinforced by RBC strategists’ observation that “U.S. core-inflation pressures are building, while the labour market remains historically tight,” while ING’s FX team notes that “the combination of hawkish Fedspeak and a US CPI beat earlier this week continues to pay dividends for the dollar.”
Released on Tuesday this week, the October US Consumer Price Index (CPI) report put the increase in core inflation at 0.3%, above estimates of 0.2%. The core measure strips out volatile food and energy items.
For sterling, attention in financial markets turns to next week’s United Kingdom (UK) labour market figures for the three months ending September and Consumer Price Index (CPI) figures for October.
Expectations for Bank of England (BoE) interest rates are likely to be materially influenced by both releases.
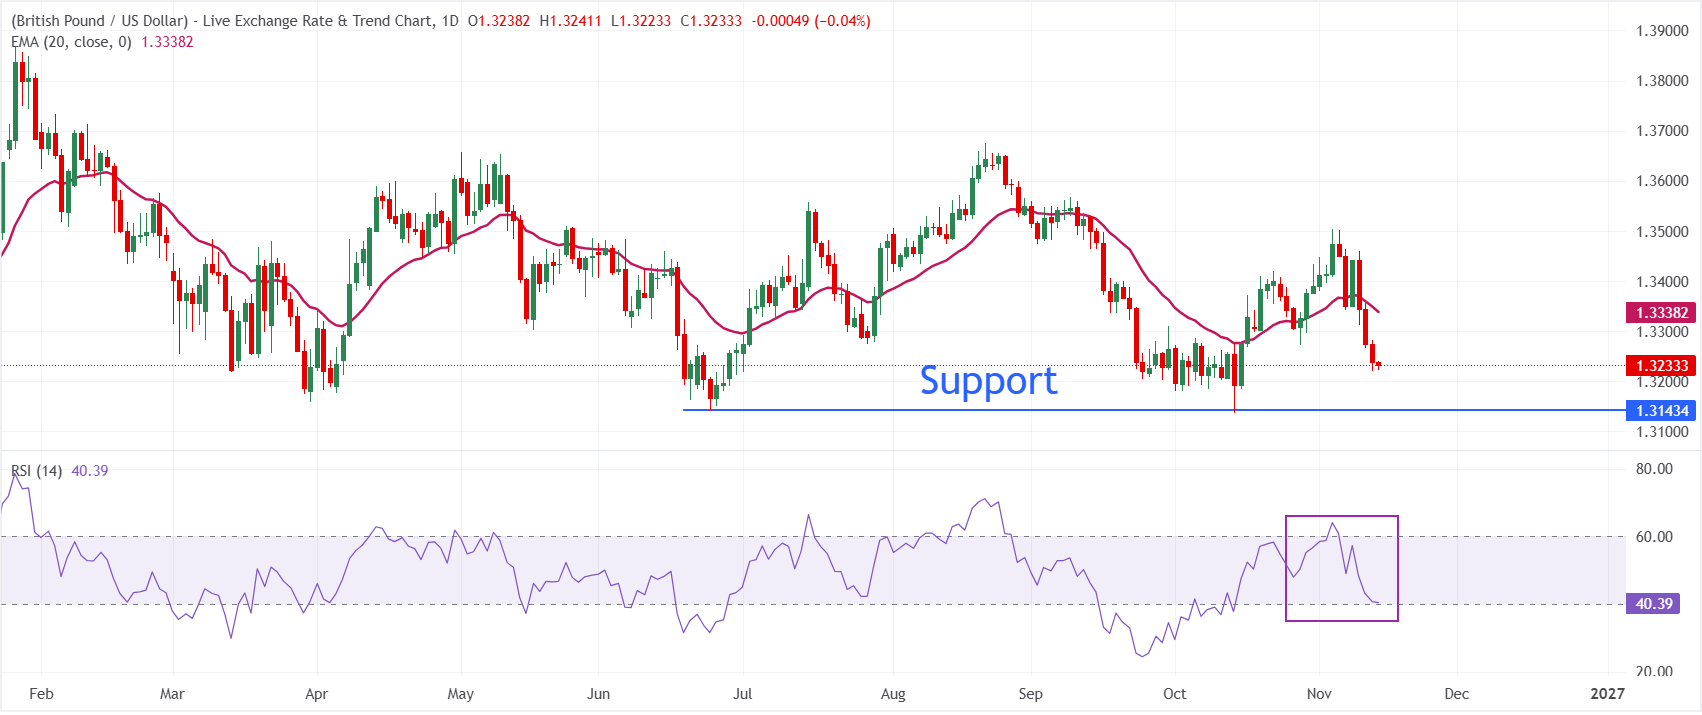
Trading at 1.3234 on the daily chart, GBP/USD remains below its 20-day Exponential Moving Average (EMA) of 1.3338, leaving the near-term outlook bearish. A failure to regain this short-term trend gauge indicates that rebounds remain limited for now. Meanwhile, the Relative Strength Index (14), at around 40, points to weak but stabilising downward momentum rather than intense selling pressure.
To soften the prevailing bearish outlook and pave the way for a more constructive recovery, the pair would need a sustained break above immediate resistance at the 20-day EMA near 1.3338. The supplied indicators do not identify clear nearby support, so traders may turn to recent lows on the price chart for potential interim floors. With GBP/USD still below its short-term moving average, the wider technical outlook favours caution.
(The technical analysis of this story was written with the help of an AI tool. Know more.)
By periodically adding together the prices of a representative basket of goods and services, the Consumer Price Index (CPI) measures inflationary or deflationary trends. Compiled monthly and published by the US Department of Labor Statistics, the data includes a month-on-month (MoM) reading that compares goods prices in the reference month with those in the preceding month. To provide a more accurate gauge of price pressures, the CPI Excluding Food & Energy removes the food and energy components, which are considered more volatile. A higher reading is generally regarded as bullish for the US Dollar (USD), whereas a lower figure is viewed as bearish.
Read further.Latest release: Tue 10 Nov 2026 13:30
Frequency: Monthly
Actual: 0.3%
Consensus estimate: 0.2%
Previous reading: 0.3%
Source: US Bureau of Labor Statistics
Inflation should run at around 2% year on year under the US Federal Reserve’s dual mandate to maintain price stability and maximum employment. Since the onset of the pandemic, which continues to this day, inflation has become the weakest element of that mandate. Supply-chain disruption and bottlenecks continue to push prices higher, leaving the Consumer Price Index (CPI) at multi-decade highs. Having already acted to bring inflation under control, the Fed is expected to retain its aggressive policy stance for the foreseeable future.










The information provided on this website is of a general nature only and does not constitute personal financial advice. Before acting on any information on this website, you should consider the suitability of the information in relation to your objectives, financial situation and needs. Investing in CFDs and FX Margin Contracts carries significant risks and is not suitable for all investors. You may lose more than your initial deposit. You do not own, or have, any interest in the underlying asset. We recommend that you seek independent advice and ensure you fully understand the risks involved before trading. It is important that you read and consider the disclosure document before you acquire any product listed on the website. The information and advertisements offered on this website are not intended for use by any person in any country or jurisdiction where such use would be contrary to local laws and regulations. The Products and Services offered on this website are not intended for residents of the United States, Malaysia and Thailand.
TMGM is authorized and regulated in various jurisdictions.
Trademax Australia Limited, trading as TMGM, is regulated by the Australian Securities and Investments Commission (ASIC), AFSL no. 436416 and is located at Level 28, One International Tower, 100 Barangaroo Avenue, 2000 Sydney, NSW Australia.
Email: support@tmgm.com.au
Trademax Global Limited, trading as TMGM, is authorized and regulated by the Vanuatu Financial Services Commission (VFSC), registration number 40356 and registered at 1276, Kumul Highway, Port Vila, Vanuatu, Republic of Vanuatu.
Email: support@tmgm.com
Trademax Global Markets (SE) Limited, trading as TMGM, is authorized and regulated by the Financial Services Authority (FSA) of Seychelles, with license number SD224. The company is registered at Office No 13, Providence Estate ABIS Centre, Mahe, Seychelles.
Email: support@tmgm.com
Trademax Global Markets (International) Pty Ltd, trading as TMGM, is authorized and regulated by the Financial Services Commission, Mauritius (FSC) with license no. GB22201012, and registered at 33, Edith Cavell Street C/o IQ EQ Fund Services (Mauritius) Ltd Port Louis, 11324 Mauritius.
Email: support@tmgm.com
Copyright © TMGM. All rights reserved


