
News & AnalysisCareer

At around $1.00 on Friday, Ripple (XRP) continues to trade nervously. The remittance token has suffered a steep decline since 5 November, first prompted by the $6.3 billion Binance hack and subsequently intensified by the United States (US) midterm elections.

A modest rise in inflation, shown in the US Consumer Price Index (CPI) report published earlier this week, has strengthened widespread expectations of a December interest rate increase by the Federal Reserve (Fed).
Friday’s reading of the Fear & Greed Index stood at 20 in Extreme Fear territory, compared with 28 a day earlier, underscoring the pronounced lack of appetite for digital assets. The reading is consistent with continued selling across the wider cryptocurrency market and XRP derivatives.
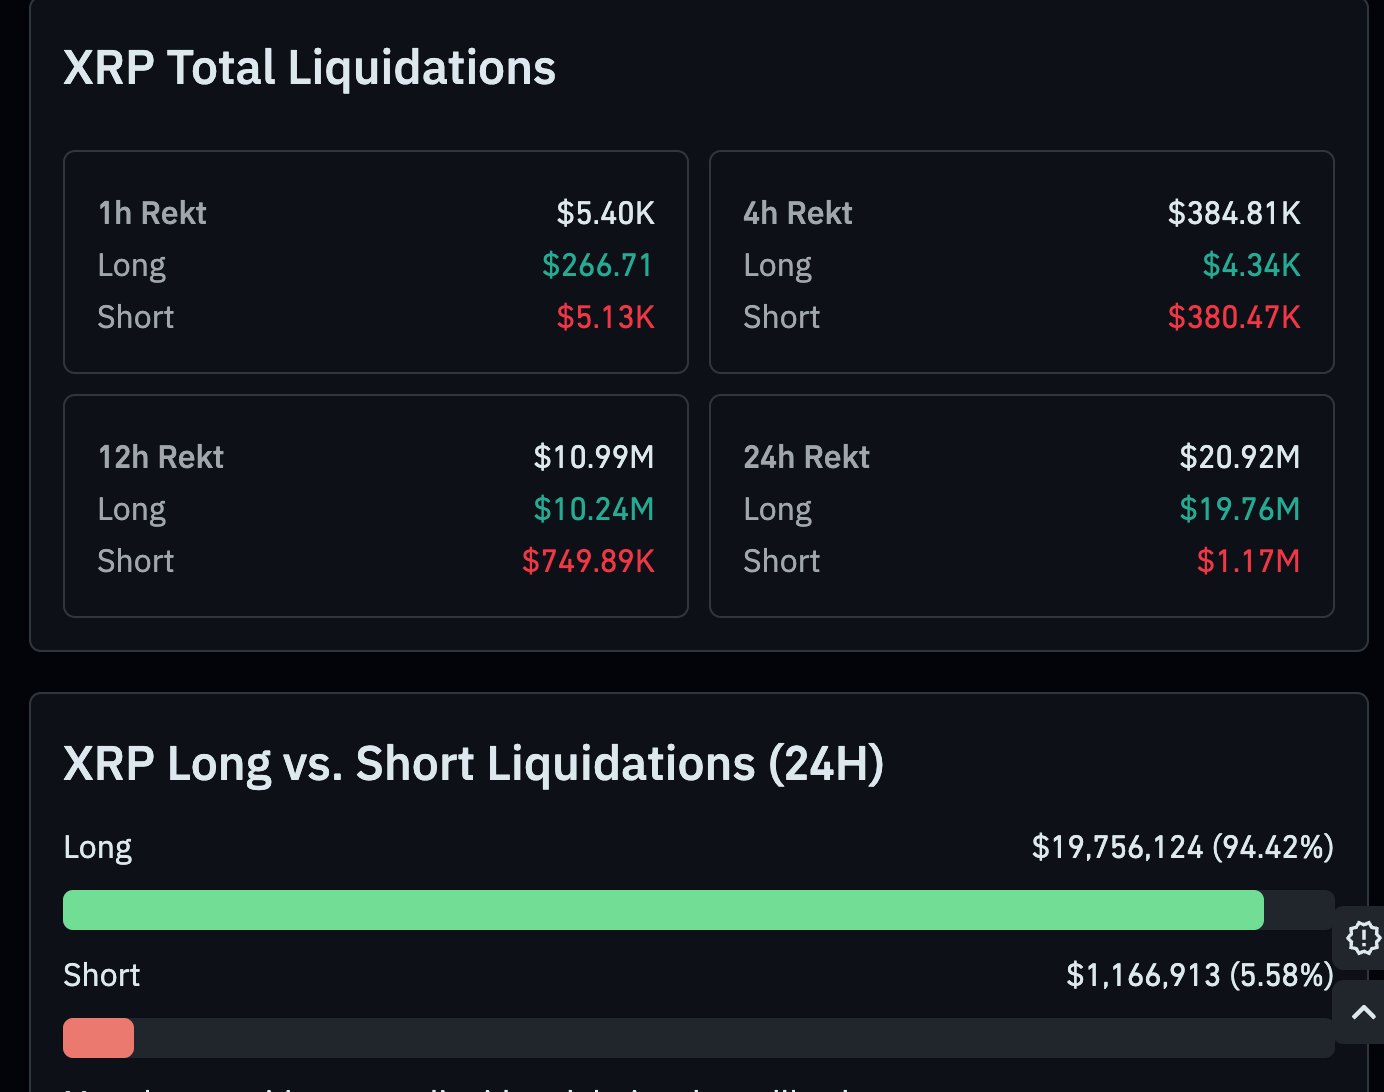
Long positions account for most of the average 24-hour liquidations of more than $20 million reported by CoinGlass. By contrast, just $1.2 million of short positions has been liquidated during the period, leaving bullish traders bearing the brunt of the losses. Should liquidations persist, XRP could face further pressure as additional traders are compelled to close positions.
At $1.03, XRP retains a distinctly bearish bias, trading well below both its short- and long-term Exponential Moving Averages (EMAs) and the active SuperTrend line. A tightly packed set of overhead levels continues to weigh on the pair. The 10-day SuperTrend at $1.19 is the first barrier, followed by the 50-day EMA at $1.26, the descending resistance trendline break level at $1.27, the 100-day EMA at $1.29 and the 200-day EMA at $1.34.
Weak momentum adds to the bearish picture. The Moving Average Convergence Divergence (MACD) indicator remains below zero with a subdued profile, while a Relative Strength Index (RSI) reading of 22 places XRP deep in oversold territory. Although selling pressure is substantial, these conditions suggest the market may be prone to brief corrective rebounds rather than a lasting recovery at this stage.
The available dataset identifies no significant support beneath the prevailing price, leaving the crucial $1.00 demand zone in focus. Above the market, the SuperTrend level near $1.19 presents the first obstacle to a recovery. Only a daily close above that barrier would relieve immediate selling pressure, bringing the 50-day EMA at $1.26 and adjacent descending trendline resistance at $1.27 into view as the next ceilings.
Beyond those levels, a wider medium-term resistance zone comprises the 100-day EMA near $1.29 and the 200-day EMA around $1.34. This band would probably constrain any rebound; while XRP remains beneath it, the broader technical structure stays bearish.
For each cryptocurrency, its developer or creator sets the total number of tokens that may be minted or issued. The algorithm underpinning the blockchain determines how many of these assets can be minted through mining, staking or other mechanisms. Circulating supply can also shrink, whether through token burning or the accidental transfer of assets to addresses on incompatible blockchains.
Multiplying an asset’s circulating supply by its current market value gives its market capitalisation.
Over a specified trading period, such as 24 hours, trading volume measures the total number of tokens of a given asset exchanged between buyers and sellers. By combining activity across centralised and decentralised exchanges, it provides a gauge of market sentiment. Rising volume often signals demand for an asset, as more participants buy and sell the cryptocurrency.
To encourage traders to take positions and keep perpetual contract prices aligned with spot markets, exchanges use funding rates. Through regular periodic payments, this mechanism aims to bring futures prices and index prices into line. A positive funding rate indicates that the perpetual contract trades above the mark price, so bullish traders holding long positions pay those holding short positions. Conversely, when the funding rate is negative, perpetual prices sit below the mark price and short-position holders pay traders with long positions.










The information provided on this website is of a general nature only and does not constitute personal financial advice. Before acting on any information on this website, you should consider the suitability of the information in relation to your objectives, financial situation and needs. Investing in CFDs and FX Margin Contracts carries significant risks and is not suitable for all investors. You may lose more than your initial deposit. You do not own, or have, any interest in the underlying asset. We recommend that you seek independent advice and ensure you fully understand the risks involved before trading. It is important that you read and consider the disclosure document before you acquire any product listed on the website. The information and advertisements offered on this website are not intended for use by any person in any country or jurisdiction where such use would be contrary to local laws and regulations. The Products and Services offered on this website are not intended for residents of the United States, Malaysia and Thailand.
TMGM is authorized and regulated in various jurisdictions.
Trademax Australia Limited, trading as TMGM, is regulated by the Australian Securities and Investments Commission (ASIC), AFSL no. 436416 and is located at Level 28, One International Tower, 100 Barangaroo Avenue, 2000 Sydney, NSW Australia.
Email: support@tmgm.com.au
Trademax Global Limited, trading as TMGM, is authorized and regulated by the Vanuatu Financial Services Commission (VFSC), registration number 40356 and registered at 1276, Kumul Highway, Port Vila, Vanuatu, Republic of Vanuatu.
Email: support@tmgm.com
Trademax Global Markets (SE) Limited, trading as TMGM, is authorized and regulated by the Financial Services Authority (FSA) of Seychelles, with license number SD224. The company is registered at Office No 13, Providence Estate ABIS Centre, Mahe, Seychelles.
Email: support@tmgm.com
Trademax Global Markets (International) Pty Ltd, trading as TMGM, is authorized and regulated by the Financial Services Commission, Mauritius (FSC) with license no. GB22201012, and registered at 33, Edith Cavell Street C/o IQ EQ Fund Services (Mauritius) Ltd Port Louis, 11324 Mauritius.
Email: support@tmgm.com
Copyright © TMGM. All rights reserved


