




One stock wrote the Dow Jones Industrial Average's entire session
- DJIA trades near 53,700, roughly 2% beneath the August 5 record.
- Cisco down roughly 9%, close to 65 index points of a 75-point decline.
- December hike odds 68.3%, down from fully priced three sessions ago.
The Dow Jones Industrial Average trades near 53,700 on Thursday, roughly 75 points and a tenth of a percent lower, on a morning when the S&P 500 prints a fresh record intraday high and the Nasdaq Composite runs close to a percent higher. The obvious reading of that gap is an old-economy benchmark missing a technology rally on a soft inflation print, and it is the wrong one.

The arithmetic runs through a single component that reported its fiscal fourth quarter after Wednesday's session and is being marked down for it. That one reaction accounts for very nearly the whole decline, and what separates this index from the other two averages on Thursday is not the businesses it owns but the method by which it counts them.
One name, most of the move
Cisco (CSCO) trades roughly 9% lower after quarterly results the market read as a disappointment on margins rather than on revenue. The shares carried a price near $124 into the report, so a fall of that size strips close to $11 of share price out of the average. The index is price weighted, converting share-price Dollars into index points at roughly six points per Dollar across the thirty members.
One name therefore delivers something near 65 index points of a decline that runs to 75, which leaves the other twenty-nine roughly where the rest of the market is. Cerebras (CBRS) dropped 13% on its own results and cost the average nothing, because it is not a member, and neither are Meta Platforms (META), Micron (MU) or Netflix (NFLX), the three names doing most of the work in the Nasdaq Composite.
The curve stopped pricing a path
Futures put the odds of at least one increase by December 9 at 68.3%, against a December hike that was fully priced on Monday. September 16 carries 34.4%, down from close to a coin flip, and October 28 sits at 48.9% having been better than three in four. Three sessions and two inflation prints have produced the largest dovish repricing of the year.
The distribution underneath those numbers did not follow them down. The odds of two increases by December stand at 23.3% against 24.1% on Monday, effectively unmoved, while the probability of a cut is exactly zero at every 2026 meeting and does not clear one percentage point until the second half of 2027. This is a market pricing a fork rather than a path: the Strait reopens and there is no increase at all, or it stays shut and there are two.
A hawk spoke, then the print landed
A voting regional Fed president took a podium at 12:15 GMT to argue that the central bank should raise rates now rather than wait, scoring 8.2 against a 7.3 average for the speaker on the calendar's hawkish scale. Fifteen minutes later the July Producer Price Index (PPI) landed unchanged on the month against a 0.2% consensus, with core PPI at 0.2% against 0.3%. The second speaker of the morning, at 12:40 GMT, does not hold a vote this year.
The disinflation inside that release is a barrel rather than a policy, which is the part a rates market repricing off it has to own. Headline producer prices at 4.7% YoY and core at 4.2% sit nowhere near any target, and the sequential cooling tracks Crude Oil handing back its war premium, with Brent roughly 2% lower near $87.00 and West Texas Intermediate (WTI) just above $81.00 against prints above $100.00 last month.
Friday's data
Retail sales for July arrive at 12:30 GMT on Friday, the headline expected at 0.1% against 0.2% previously, sales excluding autos at 0.2% against -0.2%, and a control group whose prior reading was 0.5%. Preliminary University of Michigan sentiment for August follows at 14:00 GMT with a 54.5 consensus from 55.2, one-year inflation expectations last at 4.2% and the five-year at 3.3%.
The inflation-expectation components matter more here than the sentiment headline, because a survey that softens while both horizons hold still gives the front end nothing it can trade. Initial jobless claims at 209K against a 202K consensus already argued on Thursday that the labour side is loosening, which is the half of the mandate this committee has spent the year declining to price.
Levels
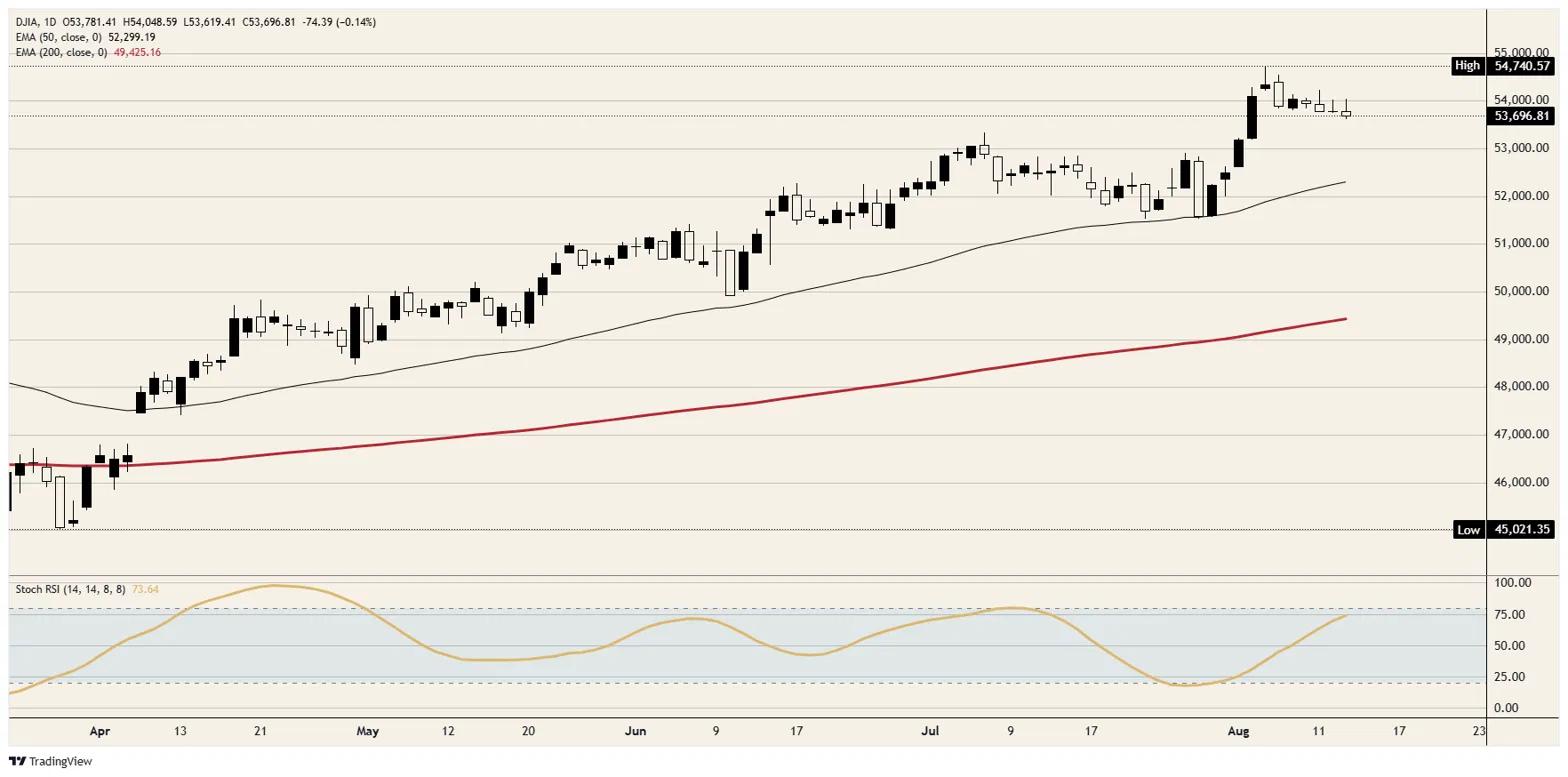
Resistance: Just above 54,000, where Thursday's high stalled within points of Monday's ceiling, and above that the record just short of 54,750.
Support: The 53,600 area, Thursday's low and the first print beneath the 53,800 floor that pinned the index through the week, then 53,500 and 53,250, with the 50-day Exponential Moving Average (EMA) near 52,300 far below.
Bias: Bearish while just above 54,000 caps. Three lower highs since the August 5 record, a floor near 53,800 given up, and a daily Stochastic Relative Strength Index (Stoch RSI) in the mid-70s that has climbed back through its upper half without buying any price progress leave the near-term path lower. Objectives 53,500 then 53,250, invalidation on a daily close above 54,100 reopening the record.
Dow Jones daily chart
Dow Jones FAQs
The Dow Jones Industrial Average, one of the oldest stock market indices in the world, is compiled of the 30 most traded stocks in the US. The index is price-weighted rather than weighted by capitalization. It is calculated by summing the prices of the constituent stocks and dividing them by a factor, currently 0.152. The index was founded by Charles Dow, who also founded the Wall Street Journal. In later years it has been criticized for not being broadly representative enough because it only tracks 30 conglomerates, unlike broader indices such as the S&P 500.
Many different factors drive the Dow Jones Industrial Average (DJIA). The aggregate performance of the component companies revealed in quarterly company earnings reports is the main one. US and global macroeconomic data also contributes as it impacts on investor sentiment. The level of interest rates, set by the Federal Reserve (Fed), also influences the DJIA as it affects the cost of credit, on which many corporations are heavily reliant. Therefore, inflation can be a major driver as well as other metrics which impact the Fed decisions.
Dow Theory is a method for identifying the primary trend of the stock market developed by Charles Dow. A key step is to compare the direction of the Dow Jones Industrial Average (DJIA) and the Dow Jones Transportation Average (DJTA) and only follow trends where both are moving in the same direction. Volume is a confirmatory criteria. The theory uses elements of peak and trough analysis. Dow’s theory posits three trend phases: accumulation, when smart money starts buying or selling; public participation, when the wider public joins in; and distribution, when the smart money exits.
There are a number of ways to trade the DJIA. One is to use ETFs which allow investors to trade the DJIA as a single security, rather than having to buy shares in all 30 constituent companies. A leading example is the SPDR Dow Jones Industrial Average ETF (DIA). DJIA futures contracts enable traders to speculate on the future value of the index and Options provide the right, but not the obligation, to buy or sell the index at a predetermined price in the future. Mutual funds enable investors to buy a share of a diversified portfolio of DJIA stocks thus providing exposure to the overall index.










