
News & AnalysisCareer

A weekly fall of more than 5% is in prospect for Silver (XAG/USD), which slips below $50 again on Friday as traders anticipate more aggressive Federal Reserve (Fed) tightening over the coming months. The metal is trading at around $49 at the time of writing, only slightly above the year-to-date low of $48.87 reached on 30 October.
December’s rate hike is now fully priced in following this week’s US consumer and producer inflation releases and hawkish comments from the Fed, according to the CME FedWatch Tool. Traders favour a quarter-point increase, though they assign a small probability to a half-point rise. Meanwhile, the US Dollar Index (DXY) stands close to 103.40, its strongest level since April 2025. The 10-year US Treasury yield has climbed back above 5%, gaining about 30 basis points this week.
For buyers paying in other currencies, a firmer US Dollar increases the cost of Silver. Rising Treasury yields also make holding the non-yielding metal less attractive by increasing its opportunity cost. Buyers remain largely absent, while technical indicators likewise signal subdued momentum.
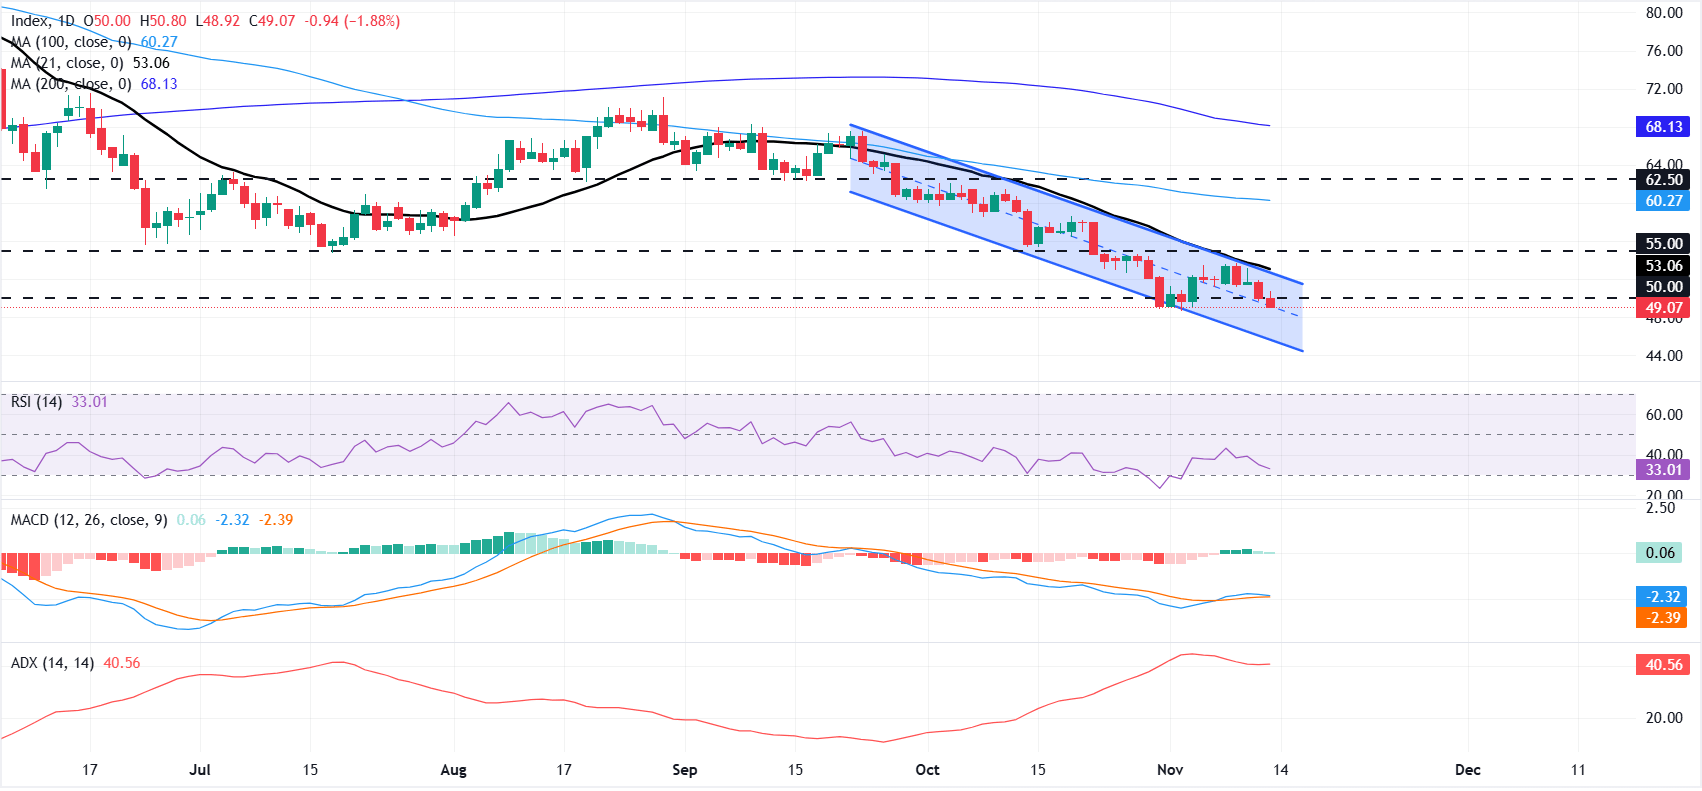
A clearly defined descending parallel channel continues to contain XAG/USD’s decline on the daily chart, with the price below every major moving average. Overhead resistance from the 21-day simple moving average (SMA), the 100-day SMA and the 200-day SMA maintains the near-term bearish bias for as long as the price stays beneath these successive barriers.
At close to 33, the 14-day Relative Strength Index (RSI) sits just above oversold territory, indicating that momentum is still subdued. Although the Moving Average Convergence Divergence (MACD) is slightly positive, its diminishing green histogram bars indicate that the recent improvement in momentum is fading.
Any advance would first encounter resistance at the psychological $50.00 level. Beyond that, the descending channel’s upper boundary near $52.17 and the 21-day SMA at $53.06 create a concentrated supply zone ahead of the next obstacle at $55.00. Further resistance lies at the 100-day SMA of $60.27, followed by a horizontal barrier at $62.50. Above these, the 200-day SMA at $68.13 provides the long-term ceiling underpinning the wider bearish structure.
The next significant support on a further decline lies around $45 at the channel’s lower boundary. A decisive break below it would clear the path for the established downtrend to extend.
(An AI tool assisted in preparing this article’s technical analysis. Find out more.)
Widely traded by investors, Silver is a precious metal with a long history as both a store of value and a means of exchange. Gold is more popular, but traders may choose Silver for its intrinsic value, to diversify their portfolios or as a possible hedge when inflation is high. Exposure can take the form of physical Silver coins or bars, or instruments such as exchange-traded funds that follow its price in international markets.
A broad set of influences can drive Silver prices. Its safe-haven appeal can lift prices during geopolitical turmoil or concerns about a severe recession, though the effect is generally less pronounced than for Gold. Lower interest rates tend to benefit Silver because it pays no yield. With the metal quoted in dollars (XAG/USD), movements in the US Dollar (USD) are another important influence: a firmer Dollar typically restrains Silver, while a weaker one is likely to lift prices. Investment demand, recycling rates and mine supply also matter, with Silver far more abundant than Gold.
Among metals, Silver has one of the highest levels of electrical conductivity, exceeding both Copper and Gold, which makes it widely used in industries such as electronics and solar energy. Stronger demand can push prices higher, whereas weaker demand tends to depress them. Economic developments in the US, China and India can also cause price fluctuations. Large industrial sectors in the US and, especially, China consume Silver across a range of processes. In India, consumer demand for Silver jewellery is also an important influence on prices.
Gold’s price movements are often mirrored by Silver. A rise in Gold typically brings a similar response in Silver, reflecting their comparable standing as safe-haven assets. Relative valuations can be assessed using the Gold/Silver ratio, which measures how many ounces of Silver equal the value of one ounce of Gold. Some investors may interpret a high reading as a sign that Silver is undervalued or Gold overvalued. A low reading, by contrast, may indicate that Gold is undervalued compared with Silver.










The information provided on this website is of a general nature only and does not constitute personal financial advice. Before acting on any information on this website, you should consider the suitability of the information in relation to your objectives, financial situation and needs. Investing in CFDs and FX Margin Contracts carries significant risks and is not suitable for all investors. You may lose more than your initial deposit. You do not own, or have, any interest in the underlying asset. We recommend that you seek independent advice and ensure you fully understand the risks involved before trading. It is important that you read and consider the disclosure document before you acquire any product listed on the website. The information and advertisements offered on this website are not intended for use by any person in any country or jurisdiction where such use would be contrary to local laws and regulations. The Products and Services offered on this website are not intended for residents of the United States, Malaysia and Thailand.
TMGM is authorized and regulated in various jurisdictions.
Trademax Australia Limited, trading as TMGM, is regulated by the Australian Securities and Investments Commission (ASIC), AFSL no. 436416 and is located at Level 28, One International Tower, 100 Barangaroo Avenue, 2000 Sydney, NSW Australia.
Email: support@tmgm.com.au
Trademax Global Limited, trading as TMGM, is authorized and regulated by the Vanuatu Financial Services Commission (VFSC), registration number 40356 and registered at 1276, Kumul Highway, Port Vila, Vanuatu, Republic of Vanuatu.
Email: support@tmgm.com
Trademax Global Markets (SE) Limited, trading as TMGM, is authorized and regulated by the Financial Services Authority (FSA) of Seychelles, with license number SD224. The company is registered at Office No 13, Providence Estate ABIS Centre, Mahe, Seychelles.
Email: support@tmgm.com
Trademax Global Markets (International) Pty Ltd, trading as TMGM, is authorized and regulated by the Financial Services Commission, Mauritius (FSC) with license no. GB22201012, and registered at 33, Edith Cavell Street C/o IQ EQ Fund Services (Mauritius) Ltd Port Louis, 11324 Mauritius.
Email: support@tmgm.com
Copyright © TMGM. All rights reserved

