
News & AnalysisCareer

The $70,000 psychological threshold gives way for Bitcoin (BTC) on Friday, while Ethereum (ETH) breaches support at $2,000, increasing the risk of additional declines. Selling in BTC, ETH and Ripple (XRP) continues as bearish momentum strengthens. With sellers still dominant, XRP also retreats, leaving it vulnerable to a deeper correction towards $1.00.

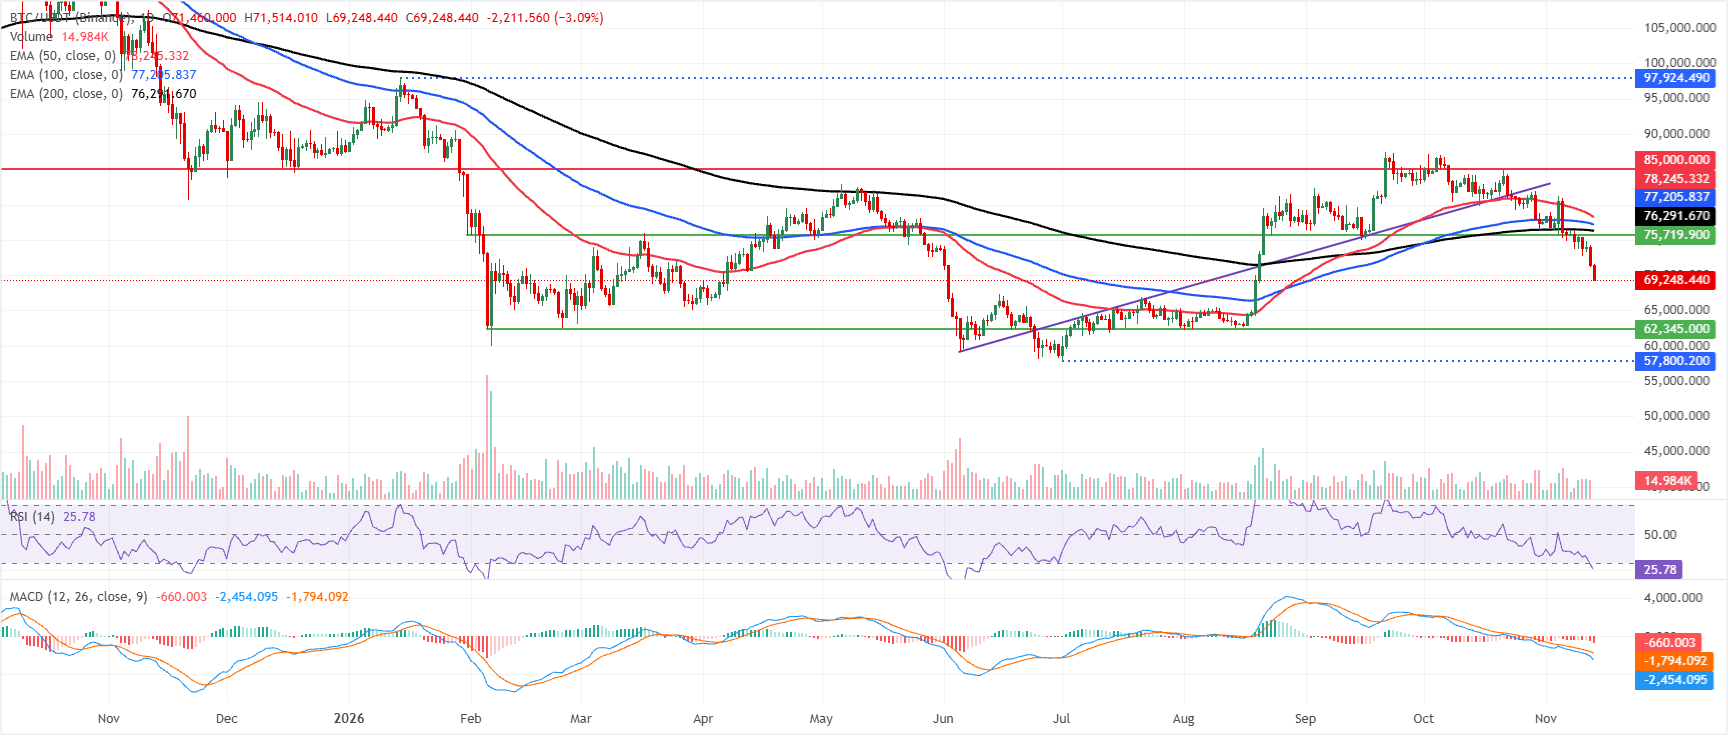
At $69,195 on Friday, Bitcoin is extending its retreat considerably below the main Exponential Moving Averages (EMAs). Overhead resistance comes from the 200-day EMA at $76,291, the 100-day EMA at $77,205 and the 50-day EMA at $78,245. As BTC moves further away from its previous consolidation range, these levels reinforce the bearish short-term outlook.
A reading of 25 puts the Relative Strength Index (RSI) in oversold territory. The Moving Average Convergence Divergence (MACD), meanwhile, is still deeply negative. This points to strong downward momentum, although stretched conditions could prompt short-term rebounds.
Any recovery would first encounter the 200-day EMA near $76,291, with the 100-day EMA at $77,205 and the 50-day EMA at $78,245 providing the next resistance levels. Together, they form a concentrated supply area likely to restrain rebound attempts. Should the pair stage a stronger recovery, sellers could regain control at the higher horizontal resistance of $85,000.
The current dataset offers no significant nearby support, so traders may turn to intraday price movements and earlier swing lows to identify possible stabilisation points. Nevertheless, the wider technical outlook remains skewed downwards while BTC stays below these major EMAs.
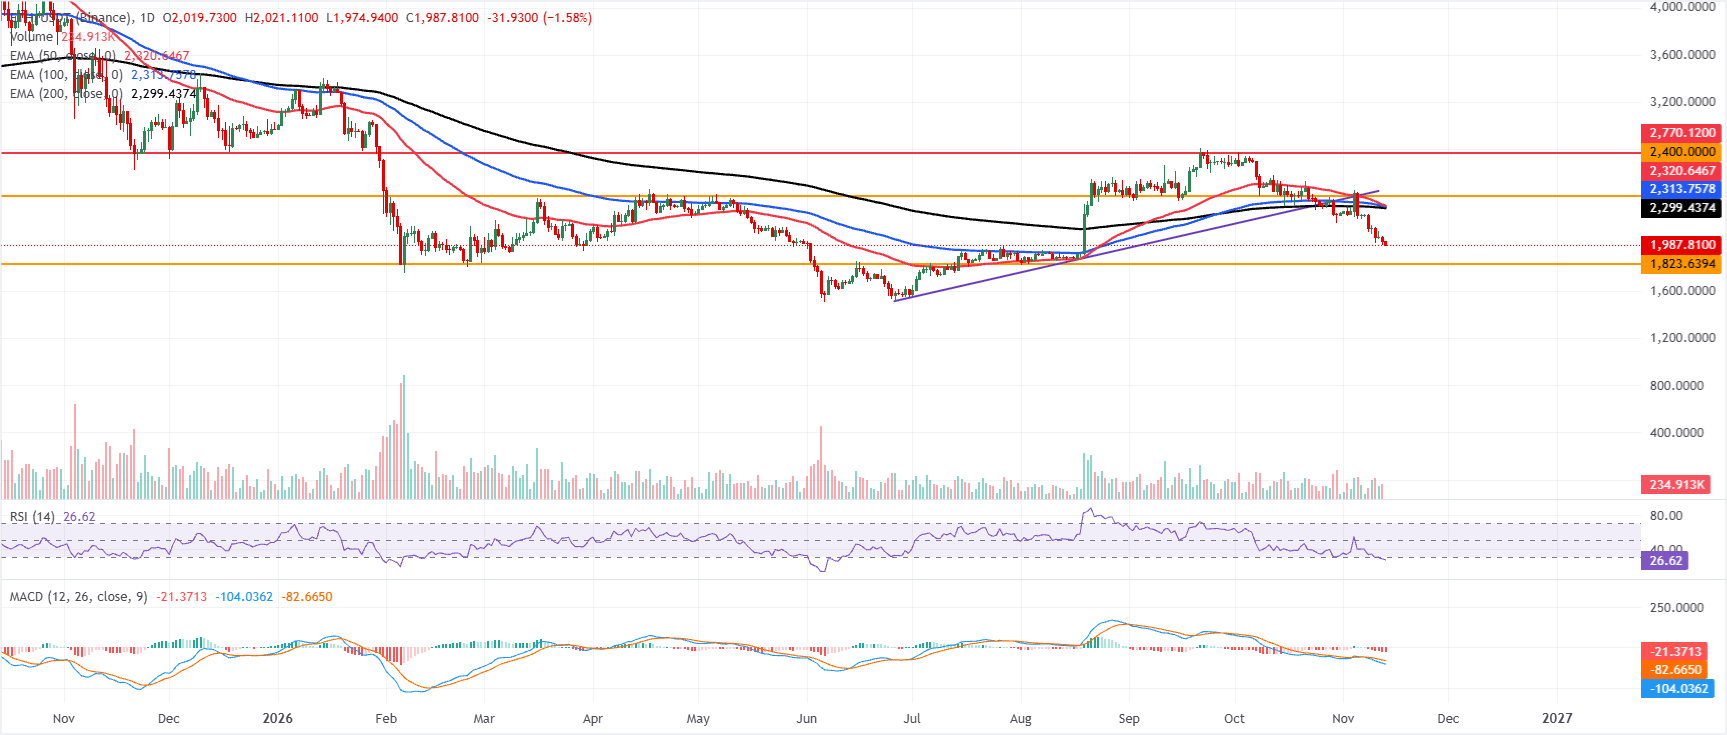
Trading at $1,987 on Friday, Ethereum remains in a bearish phase, well below the 50-day, 100-day and 200-day EMAs grouped between roughly $2,299 and $2,320. This cluster of overhead averages continues to constrain the outlook following the pair’s break beneath its former rising support line. The trendline break area near $2,459 now represents a more distant obstacle.
Oversold conditions are reflected in an RSI of about 26, while the MACD remains negative and below zero. These readings indicate continued downward pressure, despite signs that short-term selling is stretched.
The nearest structural demand lies at horizontal support around $1,823. If that level is tested, buyers could try to stem the decline.
A rebound would initially face the 200-day EMA around $2,299, then the 100-day EMA at $2,313 and the 50-day EMA at $2,320. This tight resistance cluster stands ahead of the psychological $2,400 threshold. Further up, the broken rising trendline area around $2,459 and horizontal resistance near $2,770 would both need to be regained to restore a more positive medium-term outlook.
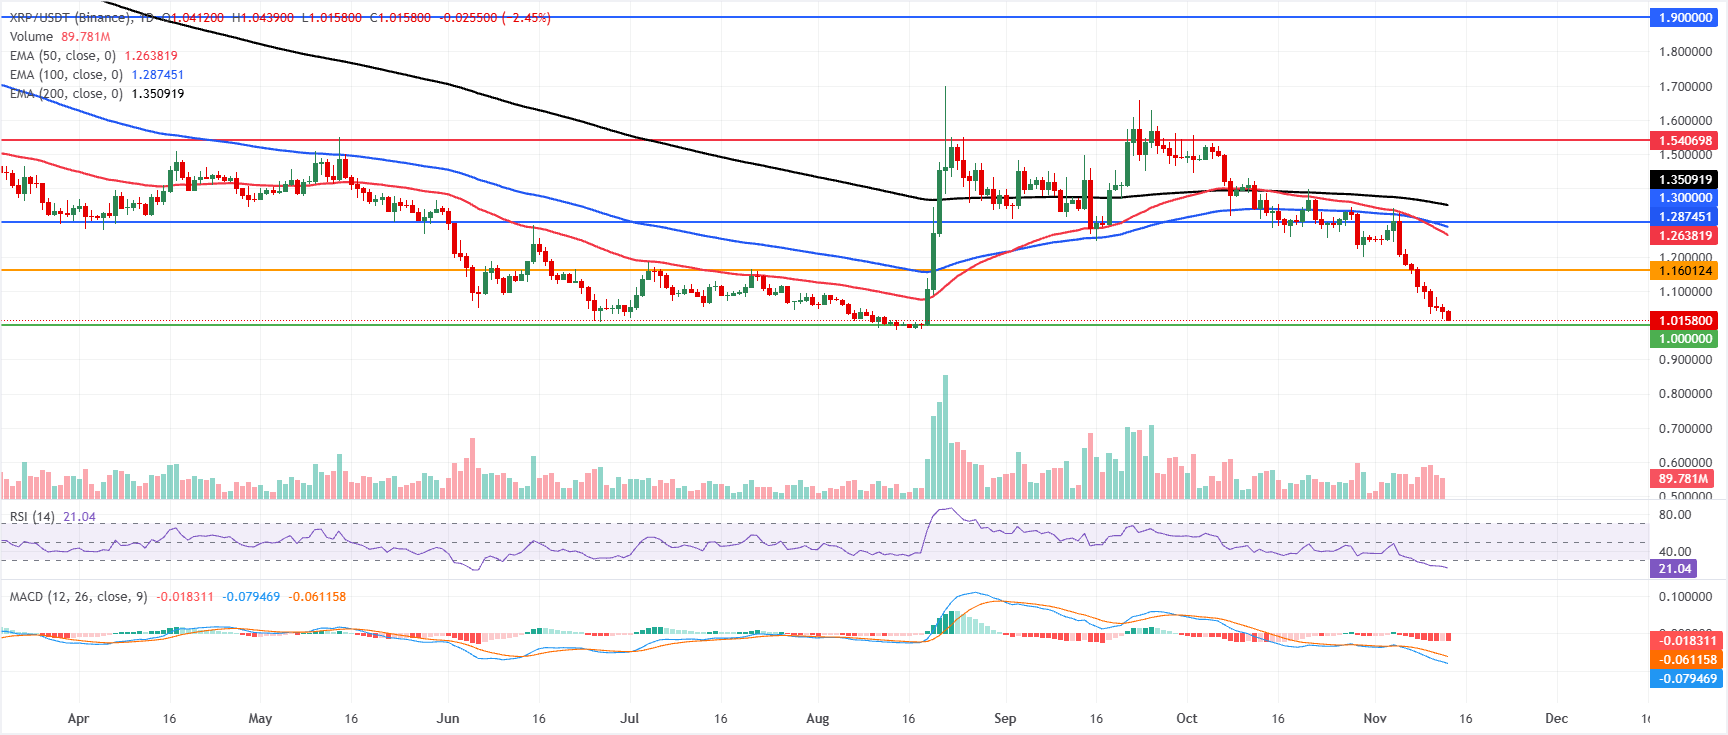
At $1.015 on Friday, XRP retains a bearish short-term outlook, trading firmly beneath its 50-day, 100-day and 200-day EMAs at $1.263, $1.287 and $1.350 respectively. An RSI around 21 remains in oversold territory, alongside a MACD reading below zero. Despite the stretched sell-off, these indicators point to sustained downward pressure.
A recovery would meet initial resistance at $1.160 before reaching the more significant $1.300 barrier. Longer-term EMAs grouped around $1.287–$1.350 add to this broader supply area, with further resistance above at $1.540 and $1.900.
Horizontal support at $1.000 provides the immediate floor. Losing it decisively would open the way to fresh lows; holding above it, however, could permit a corrective rebound towards the resistance levels outlined above.
(The technical analysis of this story was written with the help of an AI tool. Know more.)
Demand and adoption among market participants can be shaped by token launches. When an asset is listed on cryptocurrency exchanges, its liquidity deepens and new participants join its network. For a digital asset, these developments are generally bullish.
By exploiting vulnerabilities, bugs or other methods, an attacker can seize a large quantity of an asset from a DeFi bridge or a hot wallet belonging to an exchange or another cryptocurrency platform. This constitutes a hack. The attacker subsequently moves the tokens off exchange platforms, ultimately selling them or swapping them for other cryptocurrencies or stablecoins. Widespread panic often accompanies such incidents, triggering selling in the affected assets.
The direct effect on the US Dollar is the principal channel through which macroeconomic events, such as interest rate decisions by the US Federal Reserve, influence crypto assets. Higher interest rates generally weigh on Bitcoin and altcoin prices, while lower rates tend to have the opposite effect. A fall in the US Dollar index makes risk assets and the leverage used to trade them cheaper, which in turn pushes cryptocurrency prices higher.
By cutting miners’ block rewards in half, halvings restrict the asset’s supply and are therefore generally viewed as bullish events. With demand unchanged, a reduction in supply raises the asset’s price.










The information provided on this website is of a general nature only and does not constitute personal financial advice. Before acting on any information on this website, you should consider the suitability of the information in relation to your objectives, financial situation and needs. Investing in CFDs and FX Margin Contracts carries significant risks and is not suitable for all investors. You may lose more than your initial deposit. You do not own, or have, any interest in the underlying asset. We recommend that you seek independent advice and ensure you fully understand the risks involved before trading. It is important that you read and consider the disclosure document before you acquire any product listed on the website. The information and advertisements offered on this website are not intended for use by any person in any country or jurisdiction where such use would be contrary to local laws and regulations. The Products and Services offered on this website are not intended for residents of the United States, Malaysia and Thailand.
TMGM is authorized and regulated in various jurisdictions.
Trademax Australia Limited, trading as TMGM, is regulated by the Australian Securities and Investments Commission (ASIC), AFSL no. 436416 and is located at Level 28, One International Tower, 100 Barangaroo Avenue, 2000 Sydney, NSW Australia.
Email: support@tmgm.com.au
Trademax Global Limited, trading as TMGM, is authorized and regulated by the Vanuatu Financial Services Commission (VFSC), registration number 40356 and registered at 1276, Kumul Highway, Port Vila, Vanuatu, Republic of Vanuatu.
Email: support@tmgm.com
Trademax Global Markets (SE) Limited, trading as TMGM, is authorized and regulated by the Financial Services Authority (FSA) of Seychelles, with license number SD224. The company is registered at Office No 13, Providence Estate ABIS Centre, Mahe, Seychelles.
Email: support@tmgm.com
Trademax Global Markets (International) Pty Ltd, trading as TMGM, is authorized and regulated by the Financial Services Commission, Mauritius (FSC) with license no. GB22201012, and registered at 33, Edith Cavell Street C/o IQ EQ Fund Services (Mauritius) Ltd Port Louis, 11324 Mauritius.
Email: support@tmgm.com
Copyright © TMGM. All rights reserved


