


Top Stocks for Day Trading
While there’s no guaranteed success in stock trading, there are specific factors traders can monitor to enhance their chances of profitability:
Trading Volume
Given the fast-paced nature of day trading, stocks with low daily volume can pose challenges. Selecting stocks with high trading volume is crucial as it typically results in narrower bid-ask spreads, which helps preserve potential profits. Low-volume stocks may also exhibit higher volatility. In general, high-volume stocks attract more active traders, leading to greater liquidity and tighter spreads.
Market Trends
Identifying trending stocks is essential, and technical indicators are valuable tools for this purpose:
Moving Averages. This indicator smooths out price action by filtering out noise from random price fluctuations
The Moving Average Convergence Divergence (MACD) indicator gauges buying and selling momentum as well as price divergences. A histogram above the zero line signals bullish momentum; below indicates bearish momentum. ’
Awesome Oscillator . This tool provides traders with a clear visualization of market trends. Positive readings suggest an uptrend, while negative readings indicate a downtrend.
Trading Timeframes 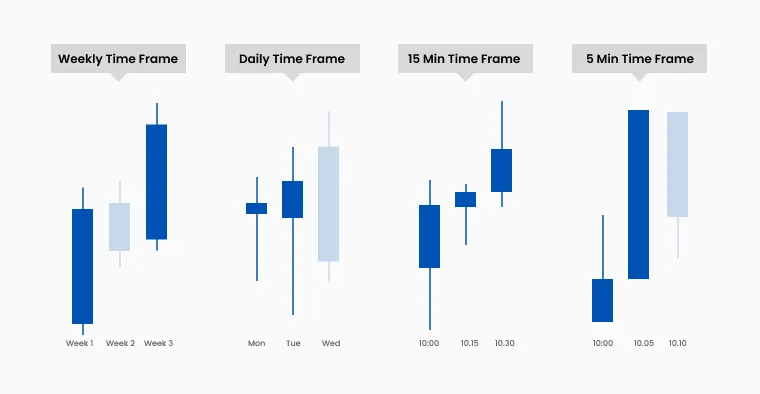
Timeframes provide critical insights for day traders. For example, candlestick charts display an asset's high, open, close, and low prices within a specific period. Common timeframes include 1-minute (M1), 5-minute (M5), and 15-minute (M15) charts, among others.
Utilizing multiple timeframes helps traders identify trends, align trading strategies, manage risk, and spot entry and exit opportunities.
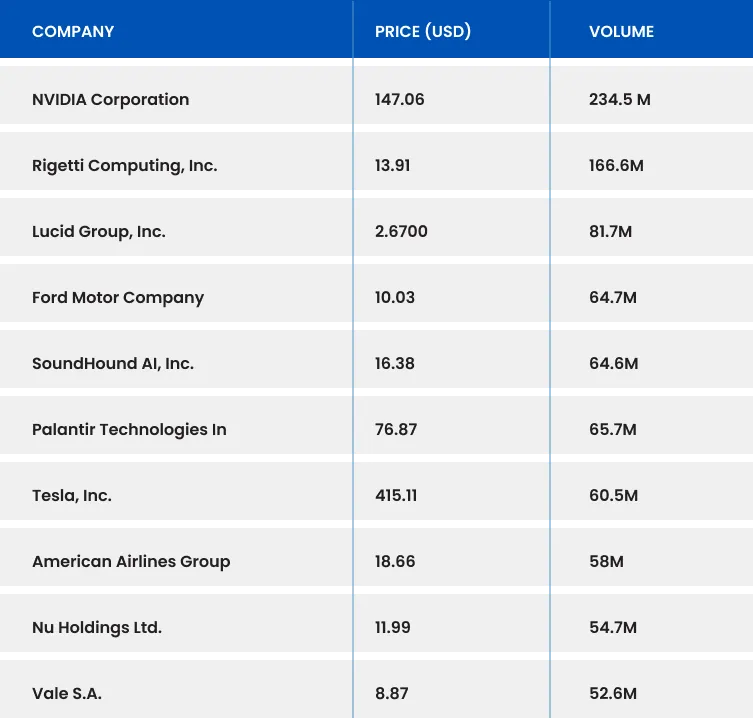
Recommended Stocks for Day Trading
Since stock dynamics change frequently, staying updated with the latest active stock lists and market news is essential. Here’s a selection of actively traded stocks to consider:
Trading CFDs on Stocks with TMGM
One of the most accessible ways to begin trading is by opening a demo account; this simulates real trading conditions without any financial risk. Once you have established your trading objectives and risk tolerance, you can transition to a live account.


