
Apply for a Live
Account
AcademyPartners

The top 10 candlestick chart patterns for trading are the Ascending Triangle Pattern, Descending Triangle Pattern, Symmetrical Triangle Pattern, Flag Pattern, Wedge Pattern, Double Top, Double Bottom, Head and Shoulders, Rounded Top and Rounded Bottom, Cup and Handle. These patterns are widely used for identifying potential trend reversals in financial markets. Right from your first trade on anything like NIFTY or USD/INR chart, chart patterns can help you make sense of price swings instead of guessing. By learning how these patterns form and how to trade them with clear rules, you can plan entries, stops and profit targets more confidently on charts like NSE, BSE and MCX.
Chart patterns are repeatable shapes formed by price movement on your candlestick chart. Instead of reading every candle one by one, you group swings into structures like triangles, flags, wedges, double tops and other patterns.
For you as an Indian trader, chart patterns are especially useful because they:
Work across different markets & instruments — NIFTY, BANK NIFTY, USD/INR, MCX Gold, MCX Crude, stocks on NSE/BSE
Work on the timeframes you actually trade — 5-minute, 15-minute, hourly, daily
Give a simple framework for planning trades around support, resistance and breakouts
Indian markets can move sharply around events like RBI policy, Union Budget, results season or weekly index expiry. Chart patterns help you:
Read market psychology around these events
Spot when price is consolidating before a big move
See when trends in NIFTY or USD/INR are strengthening or weakening
Create IF–THEN rules, such as:
“If NIFTY breaks above this triangle, then I will buy with stop below the pattern low.”
Instead of reacting emotionally to big candles or news, you let chart structures guide your decisions.
You will mostly work with three groups of chart patterns.
These suggest the trend is likely to resume after a pause. Examples:
Bullish flag on a strong NIFTY intraday rally
Rising channels or staircases in trending stocks
Triangles and wedges after big moves on MCX metals
These hint that the trend may be ending and could reverse direction:
Double tops after a strong rally in BANK NIFTY
Double bottoms in beaten-down mid-cap stocks
Head and shoulders on a weekly NIFTY 50 chart
These can break either way and demand additional confirmation:
Symmetrical triangles on USD/INR daily charts before major macro events
Tight ranges on index futures ahead of expiry
Here’s how chart patterns often show up in Indian instruments:
NIFTY 50 & BANK NIFTY – Flags, triangles and wedges on intraday charts are common during strong trend days. Double tops/bottoms and head & shoulders are more visible on daily/weekly charts.
USD/INR – Symmetrical triangles and channels often form around RBI events or global USD moves, with breakouts leading to sustained trends.
MCX Gold & MCX Crude – Flags, wedges and rounded tops/bottoms are frequent due to international volatility and gap openings.
NSE/BSE stocks – Cup and handle, ascending triangles and rounded bottoms often appear as stocks graduate from accumulation to uptrends.
The core list of chart patterns is the same globally, but below you’ll see them through an Indian lens.
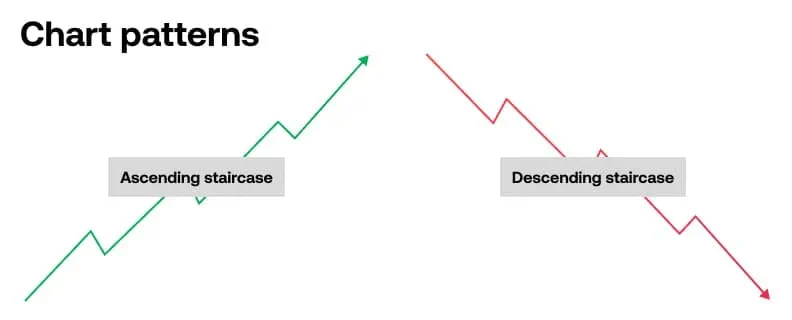
On a NIFTY 50 uptrend, you’ll often notice price pushing to a new high, then pulling back, but not all the way down. Each correction ends above the previous one. That is your ascending staircase — a series of higher highs and higher lows.
You can use these pullbacks to plan long entries in the direction of the uptrend.
In a falling BANK NIFTY market, the opposite happens: lower highs and lower lows form a descending staircase. Temporary rallies into prior swing highs can act as selling zones.
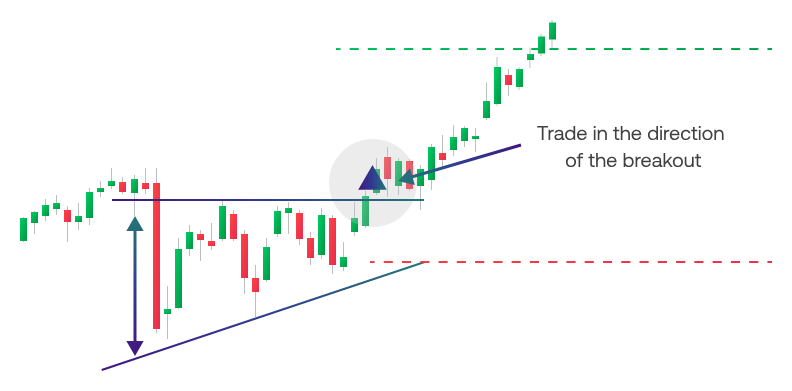
An ascending triangle is a bullish continuation pattern. Picture a stock on NSE repeatedly testing resistance near ₹X while forming higher lows each time.
Flat resistance at the top
Rising trendline beneath price
Breakout above resistance, ideally on strong volume, suggests an upside continuation
Indian example: An ascending triangle on NIFTY 50 daily chart just below a key round number before breaking to new highs.
Recommended image: NIFTY daily chart showing an ascending triangle at horizontal resistance.
Alt text: “NIFTY 50 daily chart with ascending triangle pattern and breakout above resistance.”
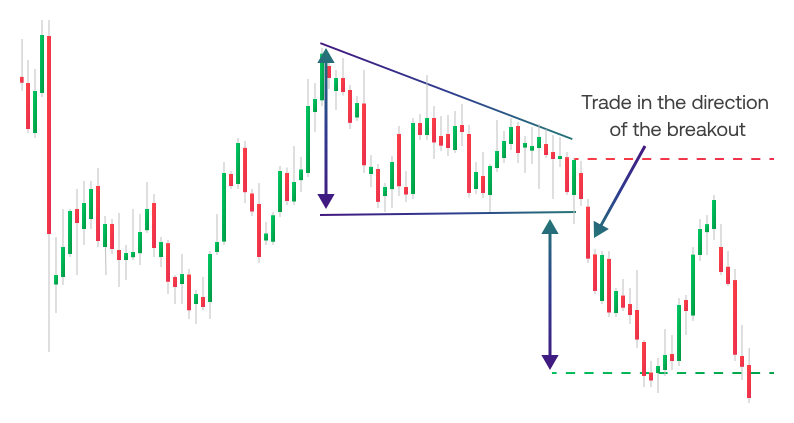
The descending triangle is a bearish pattern often seen in downtrending stocks or indices.
Flat support line at the bottom
Descending resistance line connecting lower highs
Breakdown below support confirms bearish continuation for many traders
Indian example: A descending triangle on BANK NIFTY ahead of a sharp sell-off after weak results or negative sentiment in financials.
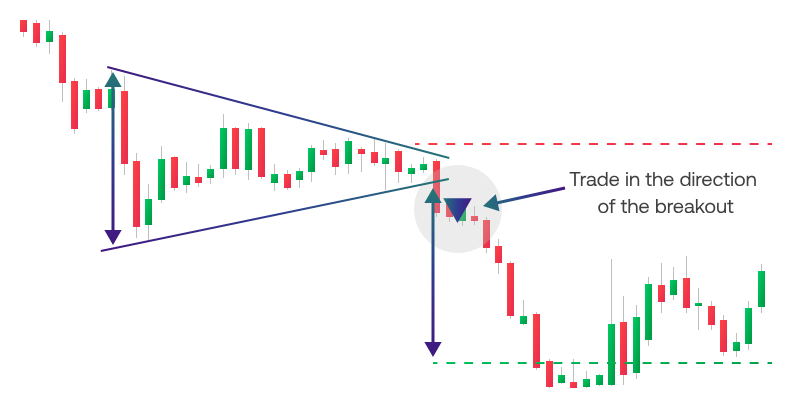
A symmetrical triangle has both support and resistance lines converging. It reflects compression and indecision.
Neither bulls nor bears control the market
Break can happen in either direction — confirmation is critical
Works well on USD/INR or MCX Gold ahead of data releases
Indian example: USD/INR daily chart consolidating in a symmetrical triangle before breaking out after an RBI policy announcement.
Flags appear after a sharp move, often on event-driven days.
Bullish flag – Sharp rise (flagpole) followed by a downward-sloping small channel. Breakout higher signals continuation.
Bearish flag – Sharp fall followed by a gentle upward channel. Breakdown lower confirms continuation.
Indian example: MCX Crude rallying after global news, then forming a small bearish or bullish flag before the next leg.
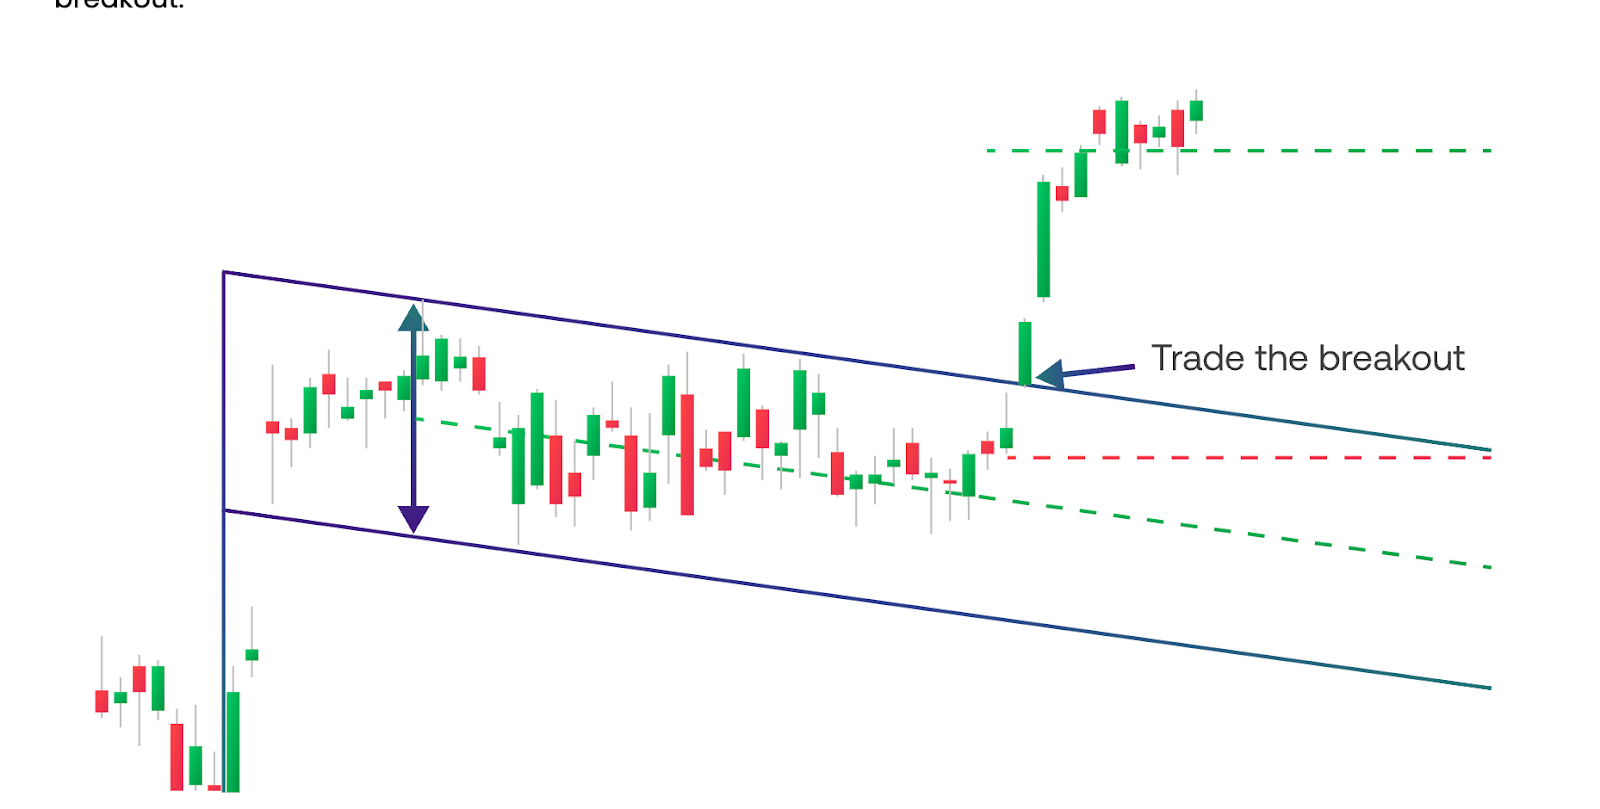
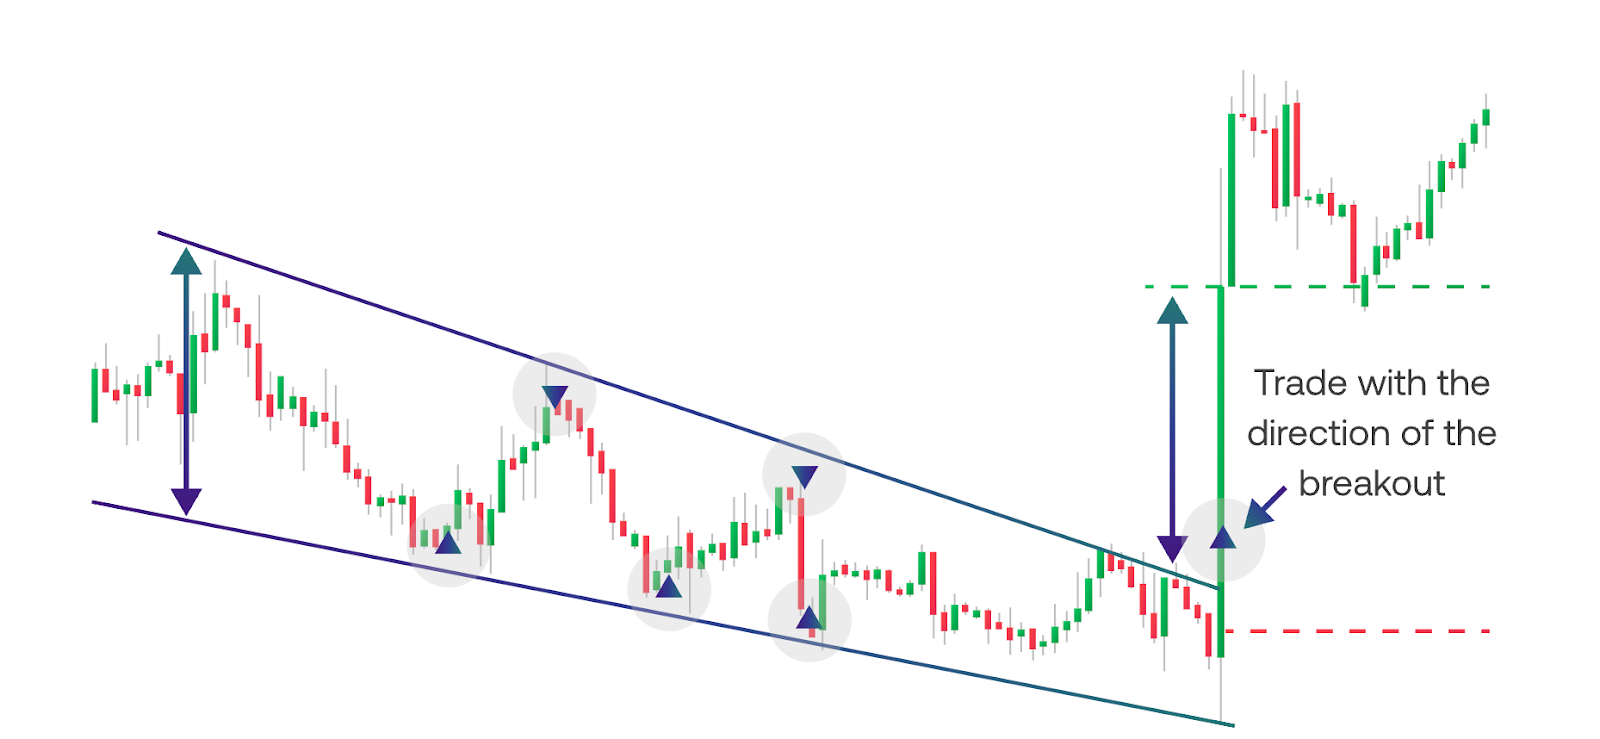
Wedges are like flags but with converging lines.
Rising wedge – Price moves higher within narrowing boundaries. Often interpreted as a bearish reversal sign in an uptrend.
Falling wedge – Price moves lower within narrowing boundaries, hinting at a bullish breakout.
Indian example: A rising wedge on NIFTY after a long rally, breaking down into a corrective phase; a falling wedge in MCX Gold before a rebound.
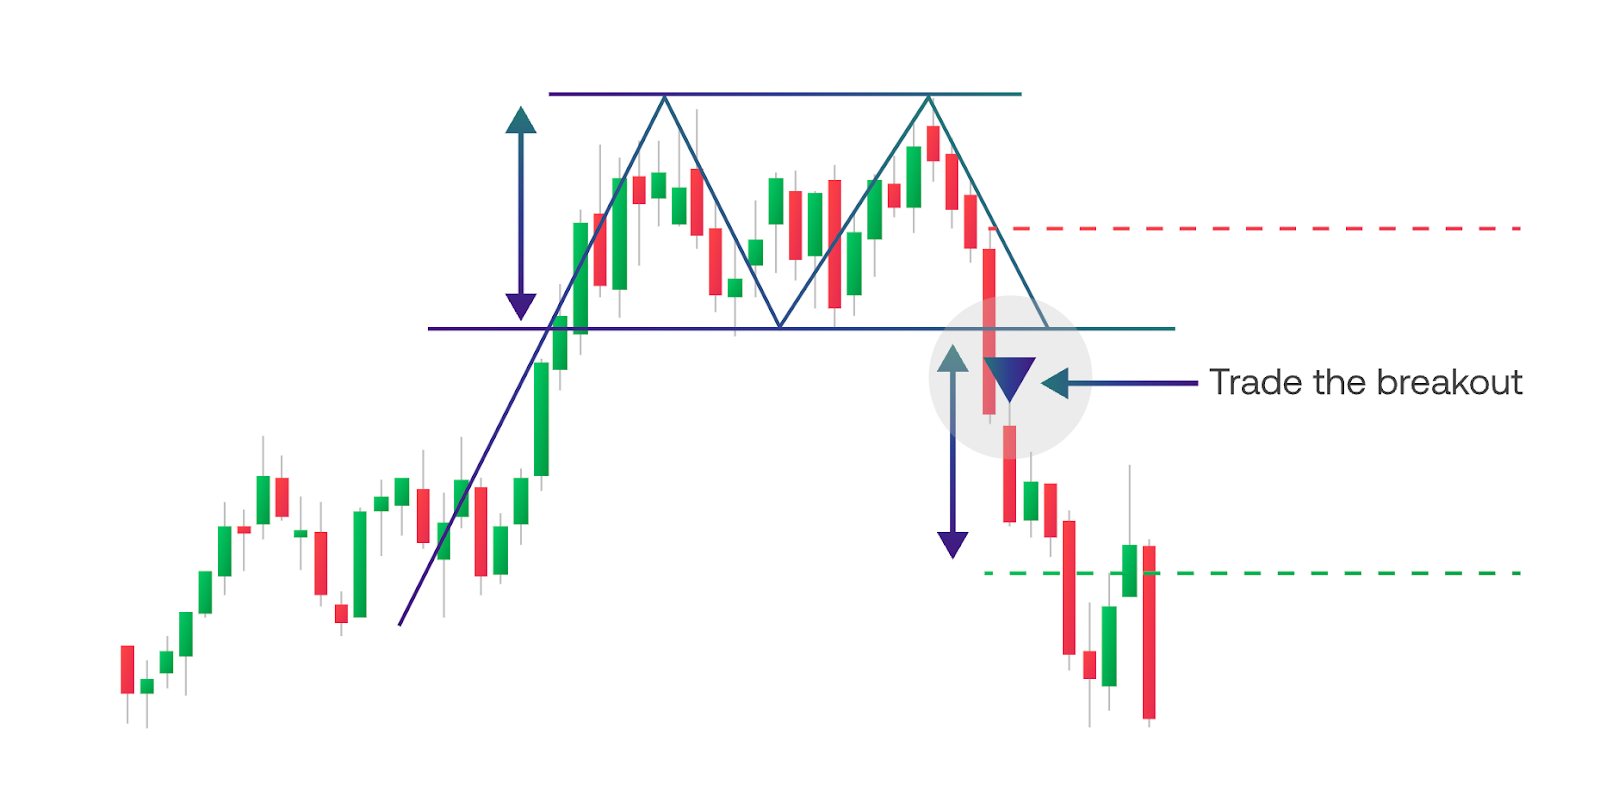
The double top often marks the end of a strong uptrend.
Two similar peaks at resistance
Neckline support between them
Break below the neckline confirms the bearish reversal for many traders
Indian example: A double top on BANK NIFTY around a psychological round number just before a deeper correction.
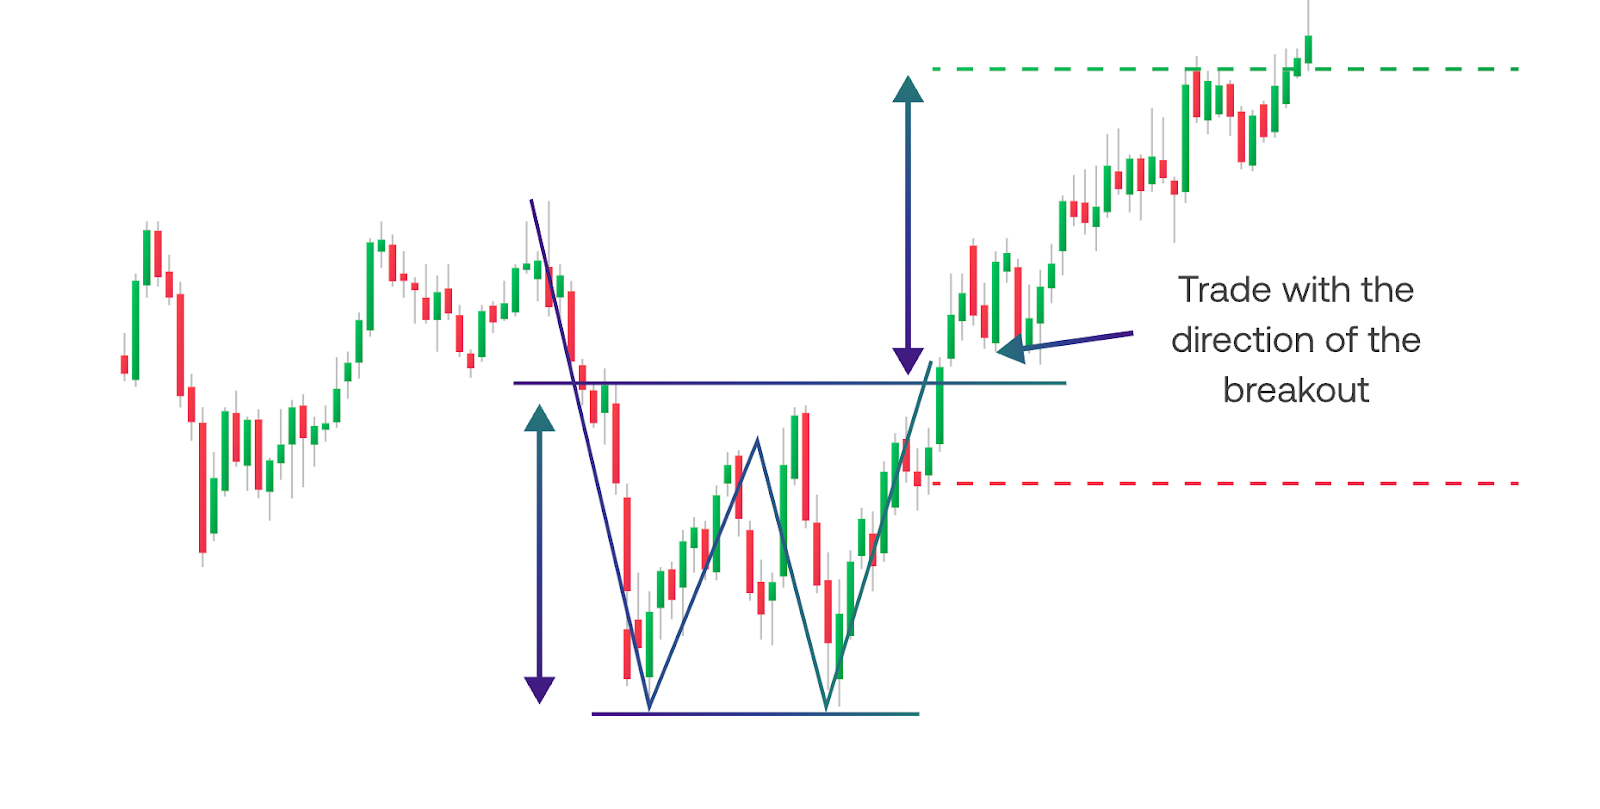
The double bottom is the bullish mirror image.
Two troughs at or near the same support zone
Neckline acting as resistance between them
Break above neckline signals potential trend reversal higher
Indian example: Double bottom in a beaten-down mid-cap NSE stock, followed by a move back into an uptrend once neckline resistance breaks.
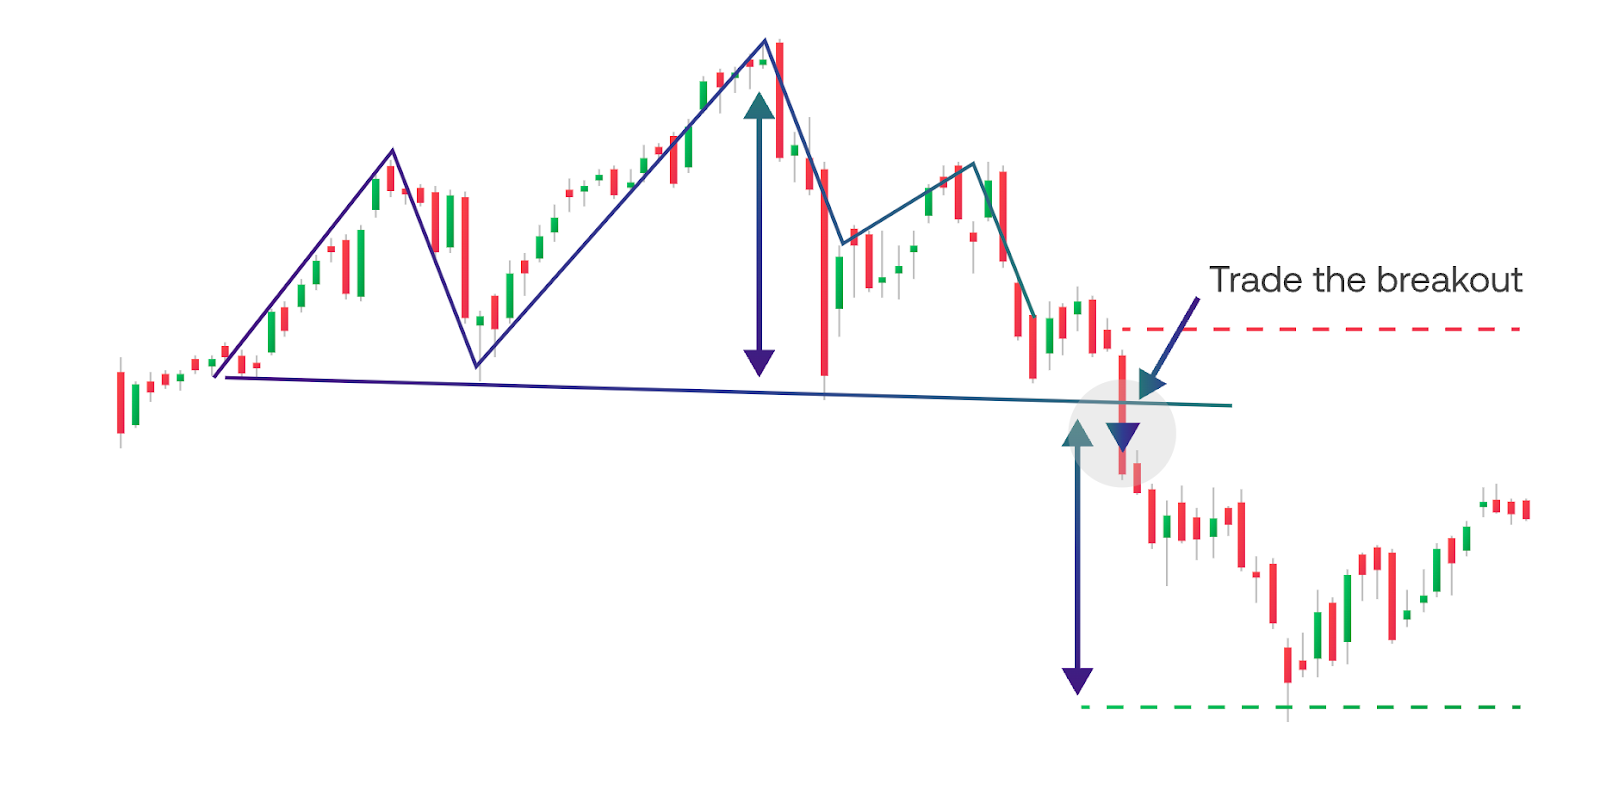
The head and shoulders is a classic bearish reversal pattern:
Left shoulder – rally and pullback
Head – higher high and deeper pullback
Right shoulder – lower high
Neckline – support connecting the two pullback lows
Breakdown below the neckline signals downside potential.
Indian example: NIFTY 50 weekly chart forming a head and shoulders after a multiyear bull run.
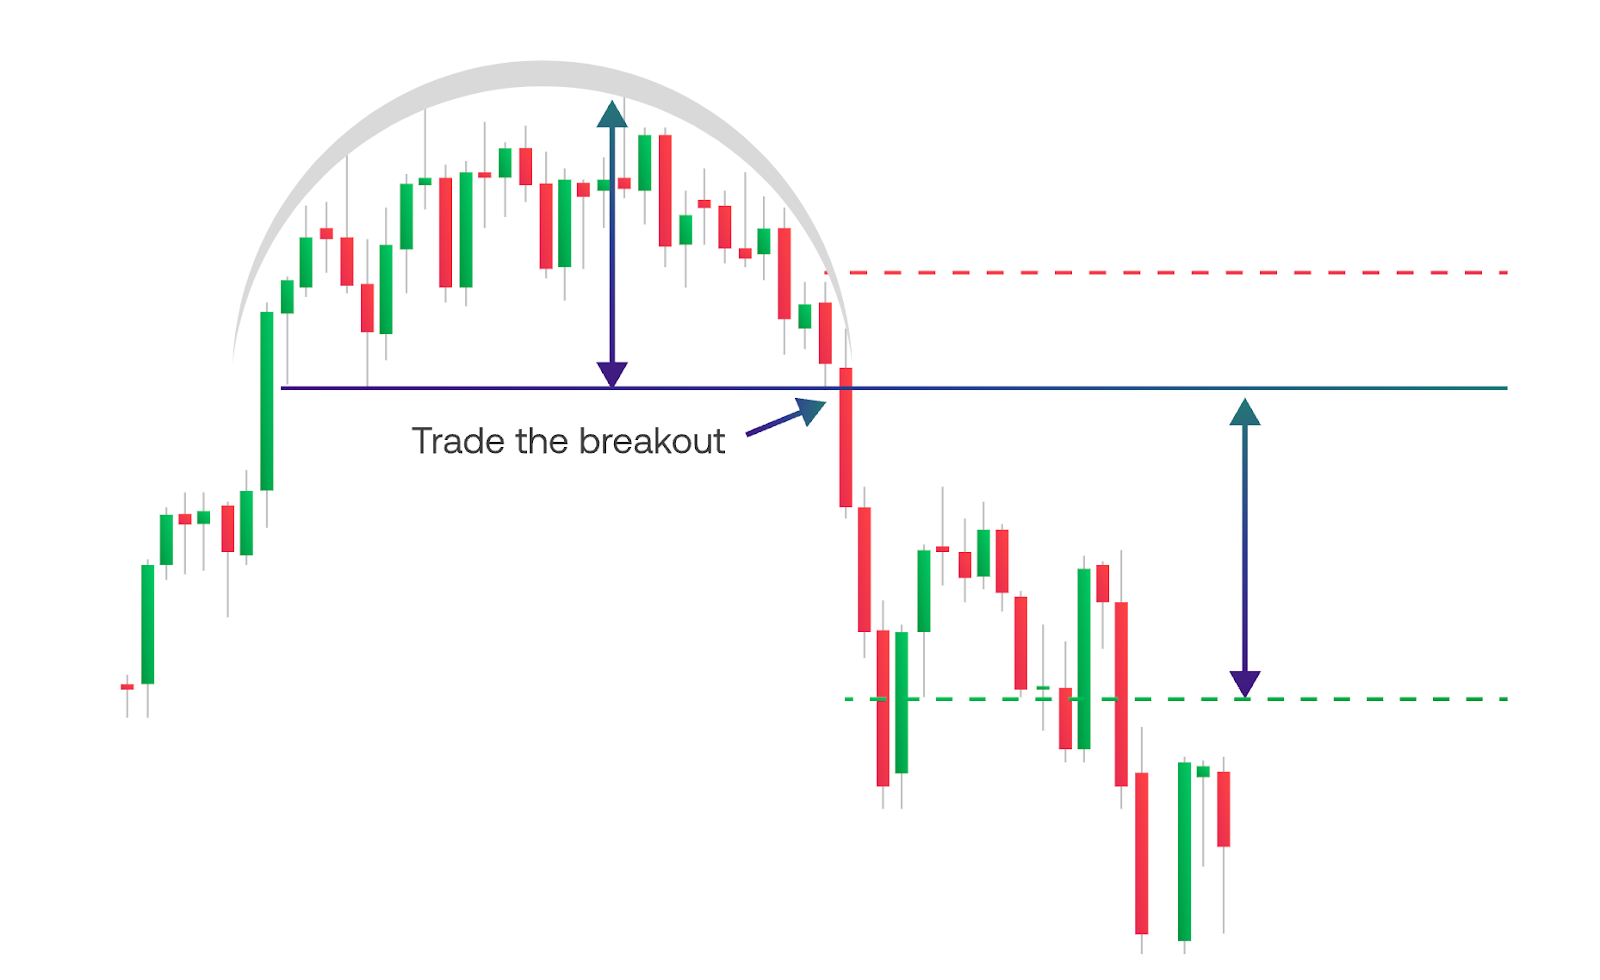
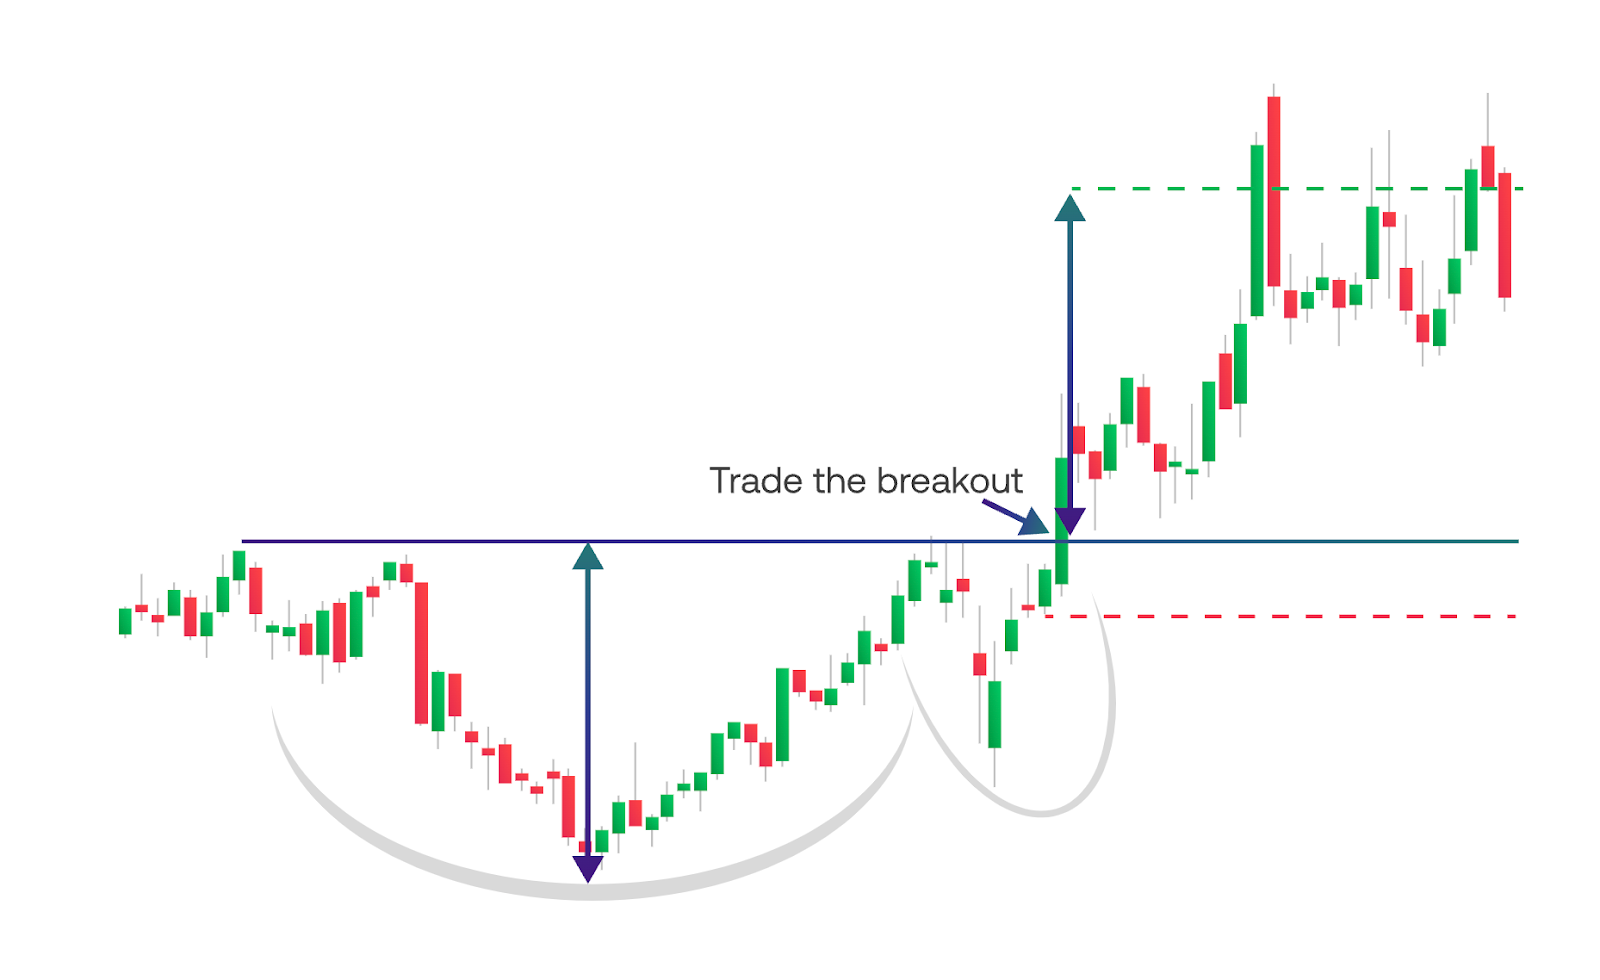
Rounded patterns reflect slow, steady sentiment shifts.
Rounded top – Gradual topping in an uptrend, leading to a downtrend.
Rounded bottom – Long accumulation phase, then transition into an uptrend.
Indian example: Rounded bottom in MCX Gold on the weekly chart before a long bullish phase.
A popular bullish continuation pattern, especially in stocks:
Cup – Smooth U-shaped pullback from a resistance area
Handle – Short-term consolidation or dip after the cup
Breakout above the cup’s resistance confirms the pattern for many traders
Indian example: Cup and handle in a strong NSE growth stock before a fresh breakout to new highs.
Here is a simple workflow you can adapt for NIFTY, BANK NIFTY, USD/INR or MCX charts.
Intraday (5-minute, 15-minute): Suitable for day trading NIFTY/BANK NIFTY or liquid stocks.
Swing (hourly, daily): Better for positional trades and avoiding noise.
Start by marking chart patterns on a higher timeframe (daily or hourly), then refine entries on a lower timeframe if needed.
Draw support and resistance lines (triangle boundaries, flag channel, neckline, etc.).
Confirm that the structure really matches a valid chart pattern, not just random candles.
For wedges and triangles, check that price is touching each boundary at least twice.
Typical approaches Indian traders use:
Breakout entry – Enter when price closes outside the pattern (above resistance for bullish, below support for bearish).
Retest entry – Wait for price to break out, then retest the broken level before entering, which can give tighter stops.
Avoid chasing price if the candle is already far from the pattern boundary.
Common rules:
For bullish trades, place your stop below the most recent swing low or below pattern support.
For bearish trades, place stops above the recent swing high or above pattern resistance.
Always size your position so that a stop-out on NIFTY, USD/INR or MCX does not breach your per-trade risk limit (for example, 1–2% of your trading capital).
Popular methods:
Measure the height of the pattern (triangle, flag, head and shoulders) and project it from the breakout point.
Use fixed risk-reward ratios like 1:2 or 1:3 to avoid taking big risks for small potential gains.
Consider partial profit-taking at intermediate levels (prior swing highs/lows, daily levels, etc.).
Indian traders often run into the same chart-pattern issues:
Only trading ultra-low timeframes (1-minute, 3-minute) on NIFTY/BANK NIFTY without any higher-timeframe context.
Ignoring gaps on indices and stocks, especially after news — gaps can distort patterns if not interpreted carefully.
Over-relying on a single pattern without checking volume, trend direction or broader market sentiment.
Entering before confirmation, just because a structure “looks like” a pattern.
Risking too much per trade and trying to recover losses quickly, which can lead to emotional decision-making.
Addressing these errors — especially timeframe selection and risk management — often improves results more than learning a new exotic pattern.
When using chart patterns in India, you must also think about rules and risk:
Trade through SEBI-regulated intermediaries – For equity, equity derivatives and some commodities, this means using SEBI-registered brokers and trading only on approved exchanges such as NSE, BSE, MCX, NCDEX, MSEI and India INX.
Respect RBI rules – Especially for currency products involving INR.
Understand product risk – Derivatives and leveraged products can lead to losses exceeding your initial margin if not controlled.
Separate learning from live risk – It’s sensible to practise chart pattern strategies in a demo or low-risk environment before committing meaningful capital.
Chart pattern education is not investment advice. You should always consider your financial situation, objectives and risk tolerance, and seek independent advice if needed.
Once you’re comfortable with basic chart patterns, you can refine how you use them on Indian markets:
Multi-timeframe confluence – For example, a head and shoulders on the NIFTY daily chart combined with a smaller rising wedge on the 1-hour chart.
Combine with Fibonacci tools – Use Fibonacci retracements and extensions to validate targets from chart patterns.
Volume confirmation – Look for rising volume on breakouts from triangles and flags, especially in NSE stocks and index futures.
Event awareness – Be cautious around RBI policy days, Union Budget, major global data and weekly/monthly expiry, where patterns can break but slippage and whipsaws are common.
The goal is not to make charts more complicated, but to increase the quality of your setups.
Before risking significant capital on NSE, BSE or MCX, it makes sense to practise chart pattern trading in a controlled environment.
With TMGM you can:
Study chart patterns on multiple markets – Explore forex, indices, metals and more to see how the same structures behave in different environments.
Use MetaTrader 4 and 5 platforms – Draw chart patterns with trendlines, channels and other tools, and combine them with indicators like RSI or moving averages.
TMGM’s focus on education and practice can complement your on-exchange trading in India, helping you build discipline and a rule-based approach to chart patterns.


The information provided on this website is of a general nature only and does not constitute personal financial advice. Before acting on any information on this website, you should consider the suitability of the information in relation to your objectives, financial situation and needs. Investing in CFDs and FX Margin Contracts carries significant risks and is not suitable for all investors. You may lose more than your initial deposit. You do not own, or have, any interest in the underlying asset. We recommend that you seek independent advice and ensure you fully understand the risks involved before trading. It is important that you read and consider the disclosure document before you acquire any product listed on the website. The information and advertisements offered on this website are not intended for use by any person in any country or jurisdiction where such use would be contrary to local laws and regulations. The Products and Services offered on this website are not intended for residents of the United States.
TMGM is authorized and regulated in various jurisdictions.
Trademax Australia Limited, trading as TMGM, is regulated by the Australian Securities and Investments Commission (ASIC), AFSL no. 436416 and is located at Level 28, One International Tower, 100 Barangaroo Avenue, 2000 Sydney, NSW Australia.
Email: support@tmgm.com.au
Trademax Global Limited, trading as TMGM, is authorized and regulated by the Vanuatu Financial Services Commission (VFSC), registration number 40356 and registered at 1276, Kumul Highway, Port Vila, Vanuatu, Republic of Vanuatu.
Email: support@tmgm.com
Trademax Global Markets (SE) Limited, trading as TMGM, is authorized and regulated by the Financial Services Authority (FSA) of Seychelles, with license number SD224. The company is registered at Office No 13, Providence Estate ABIS Centre, Mahe, Seychelles.
Email: support@tmgm.com
Trademax Global Markets (International) Pty Ltd, trading as TMGM, is authorized and regulated by the Financial Services Commission, Mauritius (FSC) with license no. GB22201012, and registered at 33, Edith Cavell Street C/o IQ EQ Fund Services (Mauritius) Ltd Port Louis, 11324 Mauritius.
Email: support@tmgm.com
Copyright © TMGM. All rights reserved


