


Understanding Fibonacci Retracement Levels
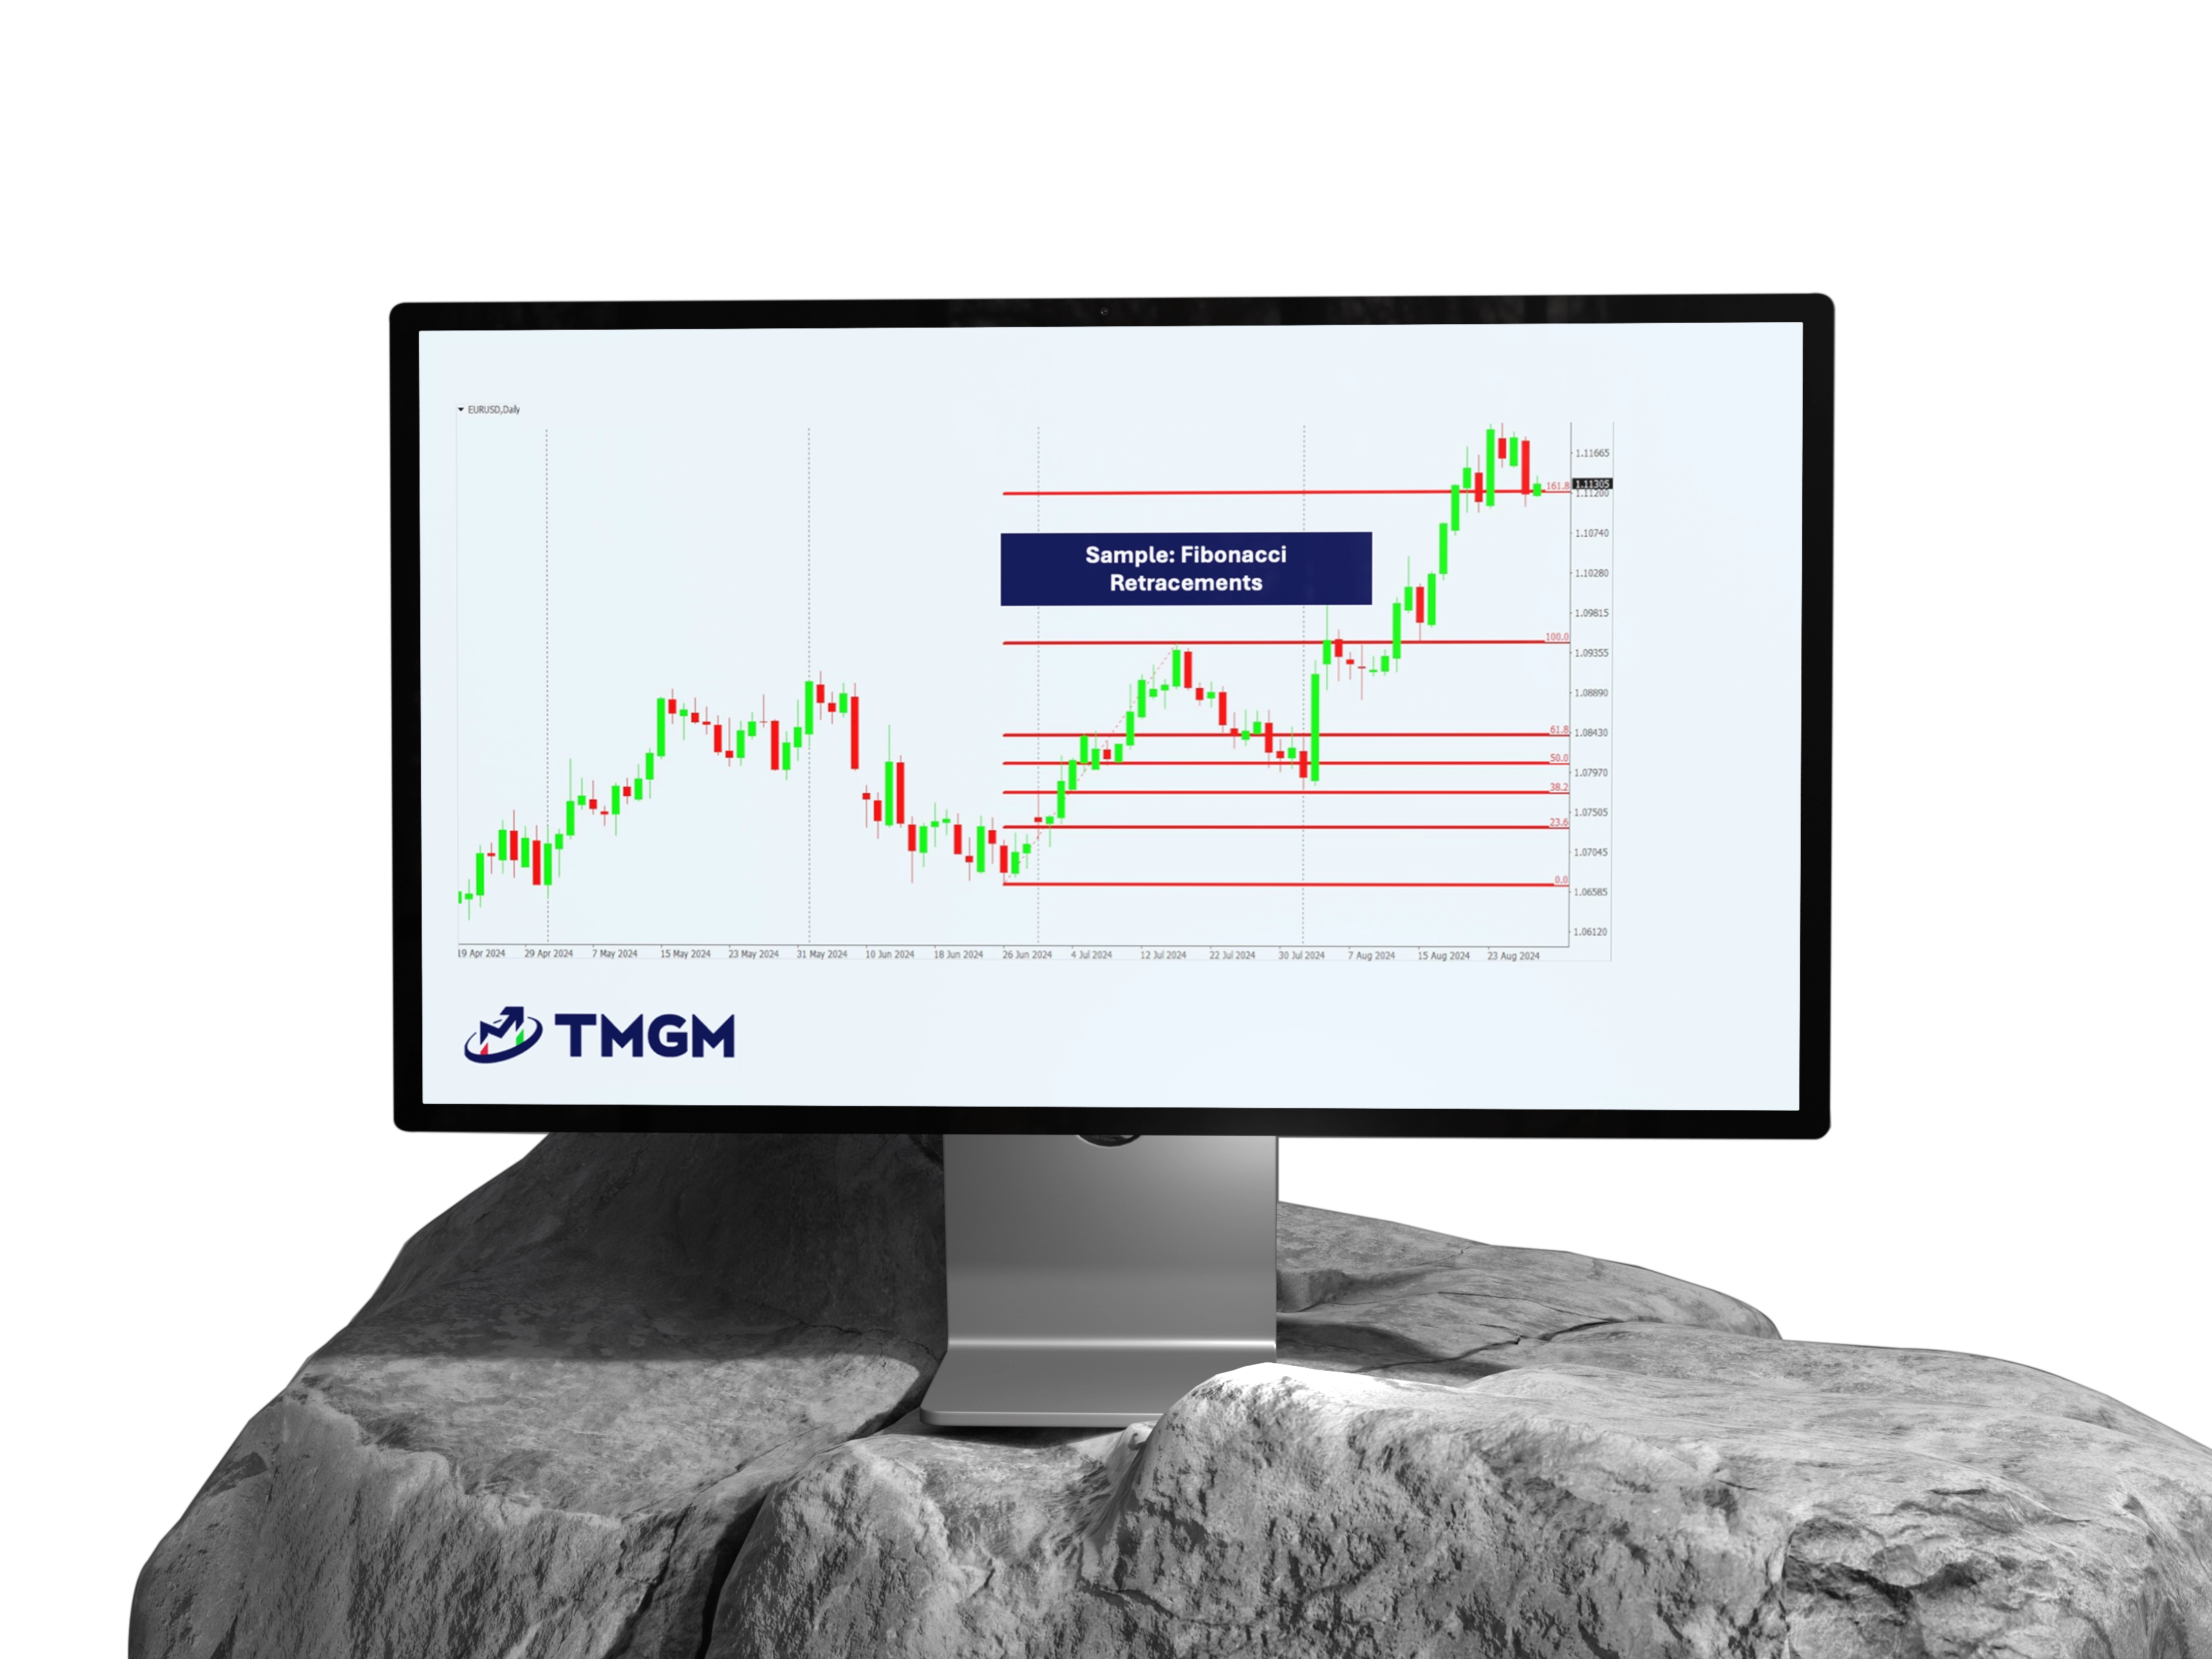
Fibonacci retracement levels are calculated based on the Fibonacci sequence. These levels assist traders in identifying potential areas where price reversals or continuations may occur.
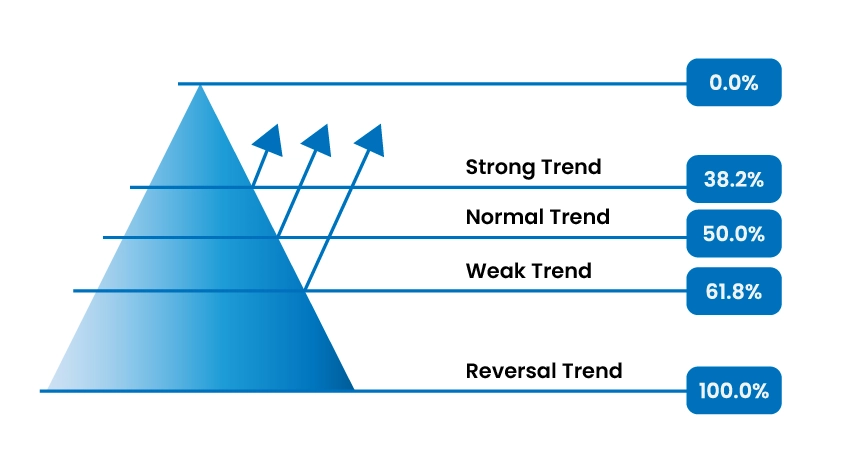
23.6% – Indicates minor retracements within strong trending markets.
38.2% and 50.0% – Mark moderate retracement zones, commonly used as entry points.
61.8% (Golden Ratio) – The key level representing significant support or resistance.
100% – Denotes a complete retracement back to the original price level.
These levels are displayed on price charts via the Fibonacci retracement tool, enabling traders to quickly identify critical price zones.
Why Fibonacci Works in Trading
Fibonacci levels are effective in trading for several reasons:
Psychological Influence: Many market participants monitor these levels, making them self-reinforcing.
Natural Market Behavior: Price movements often align with Fibonacci ratios.
Clear Support and Resistance: Provides well-defined areas for potential price reactions.
Versatility: Applicable across diverse market conditions and timeframes.
How to Use Fibonacci in Trading
Currency Pair: EUR/USD
Timeframe: 1-hour chart
Step-by-Step Guide:
Step 1: Identify the Trend
You observe that EUR/USD has been trending upwards, consistently forming higher highs and higher lows. Confirm this visually and by applying a 50-period moving average, noting that price remains above the moving average line, indicating an uptrend.
Step 2: Apply the Fibonacci Retracement Tool
Having identified an uptrend, select the Fibonacci retracement tool on your trading platform. Draw it from the most recent significant swing low (e.g., 1.0900) to the latest swing high (e.g., 1.1100).
Swing Low: 1.0900
Swing High: 1.1100
Step 3: Monitor Retracement Levels
The Fibonacci retracement levels will automatically display at 38.2%, 50.0%, and 61.8%:
38.2% level: approximately 1.1024
50.0% level: approximately 1.1000
61.8% level: approximately 1.0976
As the EUR/USD price retraces, it approaches the 61.8% level (1.0976), historically a strong support and potential reversal zone.
Step 4: Confirm with Additional Indicators
At the 61.8% Fibonacci retracement (1.0976), you observe:
The Relative Strength Index (RSI) dips below 30, indicating an oversold condition.
A bullish candlestick pattern appears, specifically a clear bullish engulfing formation, confirming buyer interest.
With these confirmations, you have a strong signal for a potential price reversal at this Fibonacci level. Consequently, you enter a long (buy) position near 1.0976, placing a stop-loss just below the retracement level (e.g., 1.0950), aiming for a target near the previous swing high at 1.1100 or beyond.
Key Fibonacci Trading Strategies
1. Reversal Trading Using Fibonacci Retracements
Objective:
Identify potential reversal points where price changes direction after retracing to key Fibonacci levels.
Implementation Steps:
Setup:
Focus on price retracements within a trending market, particularly near the 38.2% or 61.8% Fibonacci retracement levels, which often act as strong support or resistance triggering reversals.Entry Criteria:
Wait for clear reversal signals such as:Candlestick patterns: Pin bars, bullish or bearish engulfing candles, hammer, or shooting star formations.
Indicator Confirmation: Oversold or overbought conditions indicated by RSI below 30 or above 70.
For instance, if price retraces to the 61.8% level during an uptrend, look for bullish engulfing candles or pin bar signals to enter a long position.
Stop-Loss Placement:
Position your stop-loss just beyond the next Fibonacci level below (for longs) or above (for shorts), allowing for market fluctuations while controlling risk.Take-Profit Targets:
Aim for the previous swing high (in an uptrend) or swing low (in a downtrend). Alternatively, extend targets to Fibonacci extension levels such as 127.2% or 161.8% to maximize gains.
Practical Advice:
Always validate reversal signals with additional technical indicators like RSI, Stochastic, or MACD to reduce false entries.
2. Breakout Trading Using Fibonacci Levels
Objective:
Capture strong price moves following consolidation near key Fibonacci retracement levels.
Implementation Steps:
Setup:
Identify price consolidation or range-bound activity near a significant Fibonacci retracement level. The longer the consolidation, the higher the breakout potential.Entry Criteria:
Enter on a decisive breakout candle closing clearly above or below the Fibonacci level.
Additional Confirmation: Increased trading volume or momentum indicators like MACD support the breakout’s validity.Stop-Loss Placement:
Place stop-loss within the recent consolidation range. For example, if price breaks above the Fibonacci level, set stop-loss just below the consolidation’s lower boundary.Take-Profit Targets:
Target Fibonacci extension levels such as 127.2% or 161.8% for clear profit objectives.
Practical Advice:
Be cautious of false breakouts. Confirm breakouts with volume and momentum indicators before entering trades.
3. Trend Trading Using Fibonacci Extensions
Objective:
Utilize Fibonacci extension levels to establish realistic profit targets during strong trending phases.
Implementation Steps:
Setup:
Confirm a strong trend by analyzing price action—higher highs and higher lows for uptrends or lower highs and lower lows for downtrends.Drawing Fibonacci Extensions:
Identify recent significant swing low and swing high points. Draw the Fibonacci extension tool from swing low to swing high, then back to the retracement low (in an uptrend), or the reverse in a downtrend.Target Identification:
Monitor extension levels such as 127.2%, 138.2%, and especially 161.8%, where price often reacts strongly. These levels serve as effective profit-taking or scaling points.Stop-Loss Placement:
Set stop-loss orders below recent swing lows (for longs) or above recent swing highs (for shorts) to maintain favorable risk-reward ratios.Trade Management:
As price approaches extension targets, consider trailing stop-losses to secure profits or partially close positions at each level.
Practical Advice:
Combine Fibonacci extensions with trend indicators such as moving averages or ADX to confirm trend strength and enhance confidence in targets.
Advantages of Fibonacci Trading
User-Friendly: Supported by most charting software.
Broad Market Application: Effective across commodities, cryptocurrencies, and other markets.
Risk Management: Provides precise stop-loss and take-profit levels.
Improved Accuracy: Helps identify high-probability trade setups.
Limitations and Risks
Subjectivity: Selection of swing points can differ among traders.
Lagging Indicator: Based on past price data, not predictive.
False Signals: Requires confirmation from other technical tools.
Best Practices for Fibonacci Trading
Multi-Timeframe Analysis: Use higher timeframes to identify stronger confluence zones.
Combine with Indicators: Integrate Fibonacci levels with RSI, MACD, or other indicators.
Backtesting: Validate strategies on historical data before live deployment.
Risk Management: Always apply stop-loss orders and follow position sizing guidelines.
The Fibonacci trading method is vital for traders seeking structured and precise trading plans. By mastering retracement levels, combining them with other technical tools, and practicing disciplined risk management, traders can approach markets with enhanced confidence and improved outcomes.
Begin trading more effectively with Fibonacci today! Open your TMGM trading account to access global markets, professional charting tools, and refine your strategies in a risk-controlled environment.


