How to Trade Oil: A Beginner's Guide to Entering the Black Gold Market
Trading oil was traditionally dominated by major energy corporations and Wall Street, necessitating substantial institutional capital and financial resources. Today, however, oil trading is more accessible than ever. You can now trade oil online without requiring millions in initial capital. By choosing the right oil trading platform and gaining a solid understanding of the market, you can trade this commodity at TMGM. If this has caught your attention, here are the essentials of crude oil trading and the reasons it is often called black gold.
What is Oil Trading? Understanding the Oil Market
Oil trading is a major market. According to the USGS Mineral Commodity Summaries 2023 report and other sources, the crude oil market was valued at $42.1 trillion in 2022. In comparison, the top ten metal markets, including gold, were valued at $967 billion over the same period.
The widespread popularity of oil trading is partly due to the global dependence on oil as a commodity. From fueling vehicles and buildings to powering the energy sector, commercial transport, and manufacturing, oil is essential to many aspects of daily life.
The importance of oil makes it a highly valuable commodity. When a commodity is considered valuable, it becomes a sought-after trading instrument. That’s why leading oil trading exchanges, such as the New York Mercantile Exchange (NYMEX), are hubs of intense activity.
You can access these markets by joining TMGM and downloading our oil trading platform. Before you do, here are some key factors that influence the price of oil, which you will be speculating on when trading oil:’
Supply and demand: when supply is limited and demand is high, oil prices rise. Conversely, if there is an abundant supply of barrels and demand is low, crude oil prices fall.
Geopolitical events: decisions by global leaders, especially those from the G10 or OPEC countries, can significantly impact oil prices. For example, conflict in an OPEC member country can disrupt oil production, reducing supply and pushing prices higher.
Economic factors: the economic health of countries affects oil prices. If a country experiences currency weakness and GDP decline, leading to reduced imports, demand for oil may decrease, causing prices to drop.
Exploring Methods to Trade Oil
Oil trading, simply put, involves buying and selling large quantities of oil. One lot equals 1,000 barrels of oil. Since most traders do not have the capacity to store even a single barrel, let alone 1,000 barrels, crude oil trading primarily involves price speculation.’
This means you speculate on oil price movements through various instruments rather than owning the physical commodity (i.e., barrels of oil). Common financial instruments used for oil trading include:
Key Considerations Before Trading Oil
Trading crude oil can be profitable but carries significant risks. Your primary objective, beyond generating profits, should be to minimize risk exposure. The only way to achieve this in oil trading is by adhering to a core set of disciplined principles.’
The most critical actions to take in the oil trading market are:
Develop a trading plan that includes clear financial goals, loss limits, and tailored strategies for different oil trading instruments. For example, your approach to CFD oil trading may differ from that for oil-focused ETFs.
Timing is crucial in oil trading. Ideally, trade when markets are active, as price volatility increases opportunities for profitable long and short positions. The New York Mercantile Exchange (NYMEX) hours, between 20:00 and 13:30 (UTC+8), are among the most active.
Practice effective money management. Never risk more than you can afford to lose. Specifically, consider the inherent risks of oil trading when sizing your positions. The following section elaborates on money management and its connection to lot sizes.
Fundamental Oil Trading Strategies for Beginners
A key concept frequently discussed in oil and gas trading courses is lot sizing. As noted, oil futures trading is based on lots, where one lot equals 1,000 barrels of oil. Understanding lot size and how to calculate it is essential for trading oil online.’
Why? Because lot size determines the trade’s cost, which directly affects your risk exposure. Simply put, selecting an appropriate lot size helps prevent overexposure. This is a fundamental aspect of money management, one of the most critical oil trading strategies to master.’
Therefore, you must know how to calculate lot sizes when using an online oil trading platform.
How to Calculate Lot Size in Oil Trading
Standard lots equal 1,000 barrels of oil. However, fractional lots can be traded on advanced oil trading platforms. Fractional lots represent a portion of the standard lot size, based on 1,000 barrels.’
For example, a 0.1 lot represents 10% of a standard lot, or 100 barrels of oil. After selecting your lot size, consider how many lots you want to trade and the current crude oil price.’
EXAMPLE
Assume the price of oil is $50 per barrel.
You want to trade 1 fractional lot.
The lot size is 0.01, which equals 1% of a standard lot, or 10 barrels of oil.
Based on these parameters, the cost to open the trade is:
50 x 10 = $500
This amount represents the full cost to open the trade without leverage. Trading oil with leverage has pros and cons. The advantage is that you only need to commit a fraction of this cost, known as the margin.
For instance, 1:50 leverage means you must provide 1/50 = 0.02 (2%) of the trade value. In this example, trading oil with 50:1 leverage requires $10 margin (2% of $500).
These examples illustrate that lot size, oil price, and leverage determine the capital needed to open oil trades. While you cannot control crude oil prices, you can adjust lot size, number of lots, and leverage to manage risk and potential returns. Consider these variables carefully to enhance your trading success.
In addition to money management, here are three additional factors to consider:
Long vs. Short Oil Trades
CFD oil trading enables taking both long and short positions. This flexibility is advantageous in the volatile oil market, where prices can fluctuate significantly daily. Being able to go long when expecting price increases and short when anticipating declines is beneficial.’
Technical Indicators for Oil Trading
Our oil trading platform allows overlaying technical indicators on daily price charts. These tools provide insights into market dynamics, including market sentiment. In other words, technical indicators assist in forecasting price direction.
Popular technical indicators used by experts in crude oil trading include:’
Moving Averages (MA) – – an indicator that calculates the average price over a specified period.
Moving Average Convergence Divergence (MACD) – – this indicator subtracts the 26-day Exponential Moving Average (EMA) from the 12-day EMA to generate the MACD line. The 9-day EMA of the MACD serves as the signal line. A positive signal line indicates a bullish market, while a negative signal line suggests bearish conditions.’
Relative Strength Index (RSI) – – measures price momentum over time to identify overbought or oversold conditions. An overbought commodity may be due for a price decline due to overvaluation, and vice versa.’
Chart Patterns Used in Crude Oil Trading
In addition to indicators, charts on your oil trading screen reveal patterns that provide insights into market sentiment. Some chart patterns to study through the TMGM Trading Academy include:
Bullish Engulfing
A two-candle reversal pattern where the second candle completely engulfs the first.
Three Outside Up
Typically signals the end of a downtrend and a reversal. A bearish candle is followed by a bullish candle that fully covers it, then a third bullish candle confirms the reversal.
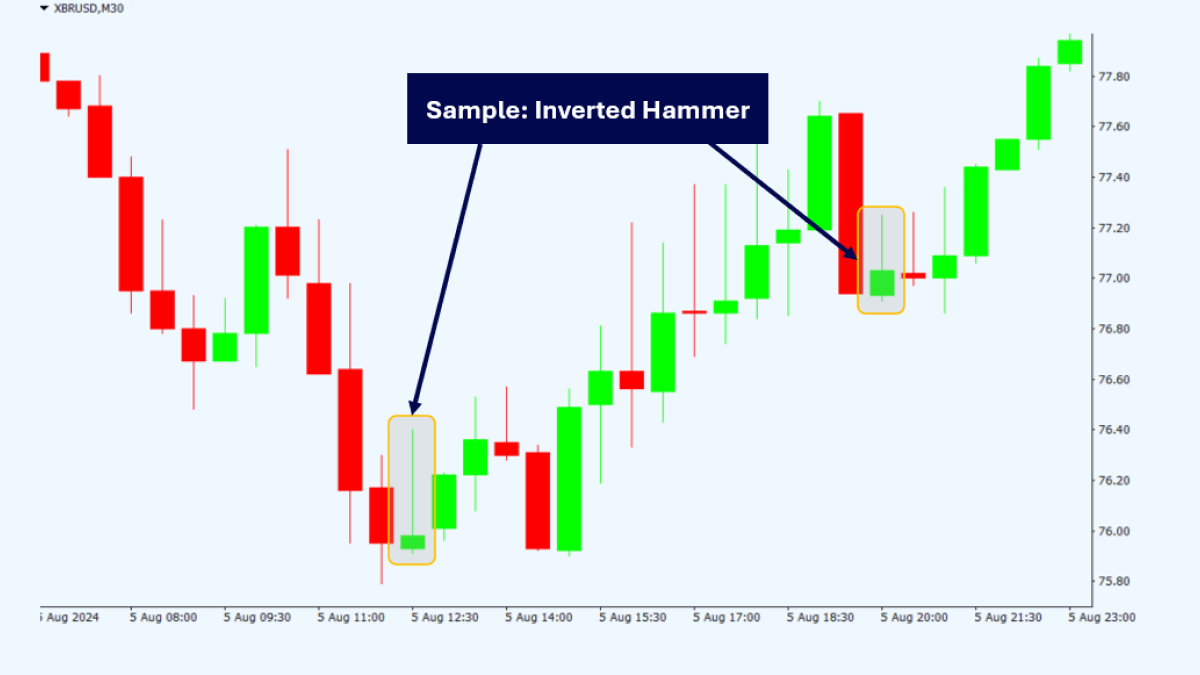
Inverted Hammer
A candlestick pattern resembling an upside-down hammer, usually appearing during downtrends and signaling a reversal.
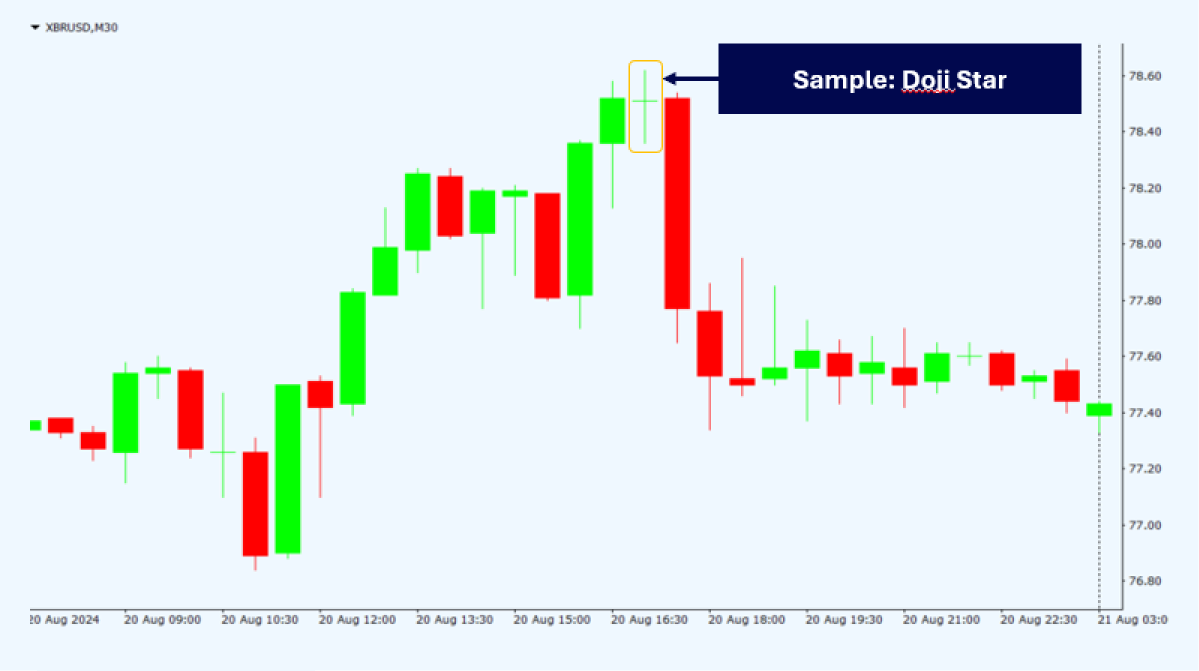
Doji Star
Doji, meaning “the same thing” in Japanese, are candlesticks with nearly identical open and close prices. Doji stars form above or below trends and can indicate potential reversals.
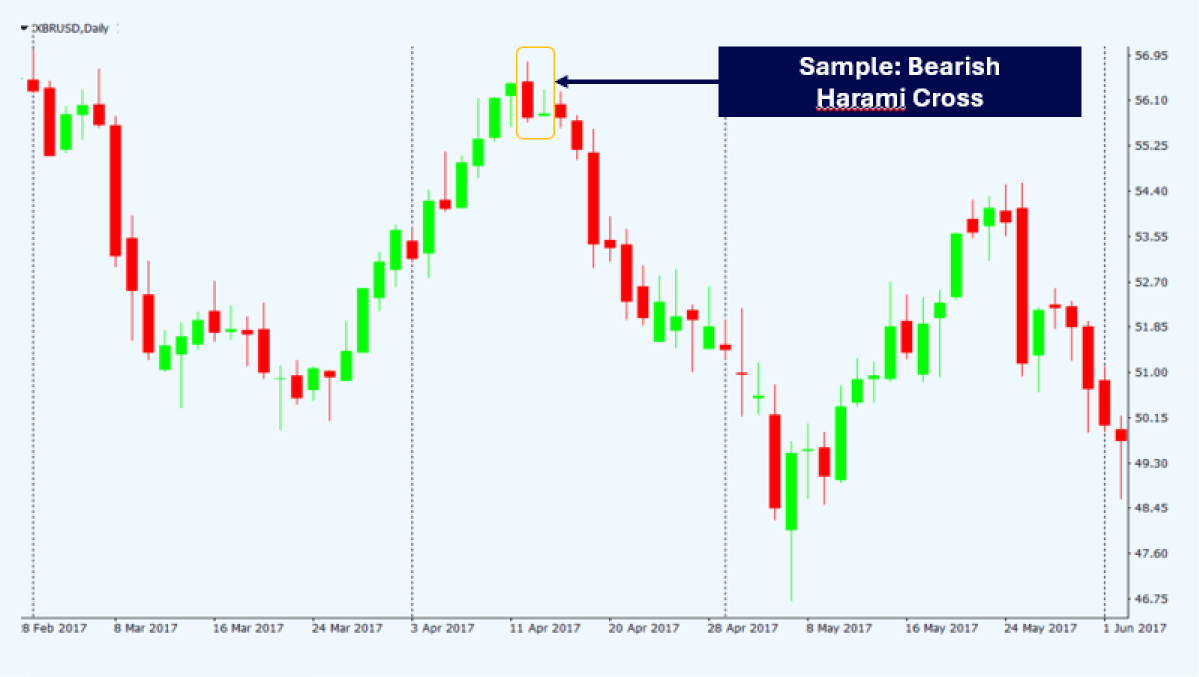
Harami Cross
A variation of the Harami pattern consisting of two candles within a trend, where the second is a Doji fully enclosed within the first candle.
Discipline in Oil Trading
Oil trading, like all trading, carries inherent risk, and outcomes can be volatile. You must be prepared emotionally, mentally, and practically. Developing the right mindset involves basing decisions on data rather than emotions.
The practical aspect is simplified by using a robust trading platform for crude oil. You can set stop-loss and take-profit orders that automatically close positions based on predefined criteria, ensuring your trades are governed by data, not impulse.
Begin Your Oil Trading Journey with Confidence Today
This guide provides a strong foundation, but don’t stop here. Utilize all TMGM tools and resources to deepen your understanding of the oil trading market before starting. Once you grasp the fundamentals of crude oil trading, download our trading platform and open an account.
Then, once verified, make a small deposit and enter the live oil trading markets. Start with the smallest lot sizes to gain experience without risking significant capital. From there, you can gradually increase your exposure and explore the full range of market opportunities.
Trade Smarter Today


Account
Account
Instantly


