


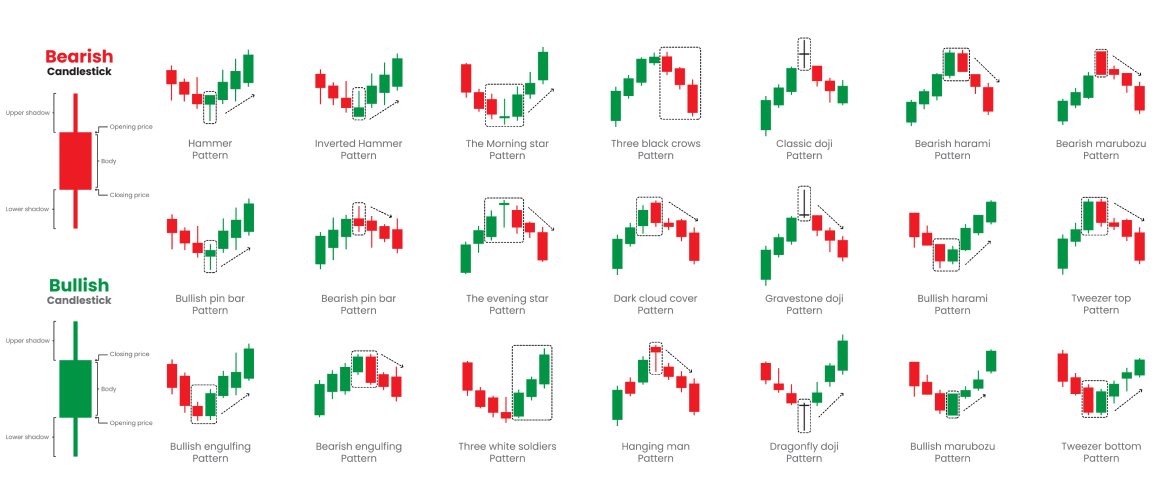
Reversal Candlestick Patterns
What is Price Action? A Brief Overview
Before exploring reversal candlestick patterns, it's crucial to understand the fundamentals of price action. Price action analysis involves studying historical price movements to identify patterns and inform trading decisions.
Unlike other analytical methods that depend on technical indicators or algorithms, price action focuses solely on the price itself. This technique is especially favored by traders on platforms like TMGM, where a direct interpretation of market movements can provide a competitive advantage.
Reversal Candlesticks: Your Gateway to Market Turning Points
Reversal candlestick patterns are specific formations within price action that signal a potential change in market direction. These patterns emerge when a bullish or bearish trend starts to lose momentum, indicating a likely shift in the opposite direction.
Identifying these patterns can be highly beneficial when trading on TMGM, as they provide early alerts that enable you to adjust your trading strategy proactively.
Key Reversal Candlestick Patterns
Doji Candlestick
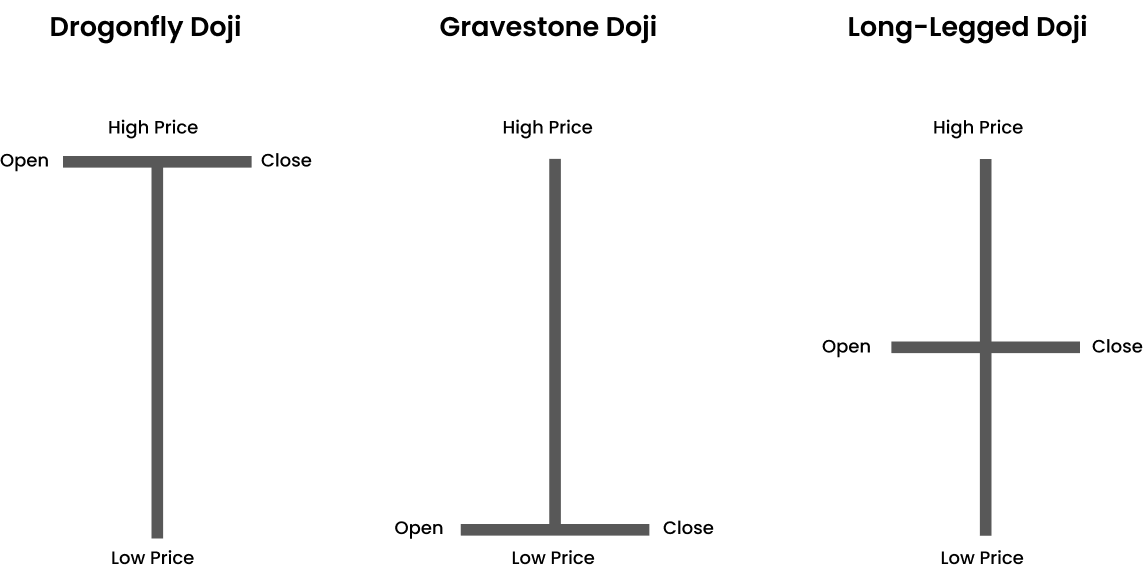
The Doji is a prevalent reversal candlestick pattern characterized by nearly identical opening and closing prices, reflecting market indecision. On TMGM, detecting a Doji following a strong trend may signal an impending reversal.
Hammer and Inverted Hammer
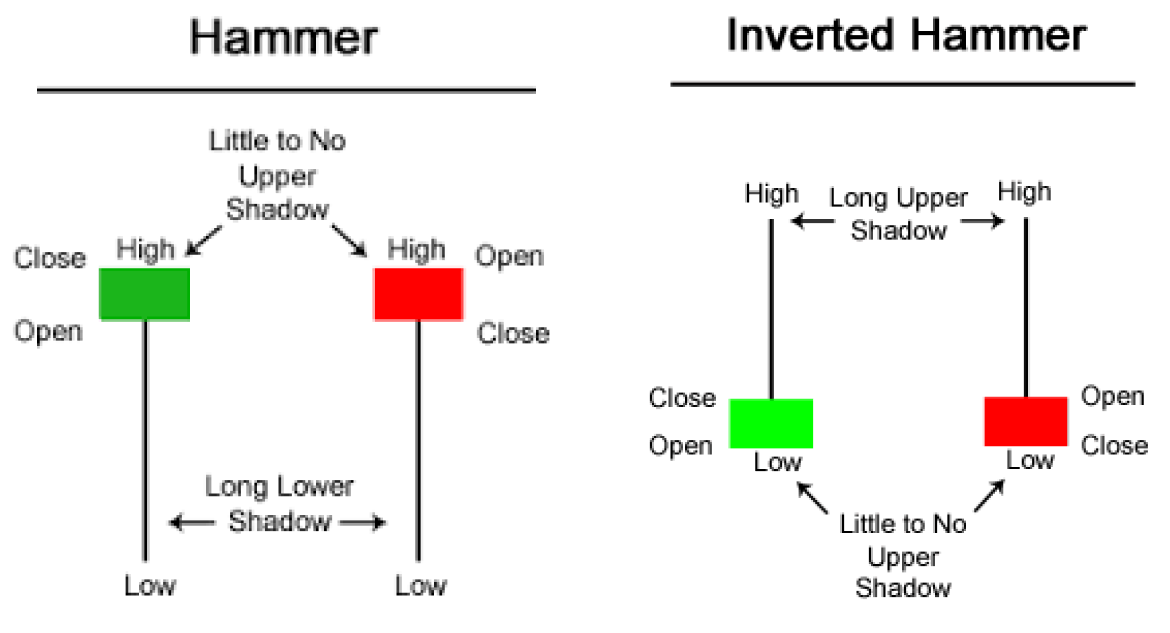
Source: Commodity.com
These patterns feature a small real body with a long lower or upper shadow. A Hammer forms after a downtrend, indicating a potential bullish reversal, whereas an Inverted Hammer appears after an uptrend, suggesting a possible bearish reversal. Recognizing these on the TMGM platform can assist in anticipating shifts in price momentum.
Engulfing Candlestick
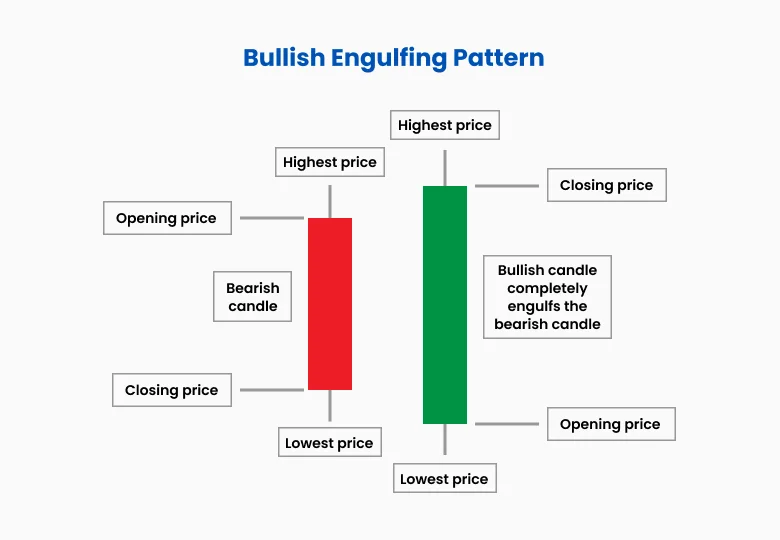
An Engulfing pattern occurs when a smaller candle is completely overtaken by a larger candle. A Bullish Engulfing pattern following a downtrend can indicate the start of an upward trend, while a Bearish Engulfing pattern after an uptrend may signal an imminent downturn.
How to Trade Reversal Candlesticks on TMGM: A Step-by-Step Guide
Step 1: Monitor Price Action Meticulously
To trade reversal candlestick patterns effectively on TMGM, closely observe the price action of your selected asset. Look for signs of trend exhaustion, which often precede reversals. Mastery of price action enables you to pinpoint optimal entry and exit points with enhanced precision.
Step 2: Identify Reversal Candlestick Patterns
Once you have established a clear understanding of the price action, begin identifying reversal candlestick formations. Whether it’s a Doji, Hammer, or Engulfing pattern, these signals often precede market reversals. TMGM’s advanced charting tools allow you to detect these patterns in real time, keeping you ahead of market movements.
Step 3: Confirm the Signal
Before executing a trade based on a reversal candlestick pattern, it is vital to confirm the signal. This can be achieved by analyzing supplementary price action indicators such as support and resistance zones or by verifying volume trends to ensure they corroborate the reversal signal. TMGM’s platform provides various tools to assist in validating these patterns prior to trade execution.
Step 4: Execute Your Trade
Once the reversal signal is confirmed, proceed to execute your trade promptly. Whether initiating a new position or closing an existing one, utilize TMGM’s order execution features to set stop-loss and take-profit orders, thereby managing your risk effectively.
Trading Responsibly with TMGM
When trading on TMGM, it is essential to ensure your strategies comply with regulations enforced by major authorities such as the European Union and the Australian Securities and Investments Commission (ASIC).
A solid understanding of price action and reversal candlestick patterns supports informed decision-making that aligns with regulatory standards. Additionally, to safeguard your capital, always implement risk management practices, including setting stop-loss orders and controlling exposure.
Leveraging Price Action and Reversal Candlesticks on TMGM
Mastering price action, particularly through the analysis of reversal candlestick patterns, can substantially improve your trading outcomes on TMGM. By recognizing these critical patterns, you will be better positioned to anticipate market reversals and execute strategic trades. As with any trading approach, ongoing education and practice are key, so invest time in honing your skills and utilizing the powerful tools available on TMGM.


